Do you know what is bar chart in technical analysis? What is technical analysis?
Technical analysis is one of the important methodologies of stock selection and to make buy or sell decision.
Before we start analyzing any chart, the first selection we make is the format of the price chart.
There are various types of price chart options like a line chart, candlestick chart, bar chart in technical analysis but the commonly used charts in traders community is bar chart and candlestick chart.
However, one chart you should not use is line chart since it provides the least amount of information.
| Table of Contents |
|---|
| What is Bar Chart in Technical Analysis? |
| How are bar charts constructed? |
| Different types of bars |
| Bottomline |
What is Bar Chart in technical analysis?
Bar chart in technical analysis also known as OHLC charts are used in charting and studying of chart patterns.
It is one of the most popular forms of stock charts and was the most widely used charts before the introduction of candlestick charts.
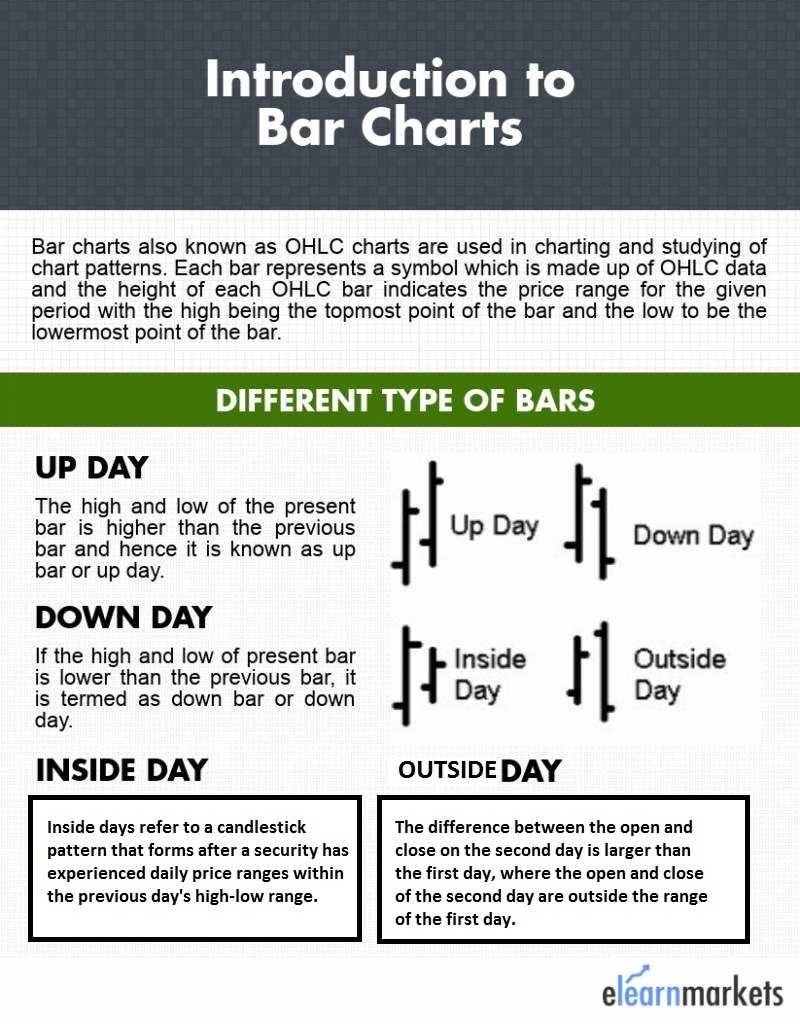
Each bar chart in technical analysis represents a symbol which is made up of OHLC data which are typically used to illustrate price movement of a financial instrument over a period of time.
The height of each OHLC bar indicates the price range for the given period with the high being the topmost point of the bar and the low to be the lowermost point of the bar.
However, the time period could be either 1 minute, 5 minutes, 15 minutes, 1 hour, 4 hour, 1 day, 1 week, 1 month etc and each has its own bar as per the desired time period and accordingly it can be 1 minute bar, 1 day bar or 1 week bar.
Moreover, some charting software use colors to indicate bullish or bearishness of a bar vis-a-vis to the close of the previous bar.
Learn basics of trading with Technical Trading Made Easy Course by Market Experts
This makes the OHLC bar chart much similar to the candlestick chart, but it lacks clarity as compared to the candlestick chart pattern.
How is bar chart in technical analysis constructed?
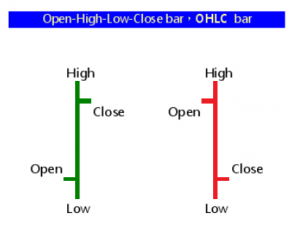
To construct bar chart, the OHLC data is used and hence the name OHLC chart.
In that vertical line, a small horizontal line (small tick) will be attached both on the left and the right-hand side.
The one on the left side indicates the opening price while one on the right-hand shows closing price.
The bars will provide different colors depending upon whether the prices increased or fell in that period.
For instance, the red color indicates a down bar as compared to the previous bar while green candle indicates up bar vis-a-vis the previous bar.
Different types of bars
There are basically four combinations of bar charts which includes-
Up day
The high and low of the present bar is higher than the previous bar and hence it is known as up bar or up day. The traders who are unable to devote much time in analyzing charts of various securities may benefit from scan section in the StockEdge mobile app.
Down day
If the high and low of the present bar is lower than the previous bar, it is termed as down bar or down day.
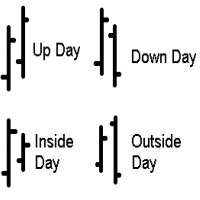
Inside day
If the high of the present bar is lower than previous bar high and the low of the present bar is higher than the low of the previous bar, then the present bar is termed as an ‘inside day’.
Also read: Mastering Inside bar trading strategy
Outside day
If the high of the present bar is higher than the previous bar while the low of the present bar is lower than the previous bar, it is known as outside bar.
Bottomline
Though bar chart is very commonly used chart pattern amongst the trader’s community it ’s not a confirmation that what you expected will actually trigger.
In such a scenario, you should use them in conjunction with other technical indicators and pattern for a better signal.
Happy Learning!!


Very informative article.
Hi,
Thank you for Reading!
Keep Reading!
As a beginner in market I get tremendous help to analyse my and create my portfolio
Hi,
Thank you for Reading!
Keep Reading