
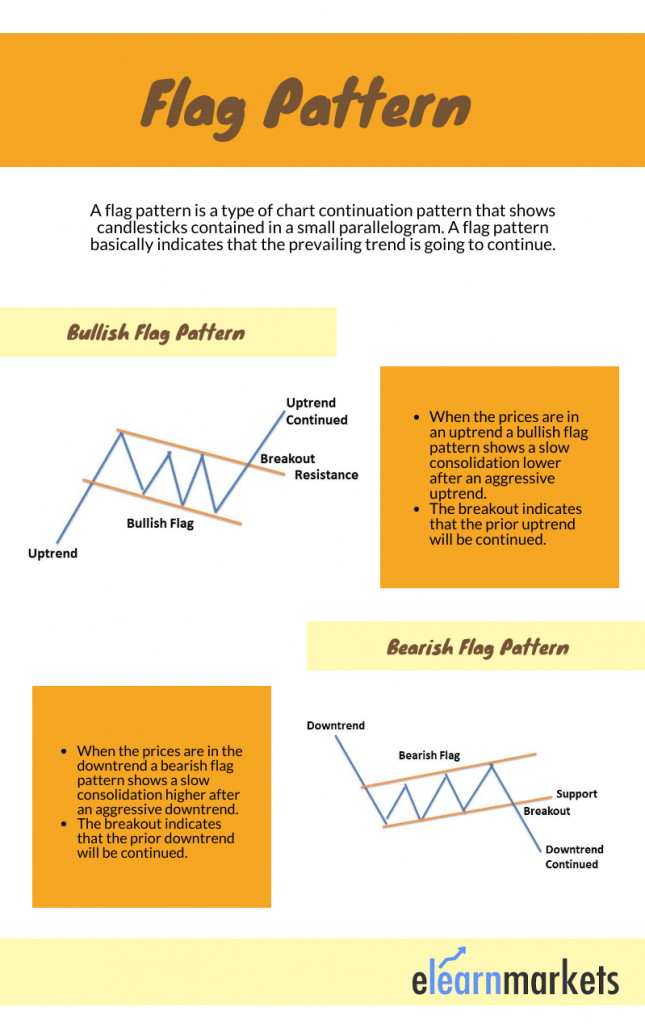
A flag pattern is a type of chart continuation pattern that shows candlesticks contained in a small parallelogram.
It is an area of consolidation which shows a counter-trend move that follows after a sharp price movement.
The pattern consists of between five to twenty candlesticks. In this blog, we will be discussing the formation of this pattern as well as how to trade with this pattern.
Table of Contents
What is a Flag pattern?
As the name suggests, this pattern looks similar to a flag or a flagpole.
After a sharp price movement, either upward or downward when the prices enter a consolidation phase then the flag pattern may be formed.
It basically indicates that the prevailing trend is going to continue. This pattern allows traders to enter the market in the middle of the trend.
The breakout of prices in its prior trend helps the traders to enter the market at lower prices than the prices before the formation of the pattern.
Depending upon whether the market is in an uptrend or downtrend, it can either be bearish or bullish.
What is the Bullish Flag Pattern?
When the prices are in an uptrend a bullish flag pattern shows a slow consolidation lower after an aggressive uptrend.
This indicates that there is more buying pressure moving the prices up than down and indicates that the momentum will continue in an uptrend.
Traders wait for the price to break above the resistance of the consolidation after this pattern is formed to enter the market.
The breakout indicates that the prior uptrend will be continued.
What is the Bearish Flag Pattern?
When the prices are in the downtrend a bearish flag pattern shows a slow consolidation higher after an aggressive downtrend.
This indicates that there is more selling pressure moving the prices down rather than up and indicates that the momentum will continue in a downtrend.
Traders wait for the price to break below the support of the consolidation after this pattern is formed to enter in the short position.
Formation
Here is the formation of bullish and bearish chart patterns:
Trading Strategy
Traders can enter into a trade when the price breaks above or below the upper or lower flag trend lines.
It is formed when there is an increase in the demand or supply that makes the prices move up or down.
In the case of a bullish flag pattern, an increase in supply stops the prices to rise. Due to this the prices may swing down and form a flag pattern.
When the demand is more than supply, price breaks outside the flag above the resistance, and prices continue to move upwards. In the case of the bearish flag pattern, an increase in demand stops the prices to fall.
Due to this the prices may swing up and form a flag pattern. When the supply is more than demand, price breaks outside the flag below the support, and prices continue to fall.
Example
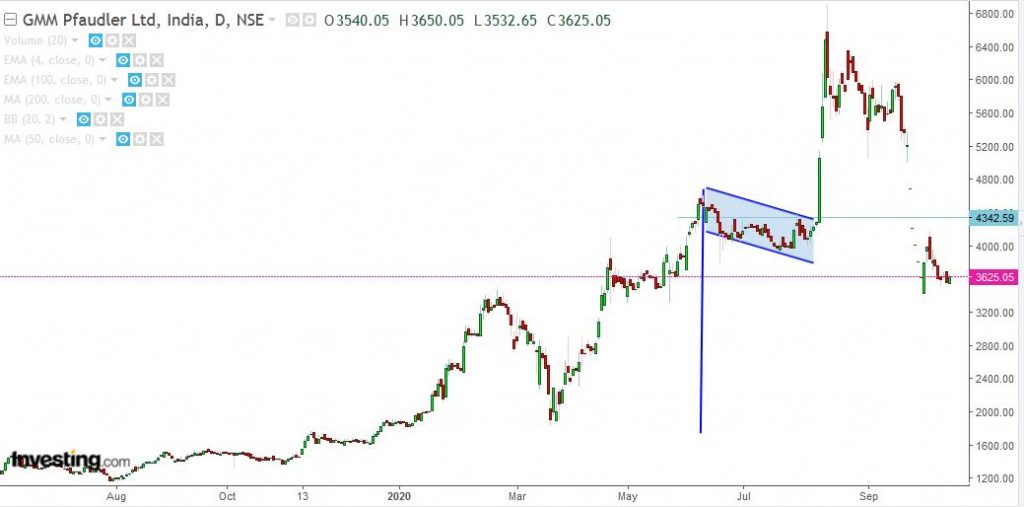
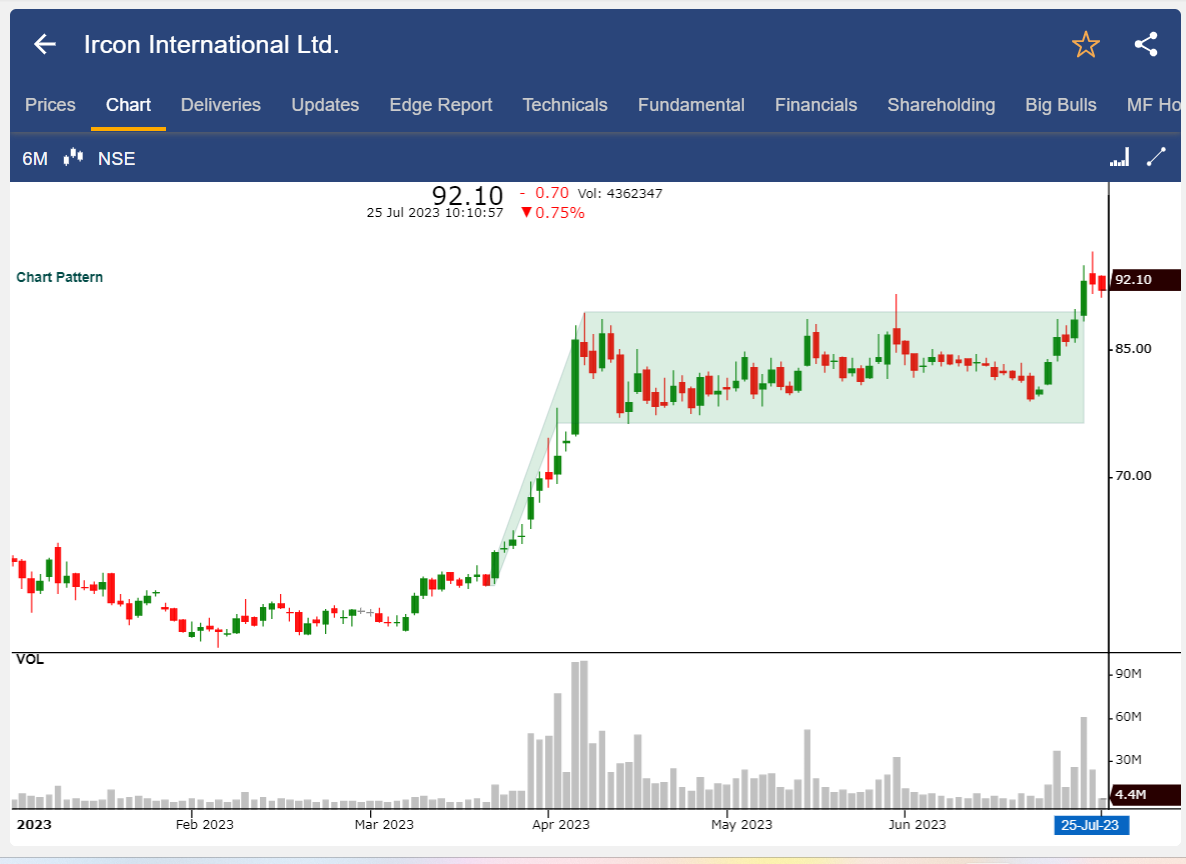
Here we can see the formation of a bullish pattern after a strong uptrend in the daily chart of GMM Pfaudler Ltd. We can see how the prices broke out above the upper trend line and prices continued to move upwards.
Price Target
The price target depends upon the distance between the parallel lines that create a flag.
Suppose the flag is 20 pips wide, then the target price will be adding 20 pips with the breakout price in case of a bullish pattern and subtracting 20 pips with the breakout price in case of a bearish pattern.
Stop Loss
A stop-loss can be placed outside the flag on the opposite side of the breakout.
How to filter Stocks using this Chart Pattern Screener?
There are so many stocks in which this chart pattern is formed and it is difficult for traders to look at the charts of more than 500 stocks for finding this pattern.
So, with the help of StockEdge, one can filter out stocks in which this chart pattern is formed:
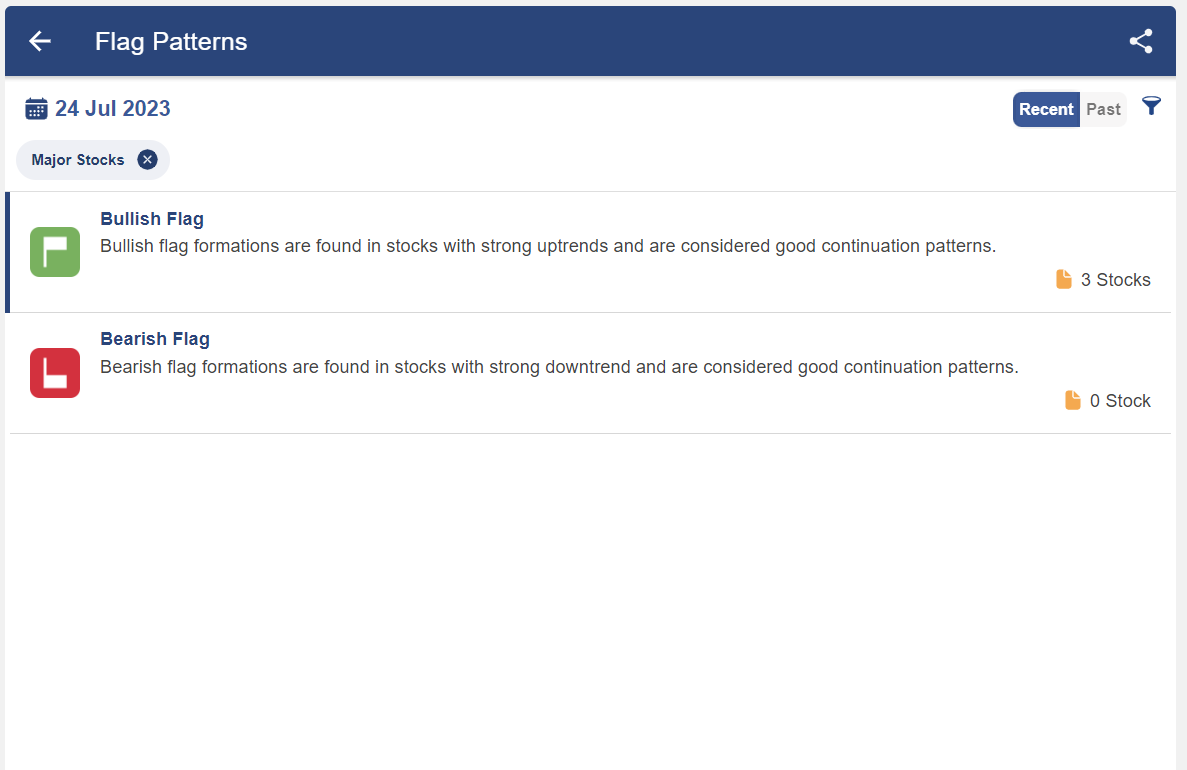
After clicking on the bullish flag, you will get a list of stocks in which this pattern is formed:
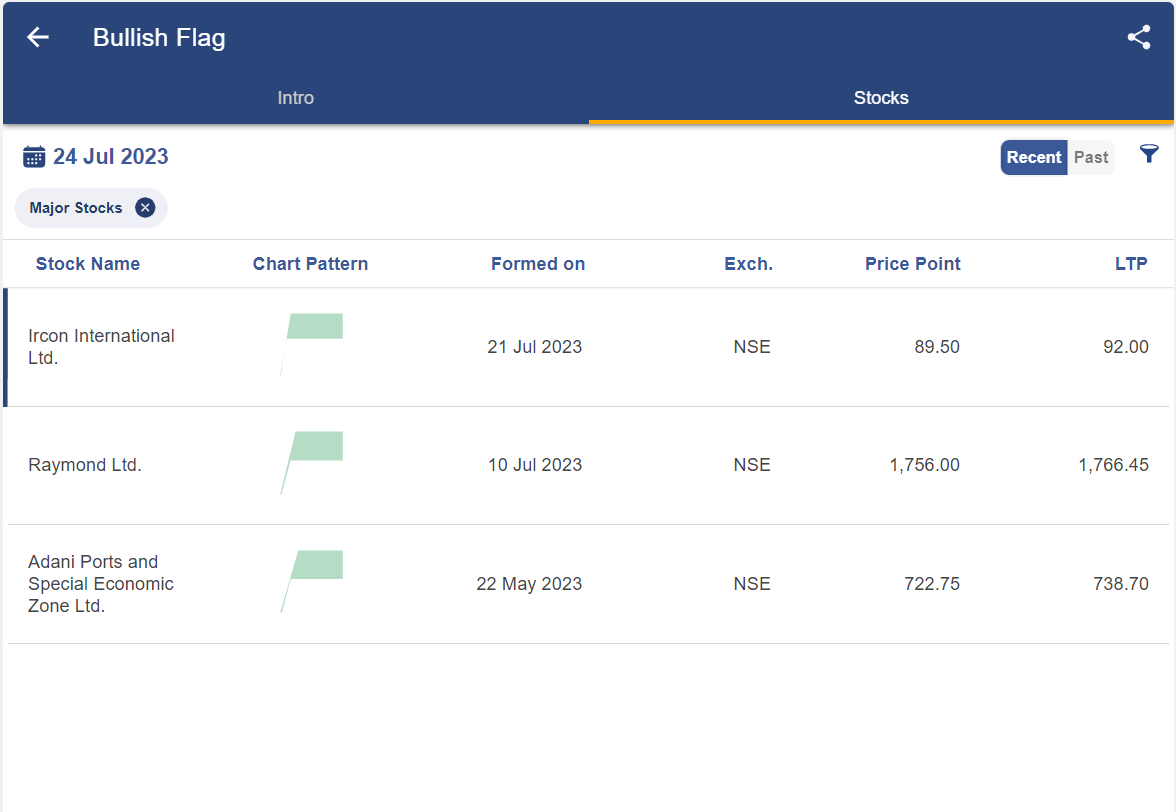
After clicking on any of the above stocks, you will get a technical chart showing the pattern as below:
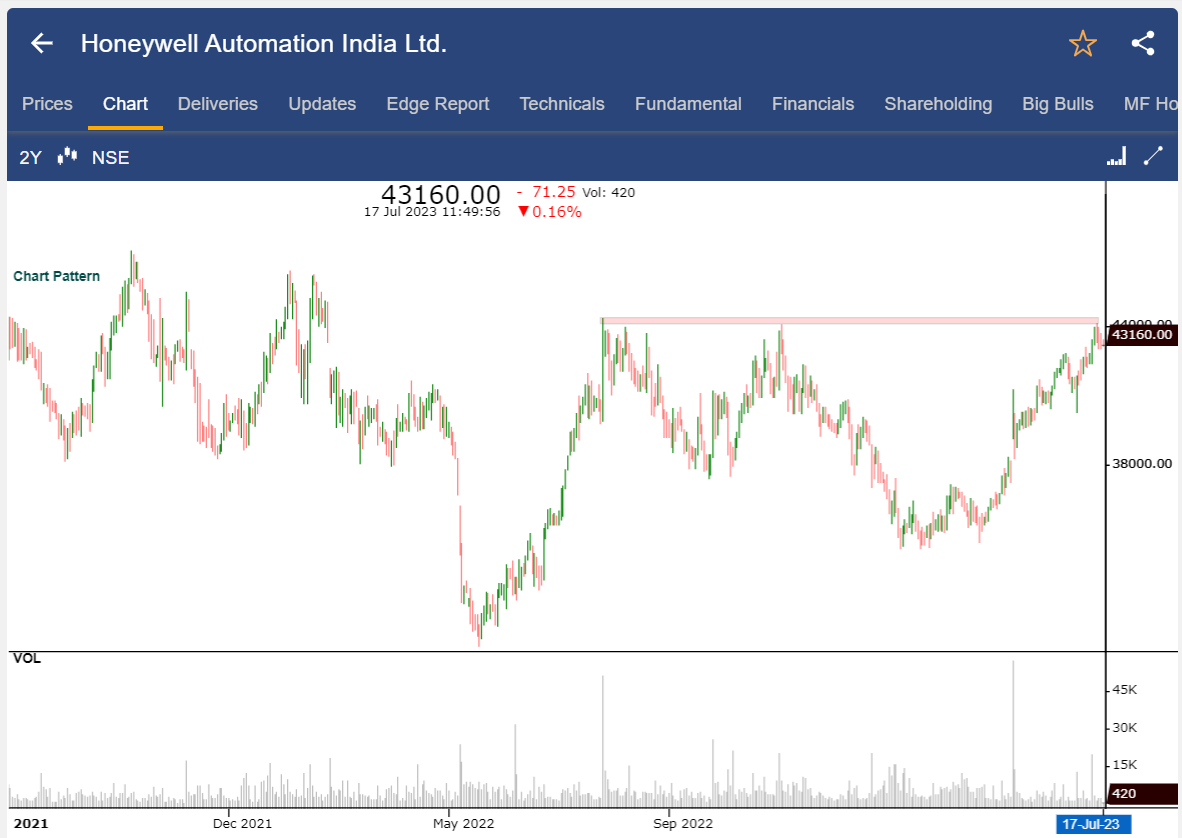
Once you have identified this chart pattern in the stocks, you can trade accordingly as discussed above.
Botttomline
A flag pattern is a type of chart continuation pattern that shows candlesticks contained in a small parallelogram. When the prices are in an uptrend a bullish pattern shows a slow consolidation lower after an aggressive uptrend. When the prices are in the downtrend a bearish pattern shows a slow consolidation higher after an aggressive downtrend. It is formed when there is an increase in the demand or supply that makes the prices to move up or down.
Frequently Asked Questions
How do you identify a flag pattern?
After a sharp price movement, either upward or downward when the prices enter in a consolidation phase then the flag pattern may be formed.
What is the difference between flag pattern and pennant?
The pennant pattern is identical to the flag pattern the only difference is that the consolidation phase of a pennant pattern is characterized by converging trend lines rather than parallel trend lines.
How can I differentiate flag pattern with trend reversal?
A flag pattern is a type of chart continuation pattern and it does not indicate trend reversal.
How reliable is the flag chart pattern for long-term investing?
Generally flag pattern is a short term pattern. For long term investing traders can look for other chart patterns like Inverted H&S and channel.
Do “bear flag” and “bull flag” patterns always happen in the stock market?
Yes “bear flag” and “bull flag” patterns usually happen in the stock market. One should look at an area of consolidation which shows a counter-trend move that follows after a sharp price movement.


