Elearnmarkets - Financial Market Learning
  • Categories
    • Basic Finance
    • Derivatives
    • Financial Planning
    • Fundamental Analysis
    • Technical Analysis
    • Marketshala
    • Miscellaneous
  • Language
    • English
    • Hindi
    • Bengali
No Result
View All Result
  • Courses
  • Webinars
  • Go To Site
  • Login
Elearnmarkets
  • Categories
    • Basic Finance
    • Derivatives
    • Financial Planning
    • Fundamental Analysis
    • Technical Analysis
    • Marketshala
    • Miscellaneous
  • Language
    • English
    • Hindi
    • Bengali
No Result
View All Result
Webinars
Elearnmarkets - Learn Stock Market, trading, investing for Free
No Result
View All Result
Home Technical Analysis Market Analysis
Jubilant Foodworks chart

Charts of the day – 15th March, 2018

Elearnmarkets by Elearnmarkets
February 26, 2020
in Market Analysis, Charts
Reading Time: 2 mins read
0
99
VIEWS
Share on FacebookShare on TwitterShare on WhatsApp

Jubilant Foodworks chart

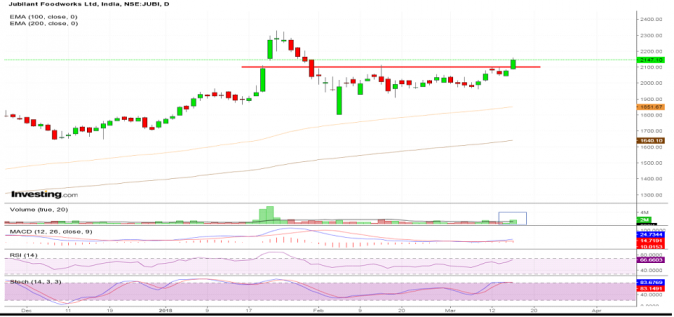
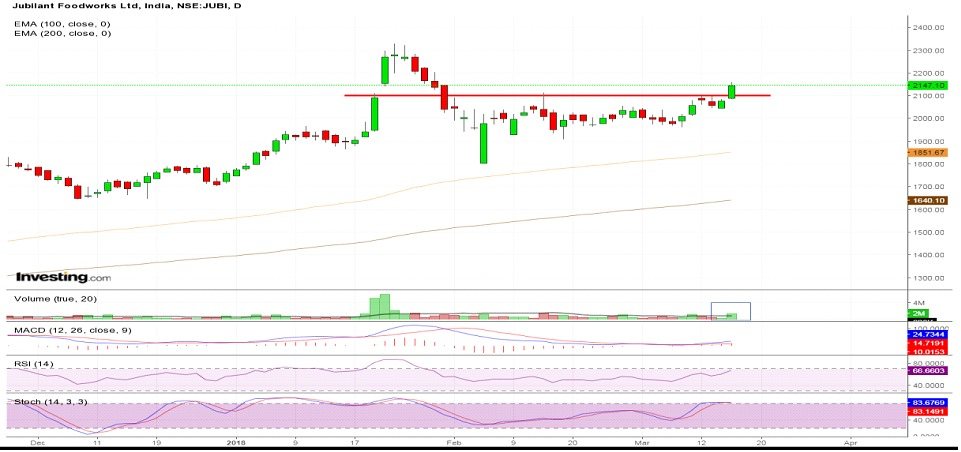
For the last one month Jubilant Foodworks was trading in a consolidated range. In today’s trading session the stock breached that zone. Approximately 2 Million shares were traded today which helped the volume indicator to cross its 20 Days MA line, in case of indicator: RSI has gone above its level 60 and showing that the stock has a support of strong momentum.

(Not a reco to buy/sell/ hold)

Pidilite chart

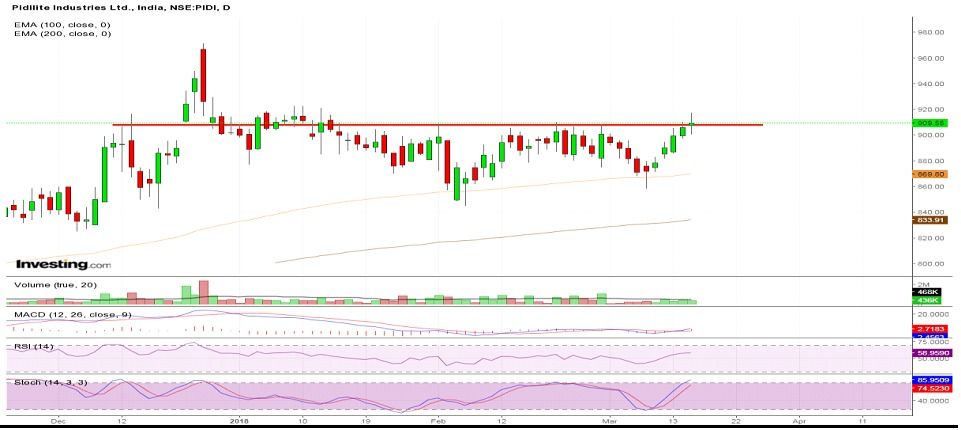
Pidilite was trading in consolidated zone(marked on the chart) for last one month. Today the stock breached that level but  was unable to close above it. In case of indicator: MACD is above its signal line, RSI is near 60 Level so the momentum is still intact for the stock and Stochastic has just entered into its overbought zone.

(Not a reco to buy/sell/ hold)

Shriram Transport

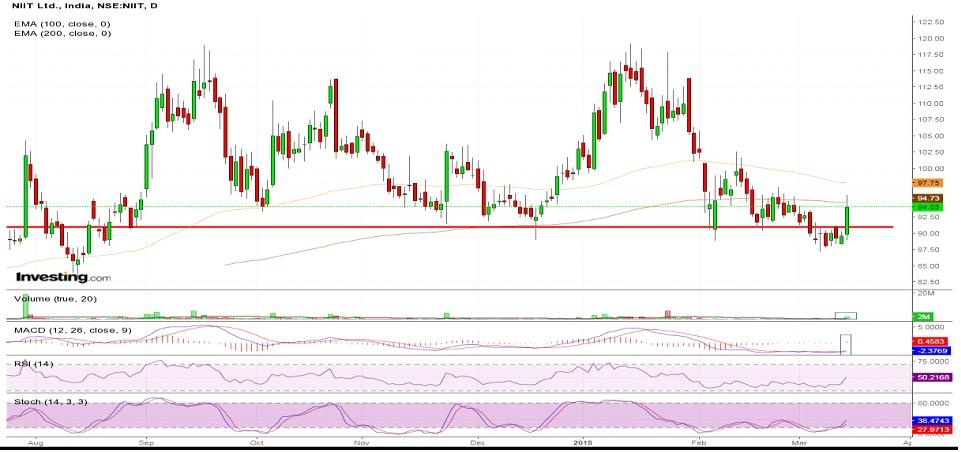
With the help of a long green candle NIIT Ltd comes out from its support level. Consecutively 6 days the stock closed below its support zone but today it gave a breakout. Volume also crossed its 20 Days MA line and MACD confirmed the positive crossover after today’s trading session. RSI is above its 50 mark and Stochastic has come out from its oversold Level.

(Not  a reco to buy/sell/ hold)

NIIT Ltd

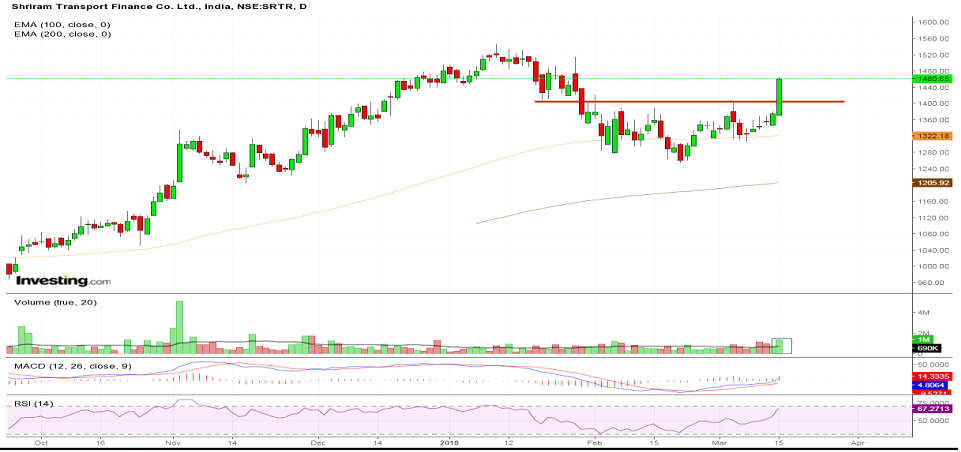
Volume helped Shriram Transport to give a close above the consolidation zone marked on the chart). MACD is above its level 0 and signal line is in a positive zone. Stock has the full support of momentum which is clearly visible from RSI because it is above its 60 level.

(Not a reco to buy/sell/ hold)

ShareTweetSend
Subscribe To Updates On Telegram Subscribe To Updates On Telegram Subscribe To Updates On Telegram
Previous Post

Charts of the day – 14th March, 2018

Next Post

Charts of the day – 16th March, 2018

Elearnmarkets

Elearnmarkets

Elearnmarkets (ELM) is a complete financial market portal where the market experts have taken the onus to spread financial education. ELM constantly experiments with new education methodologies and technologies to make financial education effective, affordable and accessible to all. You can connect with us on Twitter @elearnmarkets.

Related Posts

Hourly Chart
Market Analysis

Nifty Ends on Positive Note, Gains Approx. 475 Points on Positive Global Factors

November 18, 2020
373
Weekly Chart
Market Analysis

Huge Sell-Off Makes the Market Close in a Negative Note on the Expiry Week

November 18, 2020
172
Hourly Chart
Market Analysis

Nifty Ends in Green. Rupee Appreciates and Falling Crude Price Helped the Market to Recover Approx. 140 Point

November 18, 2020
126
Hourly Chart
Market Analysis

Sell Off Continues. Nifty Ends The Week With Three Consecutive Red Candles

November 18, 2020
137

Leave a Reply Cancel reply

Your email address will not be published. Required fields are marked *

Follow Us

Facebook-f Twitter Instagram Linkedin-in Youtube Telegram

Register on Elearnmarkets

Continue your financial learning by creating your own account on Elearnmarkets.com

Register Free Account

Download App

Categories

  • Basic Finance
  • Derivatives
  • Financial Planning
  • Fundamental Analysis
  • Technical Analysis
  • Marketshala
  • Miscellaneous

© 2022 Elearnmarkets . All Rights Reserved

  • Visit Elearnmarkets
  • Courses
  • Webinars
  • Financial Guides
  • Get Free Counselling

Get Elearnmarkets App

No Result
View All Result
  • Article Categories
    • Basic Finance
    • Derivatives
    • Financial Planning
    • Fundamental Analysis
    • Technical Analysis
    • Marketshala
    • Miscellaneous
  • Language
    • Hindi
    • Bengali
    • English
  • Courses
  • Webinars

© 2020 Elearnmarkets All Rights Reserved

Welcome Back!

Login to your account below

Forgotten Password?

Retrieve your password

Please enter your username or email address to reset your password.

Log In

Suggested Learning

Technical Analysis Made Easy

Certification in Online Technical Analysis

Online NSE Academy Certified Capital Market Professional (E-NCCMP)