
The Directional Movement Index (DMI) is a momentum indicator that was developed by J. Welles Wilder.
They are usually used in the combined form but some trading platforms separate the Directional Movement indicator from the Average Direction Index (ADX).
Directional Movement shows how dominant the price movements are, either downside or upside is dominant whereas the ADX shows the price movement strength.
In the blog we will discuss the basics of the Directional Movement Index and how to use this indicator in trading:
What is Directional Movement Index (DMI)?
The Directional Movement Index is a technical indicator that is usually shown below the price chart and compares the recent price with the previous price range.
The Directional Movement Index shows the result as an upward or positive directional indicator (+DI or +DMI) and a downward or negative directional indicator (-DI or -DMI).
The Directional Movement Index is used for calculating the upward or downward movement strength and shows the trend strength line known as the Average Directional Index or ADX.
+DI and -DI are two separate lines which are usually coloured green and red respectively. ADX is a third line on the DMI that shows the strength of the trend.
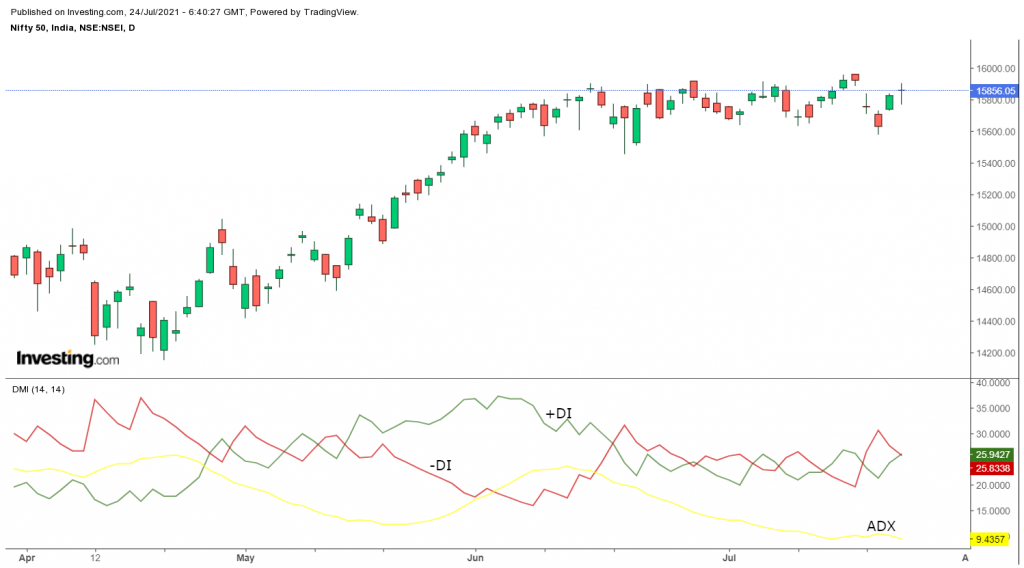
So, while the -DI and +DI shows direction, investors use ADX to analyse the strength of that uptrend or downtrend. An ADX with a reading above 25 shows that a strong trend is in place.
Whereas when the ADX falls below 20, it shows that the price is likely moving sideways.
Calculation of Directional Movement Index (DMI)
+DI is the difference between the highest price of the current day and the highest price of the day before, and -DI does the same calculation with the current and previous day’s lows.
The True Range is the greater of the current high – current low, the current high – previous close, or the current low – previous close.
After this one should smooth the 14-period averages of +DM, -DM, and the ATR.
Then we divide the smoothed +DM value by the smoothed average true range (ATR) value to get +DI. Multiply by 100.
Then divide the smoothed -DM value by the smoothed TR value to get -DI and Multiply by 100.
The average directional movement index (ADX) is a smoothed average of DX and is another indicator that is added to the DMI.
For calculating the ADX, one needs to continue to calculate DX values for at least 14 periods and smooth the results for getting ADX.
How to use Directional Movement Index in trading?
1. Using +DI and -DI:
When the +DI line is higher than the -DI line, then the market is said to be trending upwards, and traders can take a long trade.
Similarly, if -DI line is higher than +DI line, then a short trade can be taken and the market is said to be trending downwards as shown below:
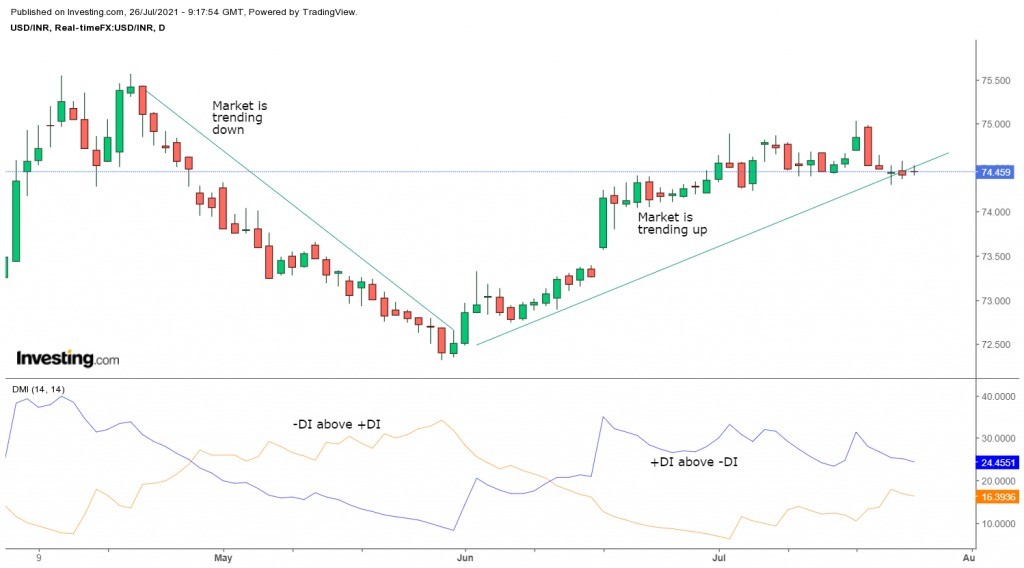
The DMI can be used to confirm the trend of the price signal. The trend is stronger if the spread between +DI and – DI is larger.
If +DI is far above -DI, it indicates a strong upward trend. If -DI is far above +DI, the price trend is strongly moving downwards.
2. Using ADX:
When the ADX line is over 25 then the market is said to be trending and ranging if the ADX line is under 25.
Sometimes many traders also consider the market is trending when ADX is above 20 ADX and non-trending for below 20.
An ADX reading above 25 signifies a strong trend whereas below ADX 25 signifies that there is no strong trend, and the price is moving sideways.
To trade trends the ADX reading should be over 25 or 20 and the ADX reading should be lower than 20 for trading a ranging strategy.
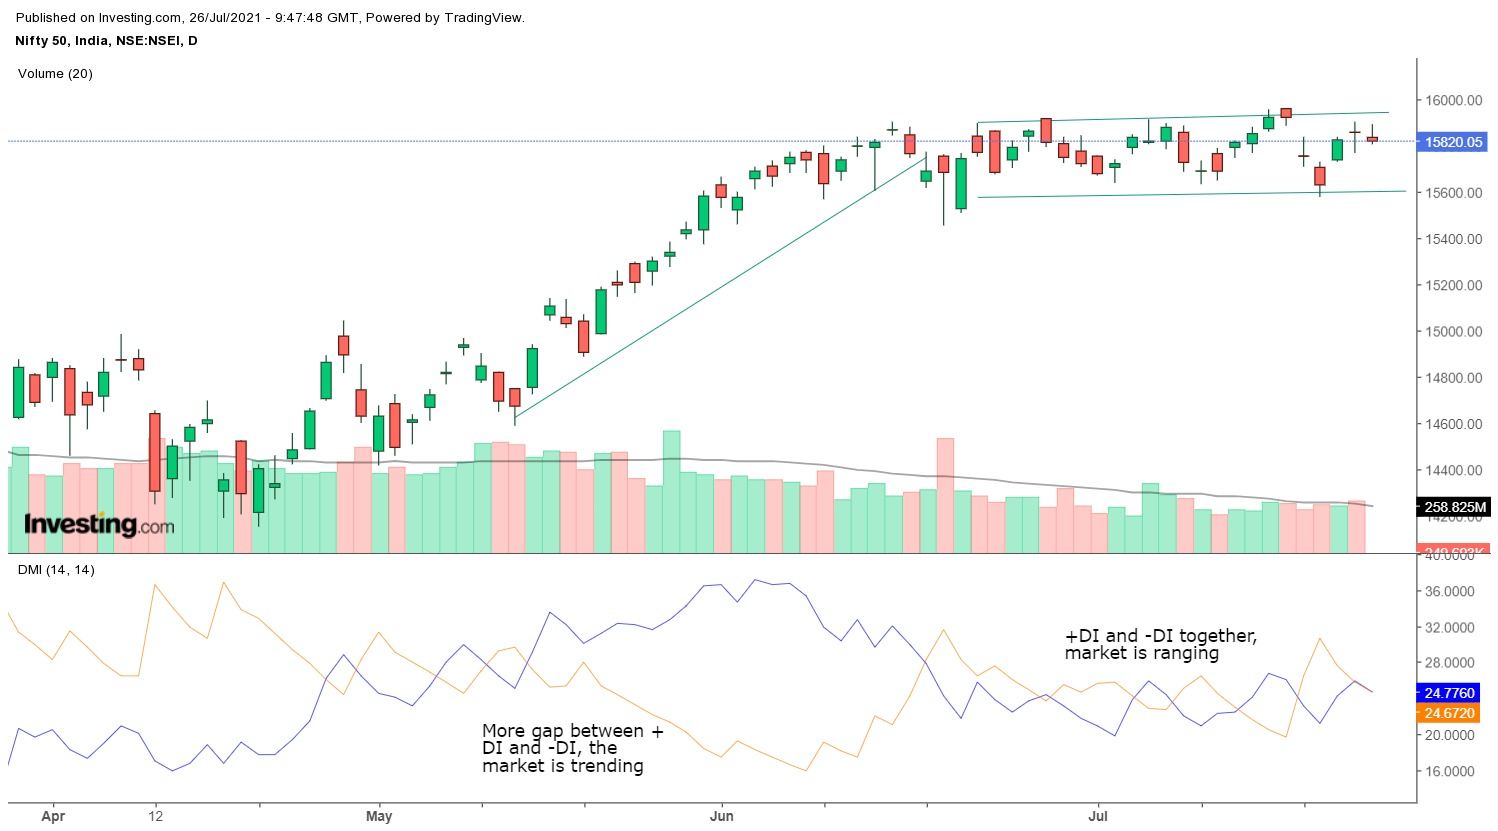
3. Using +DI, -DI, and ADX:
Traders can also collectively use +DI, -DI, and ADX as well as individually for trading purposes.
Some traders may only analyse ADX for analysing the strength of the trend, whereas some traders may analyse only the direction movement lines of the DMI for analysing the direction of price movement.
You can also watch our webinar on TRADING & INVESTING WITH ADX (AVERAGE DIRECTIONAL MOVEMENT INDEX)
Difference between the Directional Movement Index and the Aroon Indicator:
The DMI indicator is composed of two lines with an optional third line whereas the Aroon indicator also comprises two lines. Both the indicators show positive and negative movement that helps in identifying the trend direction.
Although the calculations are different and also the crossovers on each of the indicators occur at different times.
Limitations of Directional Movement Index:
Directional Movement Index produces a lot of false signals; thus, one should be careful while using this indicator.
The readings of +DI and -DI and crossovers depend on historical prices and they do not reflect what will happen in the future.
Thus, a crossover can occur that would result in a losing trade.
Also, the lines may crisscross which may give multiple signals but no trend in the price. This can be avoided by only taking trades in the larger trend direction that is based on long-term price charts.
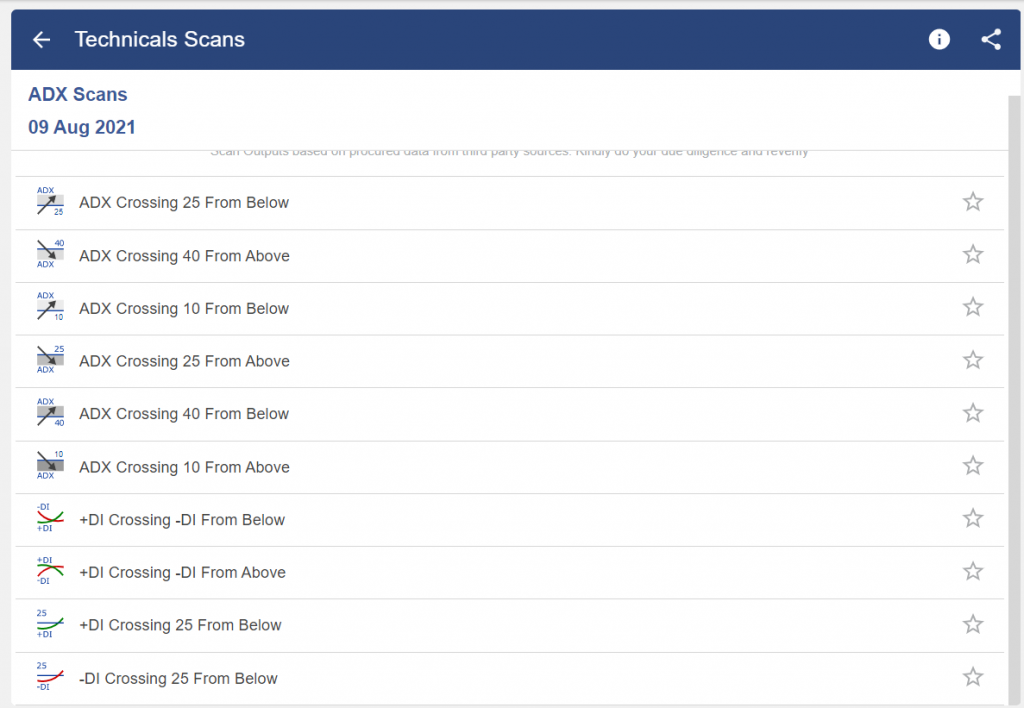
How to use Directional Movement Index in StockEdge?
There are multiples DMI and ADX scans available in StockEdge through which you can filter out stocks accordingly:
Bottom line:
As with the other technical indicators, the Directional Movement Index should also be used with other technical tools such as volume, price actions, candlestick patterns etc to confirm the signals given by this indicator.
Happy Investing!


Thanks sir
Hi,
We really appreciated that you liked our blog.
Keep Reading!
Very well elaborated, good content, hope to get more like this in future. 🙂
Hi,
We really appreciated that you liked our blog.
Keep Reading!