DuPont Analysis? What does it actually mean? Well, it is an extended examination of the Return on Equity (ROE) of a company that analyses Net Profit Margin, Asset Turnover, and Financial Leverage. This analysis was developed by the DuPont Corporation in the year 1920. DuPont analysis is a useful technique of breakin down the different return on equity (ROE) generators. The ROE decomposition helps investors for concentrating separately on key indicators of financial success to define strengths and weaknesses.
What is DuPont Analysis?
In simple words, it breaks down the ROE to analyze how corporate can increase the return for their shareholders.
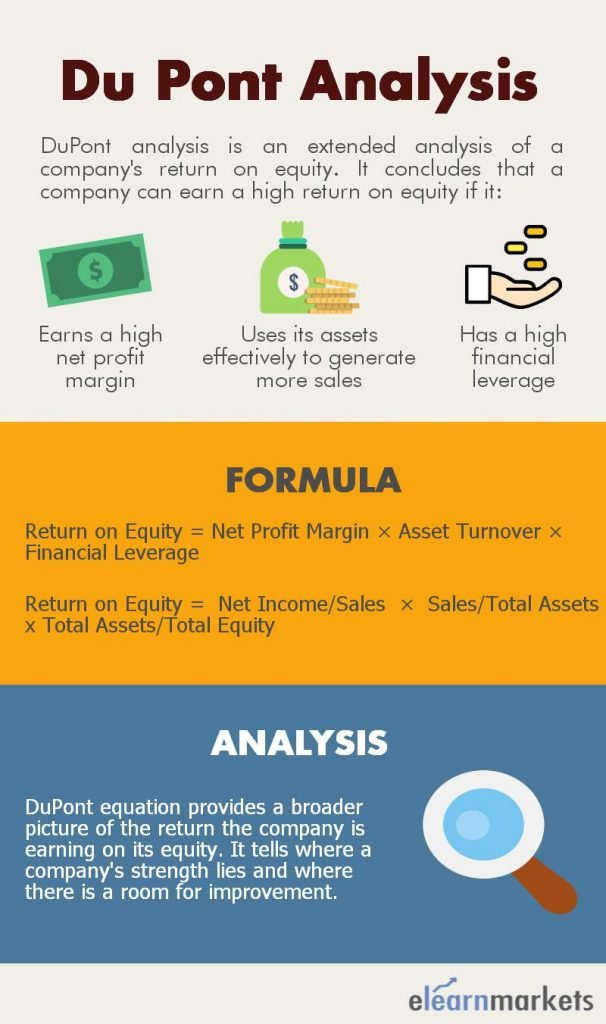
Return on Equity = Net Profit Margin * Asset Turnover Ratio * Financial Leverage = (Net Income / Sales) * (Sales / Total Assets) * (Total Assets / Total Equity)
The company can increase its Return on Equity if it-
1. Generates a high Net Profit Margin.
2. Effectively uses its assets so as to generate more sales
3. Has a high Financial Leverage
Components of DuPont Analysis
This analysis has 3 components to consider;
1. Profit Margin
This is a very basic profitability ratio. This is calculated by dividing the net profit by total revenues. This resembles the profit generated after deducting all the expenses. The primary factor remains to maintain healthy profit margins and derive ways to keep growing it by reducing expenses, increasing prices, etc, which impacts ROE.
For example; Company X has Annual net profits of Rs 1000 and an annual turnover of Rs 10000. Therefore the net profit margin is calculated as
Net Profit Margin= Net profit/ Total revenue= 1000/10000= 10%
2. Total Asset Turnover–
This ratio depicts the efficiency of the company is using its assets. This is calculated by dividing revenues by average assets. This ratio differs across industries but is useful in comparing firms in the same industry. If the company’s asset turnover increases, this positively impacts the ROE of the company.
For example; Company X has revenues of Rs 10000 and average assets of Rs 200. Hence the asset turnover is as follows
Asset Turnover= Revenues/Average Assets = 1000/200 = 5
3. Financial Leverage-
This refers to the debt used to finance the assets. The companies should strike a balance in the usage of debt. The debt should be used to finance the operations and growth of the company. However, usage of excess leverage to push up the ROE can turn out to be detrimental to the health of the company.
Learn to evaluate a company with Company Valuation Course by Market Experts
For example; Company X has average assets of Rs 1000 and equity of Rs 400. Hence the leverage of the company is as
Financial Leverage = Average Assets/ Average Equity= 1000/400 = 2.5
DuPont Analysis Interpretation
It gives a broader view of the Return on Equity of the company. It highlights the company’s strengths and pinpoints the area where there is a scope for improvement. Say if the shareholders are dissatisfied with the lower ROE, the company with the help of the DuPont Analysis formula can assess whether the lower ROE is due to low-profit margin, low asset turnover, or poor leverage.
Once the management of the company has found the weak area, it may take steps to correct it. The lower ROE may not always be a concern for the company as it may also happen due to normal business operations. For instance, the ROE may come down due to accelerated depreciation in the initial years.
The DuPont equation can be further decomposed to have an even deeper insight where the net profit margin is broken down into EBIT Margin, Tax Burden, and Interest Burden.
Return on Equity = EBIT Margin x Interest Burden x Tax Burden x Asset Turnover Ratio x Financial Leverage
ROE = (EBIT / Sales) x (EBT / EBIT) x (Net Income / EBT) x (Sales / Total Assets) x (Total Assets / Total Equity)
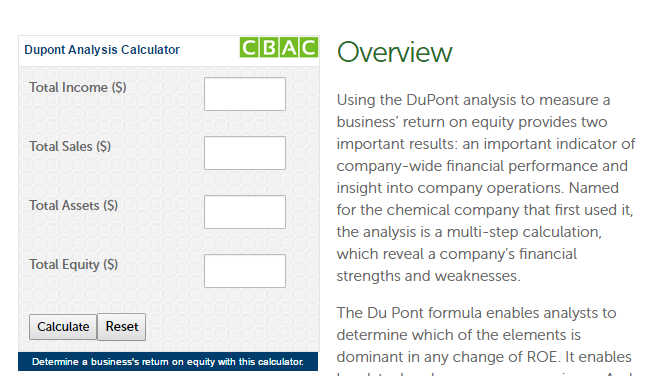
Dupont Analysis Calculator
You can also see a snapshot of DuPont Analysis Calculator below:
DuPont ROE Formula
There are a few changes in the calculation part when calculating ROE under the two approaches. Let us understand the difference in calculation. Basically, in this analysis, the three components discussed above are taken into account for calculation.
The simple ROE helps in understanding the return generated by the company on its equity. But the reasons behind that (whether good or bad) is understood by the DuPont analysis.
In simple ROE, we calculate
ROE = Net Income/ Total equity
But while calculating DuPont ROE, we include a few more factors and calculate it as follows,
DuPont ROE = (Net Income/ Sales) * (Net Sales/Total Assets) * (Total Assets/Total Equity)
Or
Profit Margin * Total Asset Turnover * Equity Multiplier
This helps in understanding which component is impacting ROE more.
Drawbacks
Although DuPont has many advantages as stated above, but everything has its own disadvantages also.
This analysis uses accounting data from the financial statement in its analysis which can be manipulated by the management to hide discrepancies.
It is only useful for comparison between the companies under the same industry.
3 Step and 5 step DuPont Analysis
The 3 steps have been discussed above, which is calculated as
ROE= (Net Income/ Sales) * (Net Sales/Total Assets) * (Total Assets/Total Equity)
OR
(Profit Margin * Total ) / (Asset Turnover * Equity Multiplier)
However, the 5 step DuPont analysis has two additional components;
ROE = (Net Income/ Pretax Income) * (Net Sales/Total Assets) * (Total
Assets/Total Equity) * (Pretax Income/ EBIT)* (EBIT/Sales)
= Tax Burden * Asset Turnover * Equity Multiplier * Interest Burden * Operating Margin.
Can DuPont analysis be applied on a zero debt company?
After learning a new concept of DuPont, we must be wondering that whether this analysis is also done on a debt-free company? Whether this analysis will have the same usefulness for a debt-free company or not?
DuPont Analysis is equally useful when analysing a debt-free company. The above formula remains the same, with just one exception- the financial leverage component is taken as 1 and the rest remains the same. Therefore the DuPont analysis can be performed on all kinds of companies
Frequently Asked Questions
Why is DuPont analysis important?
Its important to understand whether the company is generating profits through internal accruals or through Debt Financing or through raising Equity
What are the drawbacks of Dupont analysis?
If a company is debt free then one cant use Dupont Analysis to understand the profitability of the company
What is DuPont analysis used for?
It helps investors to understand the component which is helping the company drive profitability.
What are the benefits of using the DuPont analysis method?
No, as Dupont analysis involves a financing component thus a zero debt company cant be analyzed based on Dupont model
Bottomline
The Analysis is very important for an investor as it answers the question of what is actually causing the ROE to be what it is. If there is an increase in the Net Profit Margin without a change in the Financial Leverage, it shows that the company is able to increase its profitability. But if the company is able to increase its ROE only due to an increase in Financial Leverage, it’s risky since the company is able to increase its assets by taking debt.Thus we need to check whether the increase in the company’s ROE is due to an increase in Net Profit Margin or Asset Turnover Ratio (which is a good sign) or only due to Leverage (which is an alarming signal).
Keep Investing!


I am not clear on the interpretation of the term “equity”. Does it mean the actual equity of the company, or is it the Nett Worth of the company which would be the total of equity and retained earnings(officially called Net Worth) and would be seen as the total of ” Owned Funds”. Depending on which of these is the interpretation of the word Equity, the Dupont Analysis number would vary, being higher when the owned funds interpretation is used and obviously lower when the official equity is used. I would appreciate a clarification on this issue
Hello R.J,
Thank you for your comment.
In all calculations Equity means “Total Equity” which means Share Capital + Reserve & Surplus, also known as Total Net Worth of the company
You can read more fundamental analysis blog
Happy Reading!!
Hello there, if the question is given as,
If original ROI is 20%, then what would be the resultant ROI afterDupont analysis.?
Can anyone help me with dis?
Hello Vaishali,
Thank you for your comment.
This formula can be decoded to give you present du -pont analysis of a company.
Formula: Return on Equity= Net Profit Margin x Asset Turnover Ratio x Financial Leverage
= (Net Income / Sales) x (Sales / Total Assets) x (Total Assets / Total Equity)
To know more about Dupont Analysis and other fundamental analysis concepts in details you may join our course: Certification in Online Equity Research Analysis
Happy Learning!!
I do not even know how I ended up right here, but I thought this post was once great. I don’t recognise who you’re but certainly you’re going to a famous blogger in case you are not already 😉 Cheers!
Hi,
Thank You for reading!
Happy Reading!