Rising and Falling Window Candlestick Pattern- The support and resistance zones of window candlestick patterns are highly rigid. Therefore, a stiff resistance region is generated in the case of a Falling Window candlestick pattern, which gives a better probability of trade chances on consecutive re-tests of the resistance area.
Similarly, a stiff support region is generated in the case of a Rising Window candlestick pattern, which also gives a better probability of trade chances on consecutive re-tests of the support area.
So, in today’s blog, we will discuss How to use the Rising and Falling Window Candlestick Pattern in detail:
What is Rising Window Candlestick Pattern?
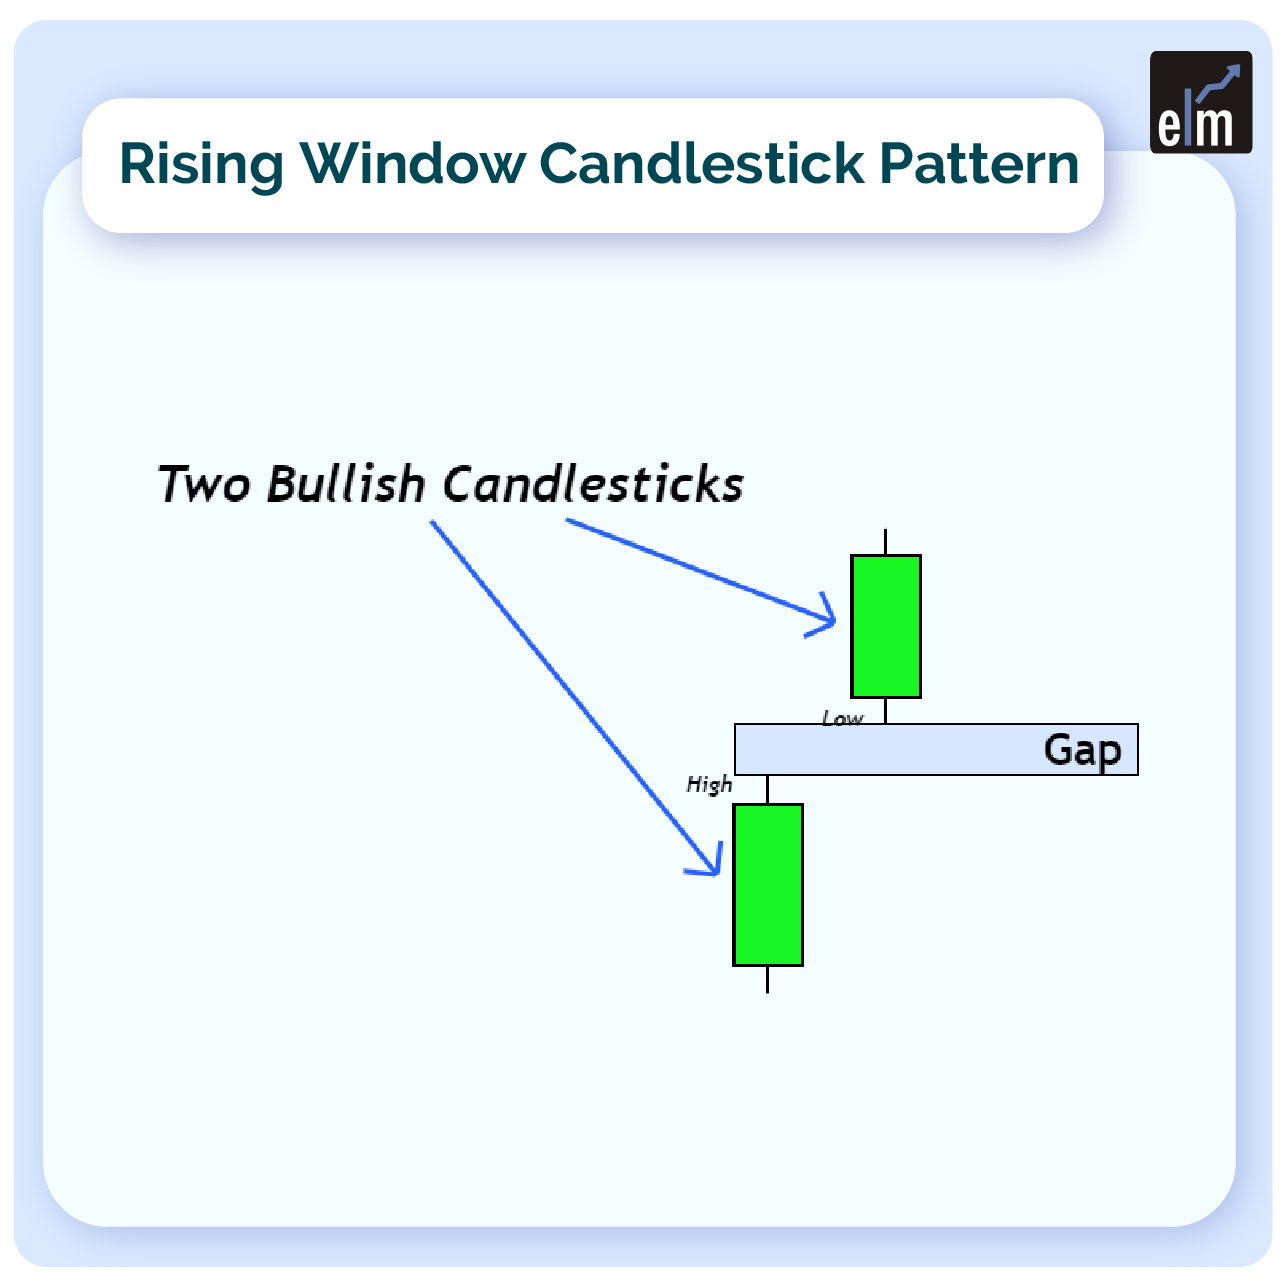
There must be space between the real bodies of two candles to form a Window (whether rising or falling); in fact, even their shadows should not overlap. During an uptrend, a Rising Window is a price gap that forms.
The space between the candles represents the distance between the high of the previous candle and the low of the current candle. This trend indicates that the bulls are in control, and we can expect them to keep pushing the price higher.
Examine the size of the gap to acquire a better understanding of the pattern’s message. For example, a high gap denotes a significant price increase, whereas a small gap denotes a modest (and unimportant) price change.
Formation
The Rising Window, also known as a “gap up,” appears when the price continually rises, and it is always regarded as a bullish signal. So don’t be startled if you see the Rising Window; it’s a common occurrence (though not as often on charts with longer time scales).
Because this continuation pattern is so simple and common, make sure you look at it carefully to understand what it’s trying to tell you. Small details can have a significant impact.
Trading with Rising Window Candlestick Pattern
The chart starts with an upward trend. At the commencement of the movement, the bulls construct a gap up (i.e., a Rising Window) to show their might. The uptrend continues for approximately half of the chart, with predominantly white candles increasing steeply.
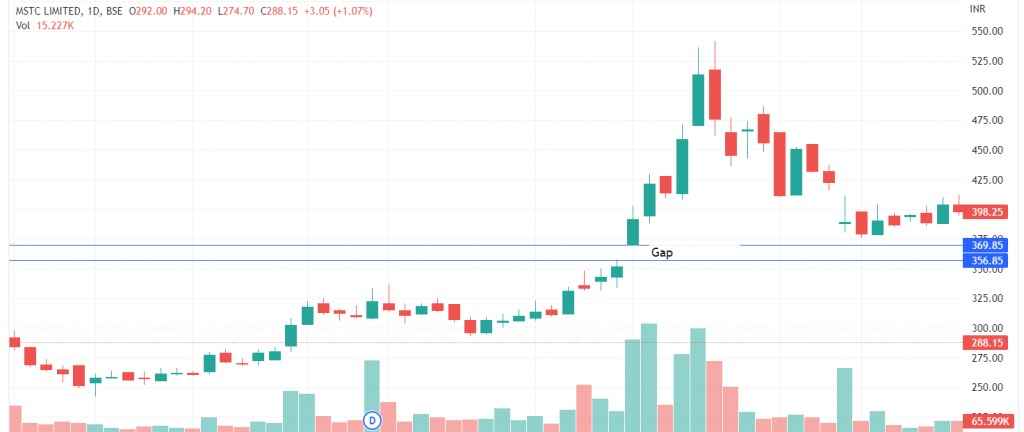
The bears are so strong when the trend ultimately reverses that they form a downward gap known as a Falling Window. This pattern shows a big swing in investor sentiment with both a gap up and a gap down.
What is Falling Window Candlestick Pattern?
A price gap in a downward trend is referred to as a Falling Window candlestick pattern. It must happen while the price trend is down, and it is always a bearish signal.
This continuation pattern is highly common on charts with shorter time scales, but it isn’t as common on longer time scales.
Because it is so common, it is critical that you pay attention to the peculiarities of each Falling Window. These details can help you figure out how important the signal is and whether you should pay attention to it.
Formation
When the two candles appear after the Falling Window, examine them. A Downside Tasuki Gap pattern, may have arisen if they do not close the window or fill the gap (this includes their shadows). The first and second candles must be bearish, but the third must be bullish in order to qualify.

After a significant downturn (as evidenced by the gap down), the bulls attempted to force the price back up. However, they were unsuccessful, and the decline is projected to continue.
Bottomline
The bears can produce a Falling Window candlestick pattern if they gain control. However, the bears, as expected, given the indication, fight on and maintain the downturn.
Read More- All 35 Candlestick Chart Patterns in the Stock Market
Frequently Asked Questions (FAQs)
What is falling window candlestick pattern?
A gap down between two consecutive candlesticks results in this pattern, which is a bearish continuation pattern. There is a “window” or space between the first and second candlesticks because the opening price of the second is lower than its closing price.
What is rising window candlestick pattern?
One Japanese candlestick motif is called the Rising Window. This pattern of continuance is bullish. It usually manifests as a rejection from lower prices and seems like a pause following an upward price trend. Because we anticipate a bull move following the Rising Window’s appearance at the proper time, the pattern is bullish.


