Elearnmarkets - Financial Market Learning
  • Categories
    • Basic Finance
    • Derivatives
    • Financial Planning
    • Fundamental Analysis
    • Technical Analysis
    • Marketshala
    • Miscellaneous
  • Language
    • English
    • Hindi
    • Bengali
No Result
View All Result
  • Courses
  • Webinars
  • Go To Site
  • Login
Elearnmarkets
  • Categories
    • Basic Finance
    • Derivatives
    • Financial Planning
    • Fundamental Analysis
    • Technical Analysis
    • Marketshala
    • Miscellaneous
  • Language
    • English
    • Hindi
    • Bengali
No Result
View All Result
Webinars
Elearnmarkets - Learn Stock Market, trading, investing for Free
No Result
View All Result
Home Technical Analysis Market Analysis Charts
Candle Stick Pattern

HCLTECH heads higher with the ‘ Three White Soldiers ’ and RSI

Elearnmarkets by Elearnmarkets
June 13, 2022
in Charts, Market Analysis
Reading Time: 2 mins read
0
525
VIEWS
Share on FacebookShare on TwitterShare on WhatsApp

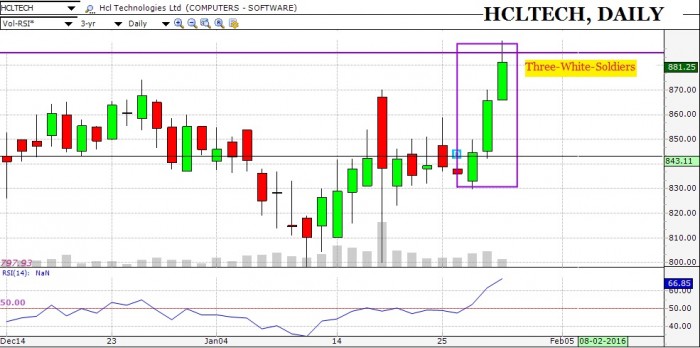
After consolidating for 4 months (Oct ’15-Jan ’16) in the range of  810-880, HCL TECHNOLOGIES (HCLTECH)  has developed a Japanese Candle Stick Pattern called the Three White Soldiers.

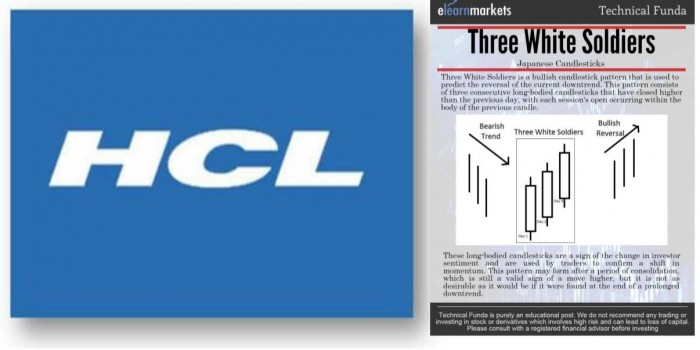
Also Read: All you need to know about the Japanese Candlestick

The Three White Soldiers is a bullish pattern which forms after a strong downtrend or a prolonged consolidation. The appearance of this pattern, suggests that participation in the stock is increasing in a sustained manner, leading to a rise in price.
HCLTECH
Now, if we look at the chart below, and correspondingly study the momentum indicator: RSI (Relative Strength Index), we see that a very interesting phenomenon has surfaced.

Also Read: RSI Indicator and How is it useful in Trading Stocks?

Earlier, within the consolidation, we saw that the price was resisting at the level of 880 whereas RSI turned down from the 50 level. But, this time, though the price is still near the level of 880, RSI has already broken above the 50 level and crossed over the previous highs. Adding on to this, currently, RSI is marking the 64 level, which is the ‘bull trend’-range.


HCLTECH


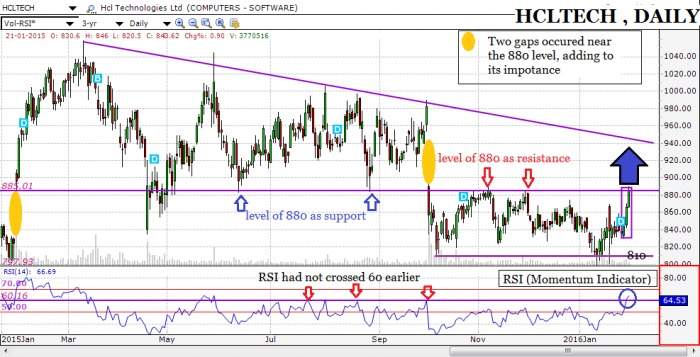
Therefore,  from the combined study of the candlestick chart of HCLTECH and the momentum indicator RSI, we can conclude that there has been an evident shift in the sentiments and the level of 880 is the resistance which the stock needs to overcome to really prove the usefulness of the candlestick pattern – Three White Soldiers, and the RSI ‘Range Break’.

If you want to learn the art and science of trading with the help of extensive technical analysis of stocks, the analysis of financial charts, trading strategies and more: you can enrol for NSE Academy Certified Technical Analysis on Elearnmarkets.com


Tags: englishhcltechrsithree-white-soldiers
ShareTweetSend
Subscribe To Updates On Telegram Subscribe To Updates On Telegram Subscribe To Updates On Telegram
Previous Post

Difference Between NEFT and RTGS

Next Post

MARKET WRAP 1ST FEB, 16: Bank Nifty Under-performed today!

Elearnmarkets

Elearnmarkets

Elearnmarkets (ELM) is a complete financial market portal where the market experts have taken the onus to spread financial education. ELM constantly experiments with new education methodologies and technologies to make financial education effective, affordable and accessible to all. You can connect with us on Twitter @elearnmarkets.

Related Posts

Hourly Chart
Market Analysis

Nifty Ends on Positive Note, Gains Approx. 475 Points on Positive Global Factors

November 18, 2020
360
Weekly Chart
Market Analysis

Huge Sell-Off Makes the Market Close in a Negative Note on the Expiry Week

November 18, 2020
157
Hourly Chart
Market Analysis

Nifty Ends in Green. Rupee Appreciates and Falling Crude Price Helped the Market to Recover Approx. 140 Point

November 18, 2020
121
Hourly Chart
Market Analysis

Sell Off Continues. Nifty Ends The Week With Three Consecutive Red Candles

November 18, 2020
129

Leave a Reply Cancel reply

Your email address will not be published. Required fields are marked *

Follow Us

Facebook-f Twitter Instagram Linkedin-in Youtube Telegram

Download App

Register on Elearnmarkets

Continue your financial learning by creating your own account on Elearnmarkets.com

Register Free Account

Get Articles On Email

Enter your email address:

Categories

  • Basic Finance
  • Derivatives
  • Financial Planning
  • Fundamental Analysis
  • Technical Analysis
  • Marketshala
  • Miscellaneous

© 2022 Elearnmarkets . All Rights Reserved

  • Visit Elearnmarkets
  • Courses
  • Webinars
  • Financial Guides
  • Get Free Counselling

Get Elearnmarkets App

No Result
View All Result
  • Article Categories
    • Basic Finance
    • Derivatives
    • Financial Planning
    • Fundamental Analysis
    • Technical Analysis
    • Marketshala
    • Miscellaneous
  • Language
    • Hindi
    • Bengali
    • English
  • Courses
  • Webinars

© 2020 Elearnmarkets All Rights Reserved

Welcome Back!

Login to your account below

Forgotten Password?

Retrieve your password

Please enter your username or email address to reset your password.

Log In

Suggested Learning

Technical Analysis Made Easy

Certification in Online Technical Analysis

Online NSE Academy Certified Capital Market Professional (E-NCCMP)

ELM School

LOVING OUR BLOGS?

Explore more content for free at ELM School.

Start reading & learning from various text-based modules covering all aspects of finance from today!

VISIT ELM SCHOOL