Heikin Ashi is a form of charting tool developed by Munehisa Homma in Japan in the 1700s. These candlesticks are an offshoot of Japanese candlesticks.
These are visually appealing balanced candle so that you can easily filter the price of the present move of the overall trend and provides a clearer visual representation of the trend.
Heikin Ashi Candlesticks are different from normal candlesticks. Various bullish or bearish reversal patterns consisting of 1-3 candlesticks are not found here. Rather, these candlesticks can be used to identify potential reversal points, trending periods and classic technical analysis patterns.
| Table of Contents |
|---|
| How Does it look? |
| How Heikin Ashi charts are different from Candlestick charts? |
| Similarity between Heikin Ashi and Candlestick charts |
| How to Interpret Heikin Ashi? |
| Bottomline |
How Does It look?
Heikin Ashi price bars are average bars and it does not reflect exact open, highs, lows and closes for that period like a normal candlestick. These are calculated using the following formulas:
HA Close = (Open + High + Low + Close) / 4
HA High = Maximum of High, Open, or Close
HA Low = Minimum of Low, Open, or Close
HA Open = (Open of previous bar + Close of previous bar) / 2
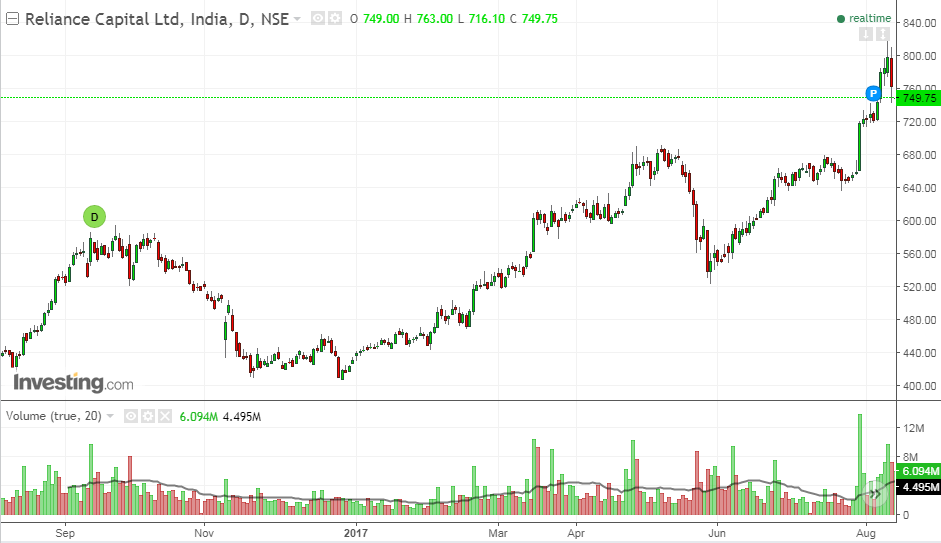
The image below is the daily chart of Reliance Capital candlestick and you can find lot of noise in between the good uptrend or downtrend.
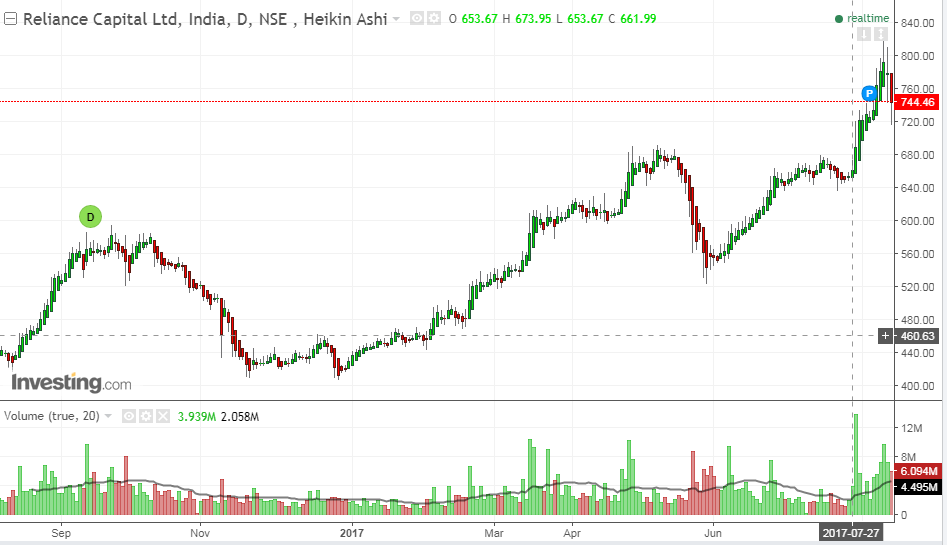
The next image is the chart of Reliance Capital and you can see that it is a smoothed data now and the noise in the previous chart is filtered out here.
Learn to determine Trend Following with Heikin Ashi Candlesticks in 2 hours by Market Experts
How Heikin Ashi charts are different from Candlestick charts?
You can find several noticeable differences immediately on the Heikin Ashi below relative to the candlestick chart above.
Some of the differences between chart and candlestick pattern are stated below:
- These charts are filtered from noise and smoother, thus making the short-term trend easier to observe.
- Many traditional candlestick chart patterns are even not suitable on heikin ashi patterns due to the averaging.
- They are average bars, doesn’t reflect the most recent price
- You will not find any gaps on the these charts since the current price bar make use of the prior price bar in its calculation.
Similarity between Heikin Ashi and Candlestick charts
Some of the similarities between both the chart patterns are as follows:
- Both are visually appealing
- Some patterns like Doji candlestick which states indecision in price, are still relevant in these charts as well
- Some of the traditional chart pattern like triangles and head and shoulders pattern, are tradable on both types the charts.
How to Interpret Heikin Ashi?
These charts help traders view trends and identify potential reversals. Thus Heikin-Ashi charts are mostly applicable to trend following traders.
The Heikin Ashi candles are totally different in appearance when a strong trending move is underway relative to pullbacks. Upward trending moves typically have long upward candles with very little or no lower shadows.
The shadows are the thin lines that extend out from either side of the fat part of the candle called the real body. These shadows represent the maximums and minimums of the Low, Open, Close and High .When a strong uptrend is underway, and the buying is aggressive, the lower shadows (sticking out the bottom of the real bodies) will typically disappear.
During pullbacks or weak trending moves there are interspersed down (red) bars, as well as lots of bars with lower shadows. This doesn’t necessarily indicate a reversal, but it does mean the trend is in a corrective phase or slowing.
The same concepts apply to downtrends, except strong down trending moves will be composed of Heikin Ashi price bars with little or no upper shadows. The bars will also typically be long and moving lower.
If there are up bars interspersed, or lots of bars with upper shadows, the trend is either very weak or the price is in a corrective phase.
Typically during strong trending moves we see strong up bars with no lower shadows for an uptrend, and strong down bars with no upper shadows for a downtrend.
Just because one up candle, or a couple of candles with upper shadows, appear during a downtrend doesn’t mean the trend is reversing – it may just be pausing. The same is true for uptrends.
Bottom Line
These charts appeal to traders since trends are easier to find and the way the bars are calculated creates a smoother appearance. Long up bars with no lower shadows, or long down bars with no upper shadows signify strong up and down trends respectively. Traditional forms of technical analysis and chart patterns can still be used and traded with Heikin Ashi.
Due to averaging, these charts will not show the current price on the y-axis. Also, many traditional candlesticks patterns will lose relevance due to the smoothing.


I am sure this post has touched all the internet people, its really really fastidious post on building up new website.|