The Force Index measures the strength of the price move based on three important parameters which include volume, direction, and extent.
It was invented by Alexander Elder and this oscillator actually fluctuates around the zero line.
When the indicator goes from positive to negative, the uptrend possibly comes to an end and it marks the starting of the downtrend.
Similarly, when the indicator goes from negative to positive, it signals the beginning of an uptrend.
Table of Contents |
|---|
Calculation |
How is Forex Index helpful to traders? |
Trend Identification/Confirmation |
Identifying Corrections |
Divergence |
Bottomline |
Forex Index Calculation
It is calculated as the difference between the current and the previous closing price multiplied by current trading volume.
The default period is taken as 13 period and the 13-period FI is computed by taking 13 period EMA of above calculated elder Index.
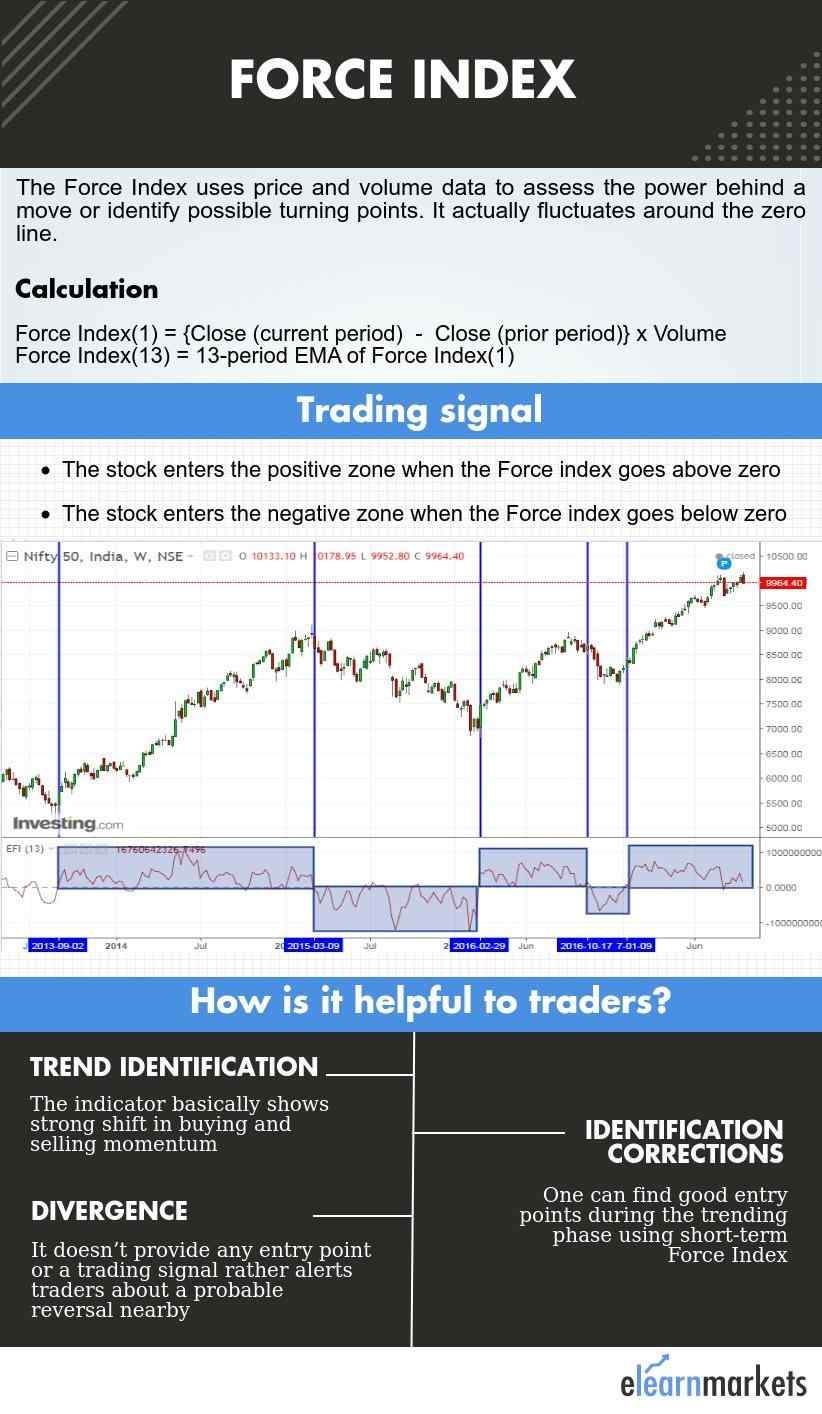
Force Index(1) = {Close (current period) – Close (prior period)} x Volume
Force Index(13) = 13-period EMA of Force Index(1)
How is Forex Index helpful to traders?
It primarily has three main uses which includes identifying corrections within the trend, trend confirmation and locating divergences.
Know More: Triple screen trading system: the Alexander Elder way of trading
Let’s understand each of these uses in detail-
Trend Identification/Confirmation
The indicator basically shows a strong shift in buying and selling momentum.
The traders want to be on the sidelines when this index clings close to the zero line as it indicates weak momentum.
When the Force index stays above the zero line, it signals an uptrend.
When it goes above the zero line forcefully, it shows strong buying pressure.
Similarly, when the Force index stays below the zero line, it signals a downtrend. When it goes below the zero line forcefully, it shows strong selling pressure.

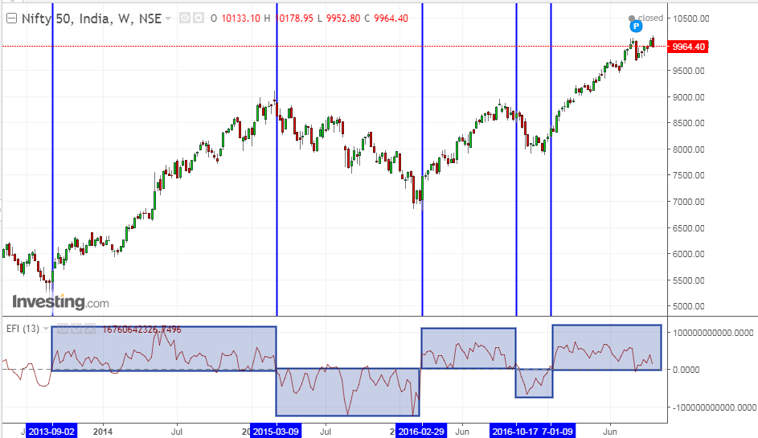
The above is the weekly chart of Nifty 50.
It is clearly evident that whenever the Force index is above the zero line, Nifty has been in a positive territory and has given a good up move.
Similarly, when the Force index is below the zero line, Nifty has given a good correction.
The farther the Force Index line away from the zero line, stronger is the trend.
Identifying Corrections
With the help of trend confirmation or identification and short term Force Index (say 2-period), one can find good entry points during the trending phase.
This is actually a very active strategy but if you want to decrease the number of trading signals, you may increase the time period on it.
During an uptrend, when the 2-period Force index goes below the zero line and then rallies back above zero, a buy signal is generated.
Similarly, during a downtrend, when the 2-period Force index goes above the zero line and then rallies back below zero, a sell signal is generated.

Divergence
Divergence takes place when both the price and the indicator are not moving in the same direction. Suppose the price is making higher high but the indicator is making a lower high and vice versa.
Also read: Dow Theory explained
Divergence basically shows weakness in the existing trend and signals either the magnitude of price or the volume is weakening.
It doesn’t provide any entry point or a trading signal rather alerts traders about a probable reversal in the coming period. However, a reversal could take a long time to happen or it may not come at all.
The traders who are unable to devote much time in analysing charts of various securities may benefit from scan section in StockEdge mobile app. It is also available on web in three different languages.
You can know more about StockEdge by watching the video below:
Bottomline
The force Index is a versatile indicator which actually combines both price action as well as volume to quantify a valuable metric.
It should be used in conjunction with price patterns and other indicators in order to filter out the divergence and also to trade the divergence in a better way.


You guys are doing great job. Thank you so much.
Thanks Shekhar for your valuable feedback.
Thanks a lot. This is great content. I might share some for you guys too. Great work poster!
Great post. I was checking continuously this blog and I am impressed! Very useful information specially the last part 🙂 I care for such info much. I was looking for this certain information for a long time. Thank you and best of luck.