Nifty (Weekly close approx. 10195.15): The downward journey in Nifty continued and it fell more than 1.5% on the last trading session. Last week has been quite volatile based on political reasons which led Nifty to close below 34 Week Moving Average (presently at approx. 10273.1).
In the hourly chart, Nifty has been trading below all short term moving averages and is constantly coming down hugging the lower band of the Bollinger suggesting weakness in the Hourly chart. Moreover, the hourly RSI, Stochastic and CCI are in the lower bound of their respective ranges while ADX is strongly heading upwards suggesting that the weakness may continue in the coming days and there is no signal of any reversal in the Hourly chart. The probable resistance comes at 5 Hour moving average (presently at approx. 10235) and 5 Hour HEMA (presently at approx. 10261)
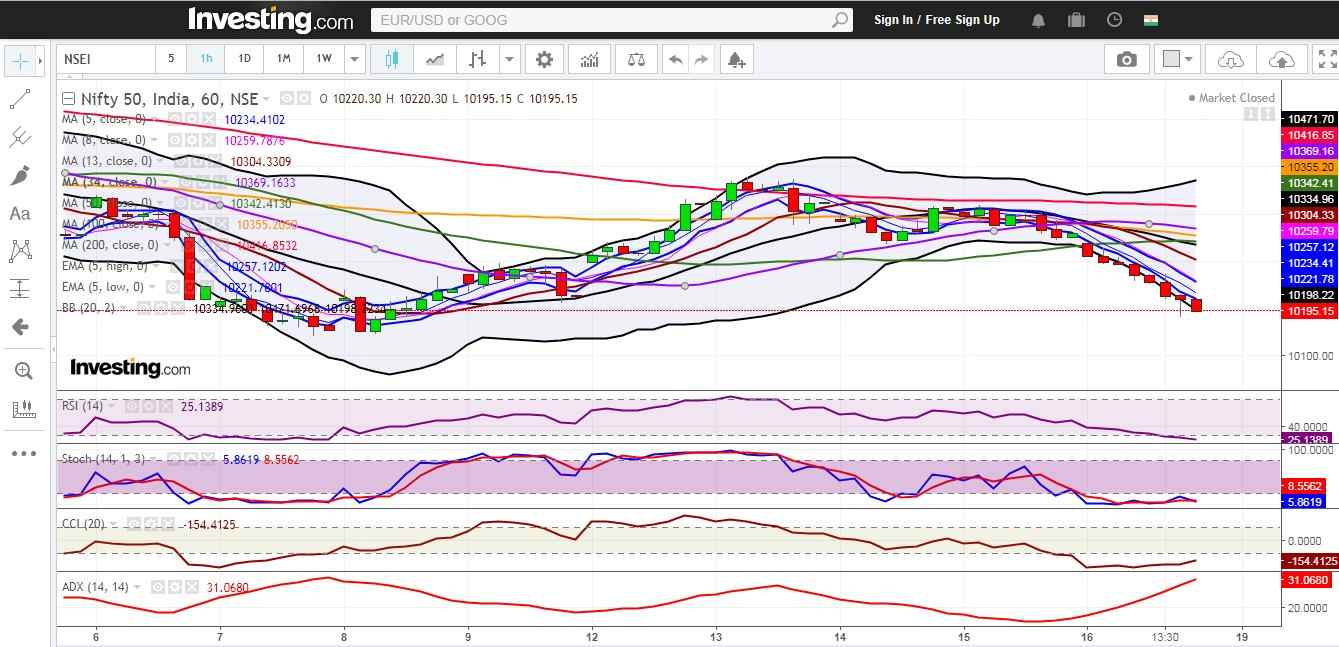
Hourly Chart
The daily CCI is in the oversold zone while daily RSI and Stochastic are very close to the lower bound of their respective levels. The candle on the last Friday has been very bearish and is presently standing close to very crucial 200 DMA (presently at approx. 10161.3) which is an important level to watch out for in the coming days. The break below 200 DMA may take Nifty to further downside. The probable support in the daily chart comes at 200 DMA (presently at approx. 10161) and lower Bollinger line (presently at approx. 10152). The probable resistance comes at 5 Day Low EMA (presently at approx. 10274) and 8 DMA (presently at approx. 10305).
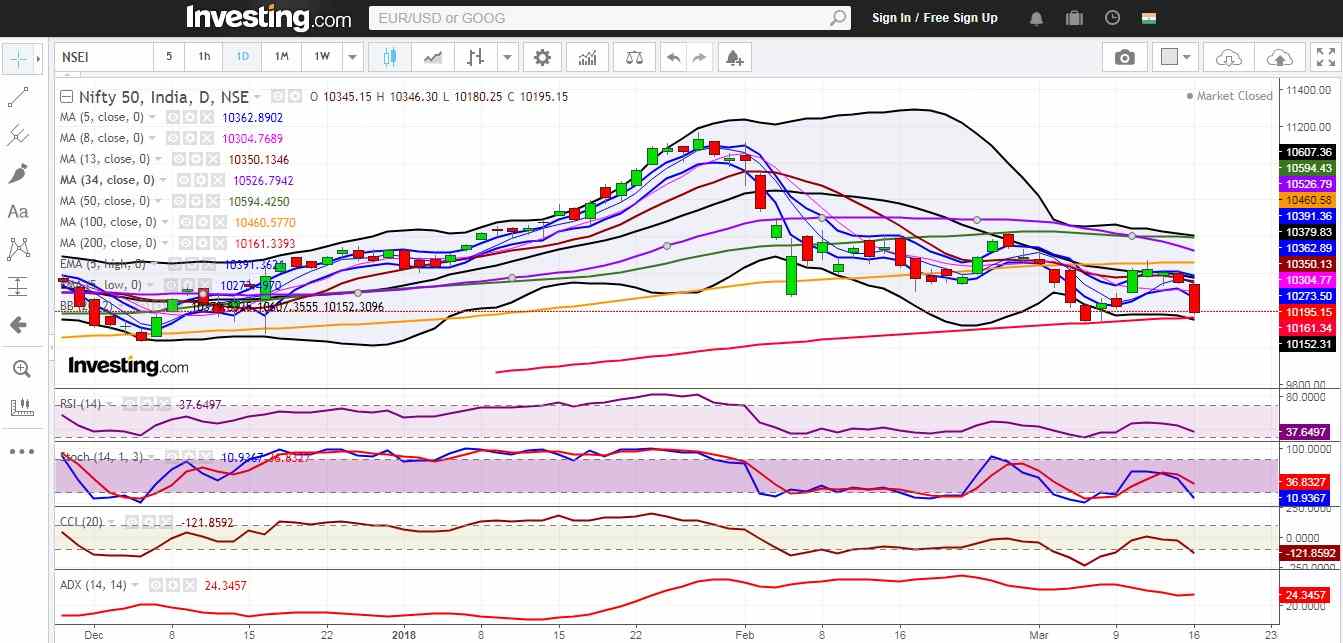
Daily Chart
In the weekly chart, Nifty has continued to give close below 5 Week Low EMA (presently at approx. 10285.8) and 34 EMA (presently at approx. 10273.1) which suggests weakness even in the weekly time frame. The probable support in the weekly chart comes at 50 week moving average (presently at approx. 10024.8) and probable resistance in the weekly chart is at 20 week moving average (presently at approx. 10471.7).
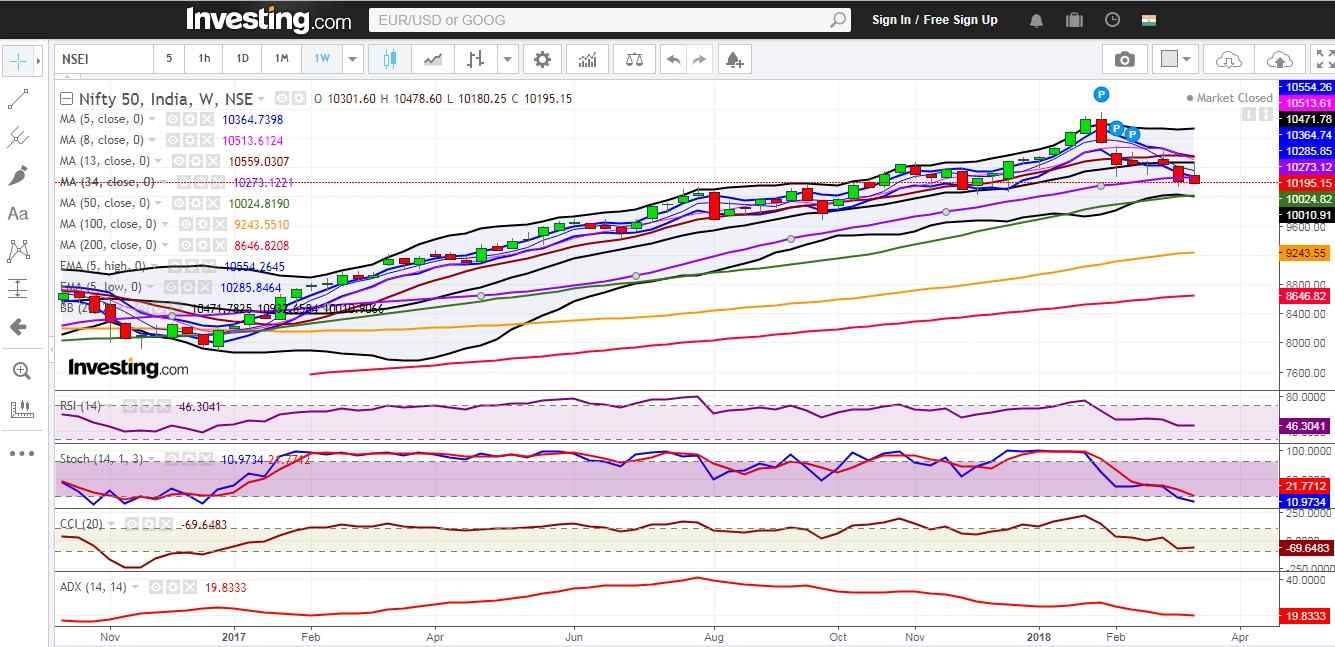
Weekly Chart
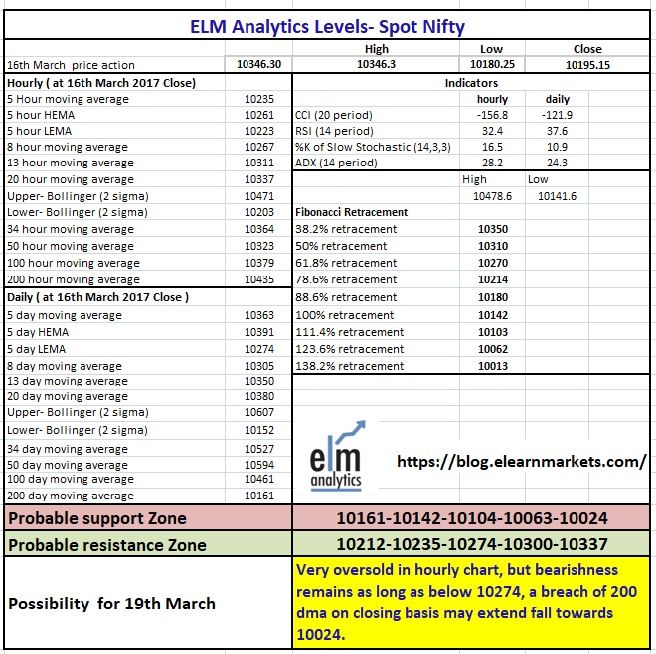
ELM Nifty level Matrix 19th March


