Nifty closed 25 points lower than yesterday, it also breached the 8200 level, which is considered very important. The RSI as we can see has stayed at the level of 60 and turned lower, and is not heading anywhere higher. This indicates weakness . However the weakness is definitely temporaary , as because in the recent new highs, RSI crossed above the level of 70 which is considered bullish and positive investor sentiments. The temporary correction may extend till the support of 8050-8100. There is imminent weakness on the short term in the chart of Nifty, however the trend remains up and long term investors have little to worry about.
On the intraday 15 mins chart of Nifty , there is a channel formation. Nifty opened exactly at the upper trendline of this channel, and touched the lower trendline during the day, after which it bounced upwards. If we see the RSI again, it has breached the support of the oversold zone ,, the level of 30 that is, and is indicating that the slide may continue a little further as per the intraday chart.
On the chart of BankNifty, we can see that today’s candle is the Doji, which is an indication of indecision among the investors. It does not indicate weakness in poarticular, but, the RSI indicator has breached the level of 60 which indicates slight weakness . the support lies in the range of 17050-17000.
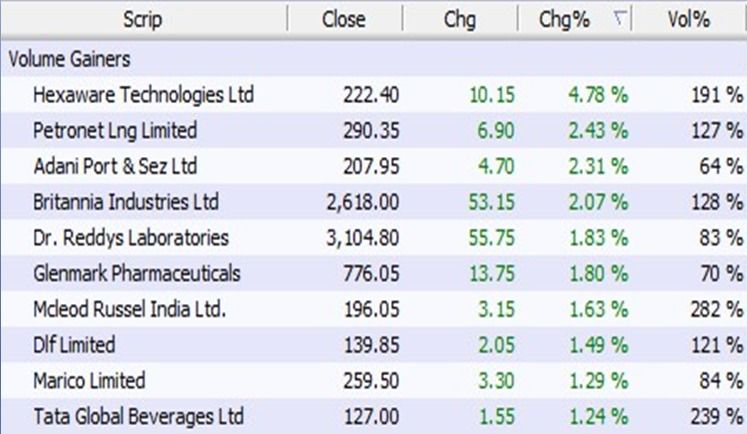
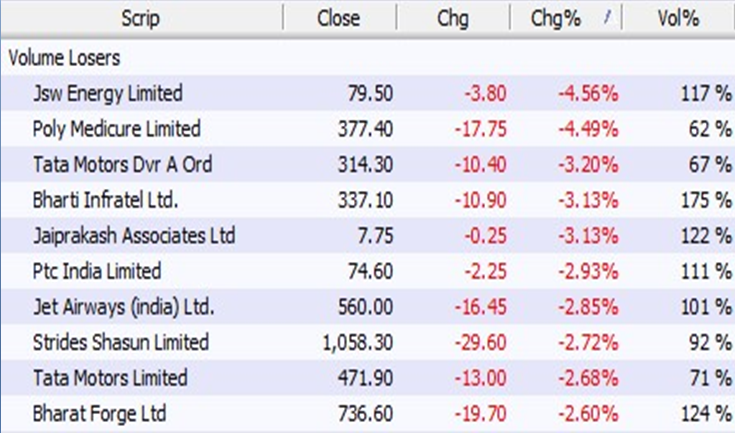
Volume losers for 22.06.16
INTERNATIONAL INDICES
US indices
The Dow Jones and NASDAQ ere mildly yesterday with flattish closing.
European indices
The FTSE 100, DAX and CAC40 are each trading with a positive angle currently.
Asian indices
The Asian markets have been mixed. The SENSEX and Japan’s Nikkie 225 clother negative whereas the Chinese Shanghai and the Hangseng closed with a positive tilt.
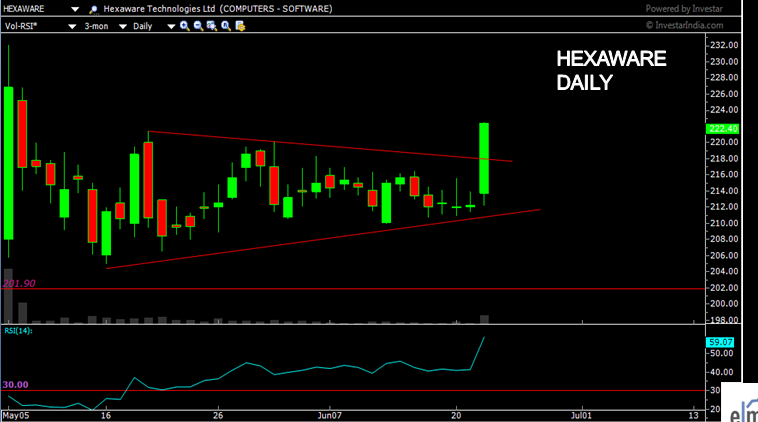
CHART OF THE DAY
Hexaware technologies has bounced back from the very important support level in the recent history. On charts this level has acted as support on two previous instances. This indicates that there is vast upside potential in the stock. If we see the recent movements then a breakout from a triangle formation is visible which emphasizes the upside movement.