Hindi: आप इस लेख को हिंदी में भी पढ़ सकते है|
In technical analysis, price is everything. However, while trading with the help of technical analysis, the price alone is not enough to understand the market sentiment. To get a better picture of the market, traders use different types of indicators and oscillators like moving average indicators, Relative Strength Index(RSI), Stochastic, etc.
In this article, we will discuss the moving average indicator. The indicator not only helps a trader to understand the market situation but also helps to make better trading decisions.
There are different types of moving averages in the field of technical analysis. Let’s discuss each one.
Table of Contents
Simple Moving Average
Simple Moving Average indicator or SMA is a moving average which is calculated by adding the closing price of security prices for the last n-periods and dividing it by the total number of time periods.
For example, suppose we want to calculate the 9 periods SMA of a security price.
First, we will add the last 9 Days closing price of the security and then it will be divided by the 9 periods.
Calculation for 9 periods SMA:
(P9+P8+P7+P6…. +P1)/9
Where,
P=Price
P9= Price 9days ago
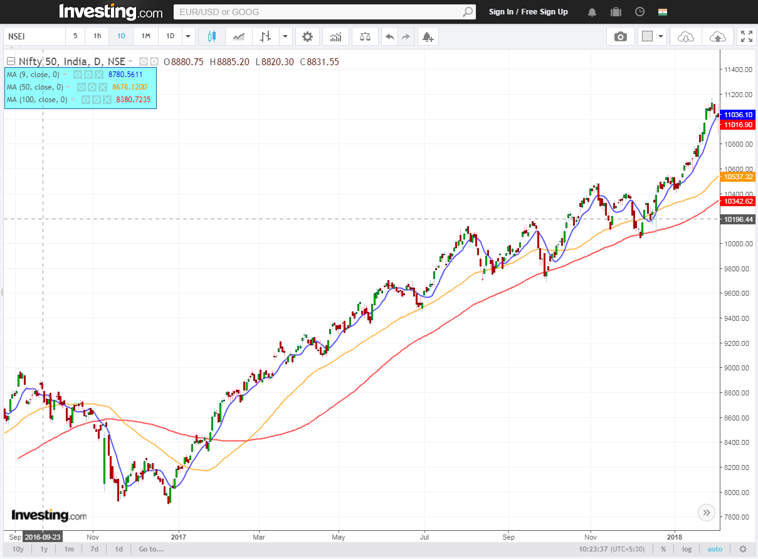
SMA is a Technical indicator represented by a line. It is directly plotted on the security price. The periods can be changed at the trader’s choice.
For shorter-term SMA, we can use 5,9,13, etc. For the Medium term, we can use 20,34,50, and for the longer term, 100,200.
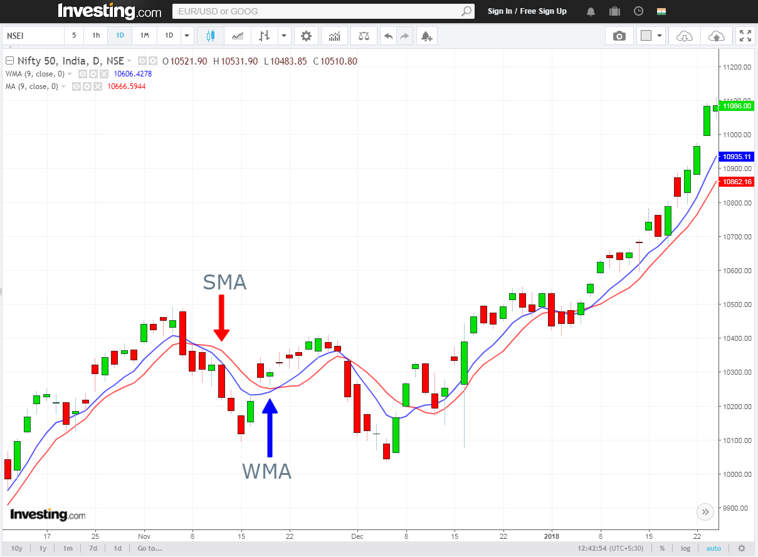
Weighted Moving Average
Sometimes technical traders feel that only the closing or opening price is not enough for calculating a moving average, and this was one of the most important reasons behind the introduction of the Weighted Moving Average indicator.
Weighted Moving Averages (WMA) concentrate more on recent price action. Like SMA, they are also plotted directly on the security price.
While calculating SMA, we have seen that equal weightage is given to individual prices. But, in the case of WMA, it is not the same. Here the latest price gets the maximum importance or weightage.
Suppose we want to calculate the 9 periods WMA of a security price. Then, the recent price will get the maximum importance compared to previous prices. In this way, the last day’s price (9 periods ago) will get the minimum weightage.
Suggested Read: How to use moving average for trading on different timeframes?
Calculation of a 9 periods WMA –
WMA = (P1 * 9) + (P2 * 8) + (P3 * 7) +…….+ (P9 * 1) / (9+8+7+6+5 + 4+ 3 + 2 + 1)
where,
P1= Recent price of the security
P2= Price one day ago.
P3= Price two days ago etc.
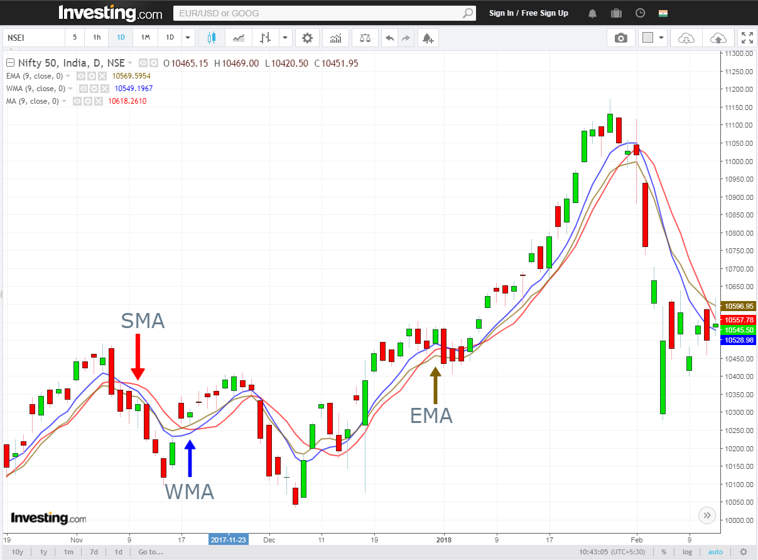
Exponential Moving Average
Exponential Moving Average or EMA is quite similar to the WMA. EMA also gives more weight to recent prices. Like other moving averages, EMA is also plotted directly on the prices.
The main difference is in the calculation of this moving average indicator. While calculating the EMA, the decreasing rate of one price to another is not same. Price decreases exponentially.
Learn in just 2 hours : Building Long & Short term trading strategies with Moving Averages
There are three steps required to calculate the EMA.
1> Finding out the SMA
2>Calculating the Weighting multiplier
3>Finding out the EMA
For, SMA = (Sum of closing price)/Number of time periods
Weighting multiplier= (2 / (Time period + 1))
and then,
EMA= Closing price-EMA (previous day)) x Weighting multiplier + EMA (previous day)
Calculating the EMA is a little bit complicated, but thanks to the advanced charting system, there is no need to calculate it manually or on your own. The EMA is calculated automatically, and it is easily available in most charting platforms.
The 5-9 Day Short Term Moving Average Rule
5 and 9 EMA are both considered short-term moving averages. These moving averages follow prices more closely relative to a medium or longer-term moving average.
It is pretty obvious that EMA 5 will fluctuate more than the 9EMA according to the price movement.
This combination of EMAs is very popular among traders. They help traders by providing early trade signals and good entry and exit points.
Signals occur when short-term EMA (5) crosses the longer-term EMA (9). Depending upon the nature of the crossover, buy and sell signals are generated.
If the EMA 5 crosses the 9 EMA from below, it will generate a positive crossover signal, and according to that, a buy position can be taken. The opposite happens when the 5 EMA crosses the 9 EMA from above. This crossover is called a negative crossover, and depending on that signal, a trader can take a short position.
Also Read: How to trade with Rate of change (ROC) Indicator Strategy?
Below are few examples of positive and negative crossover.
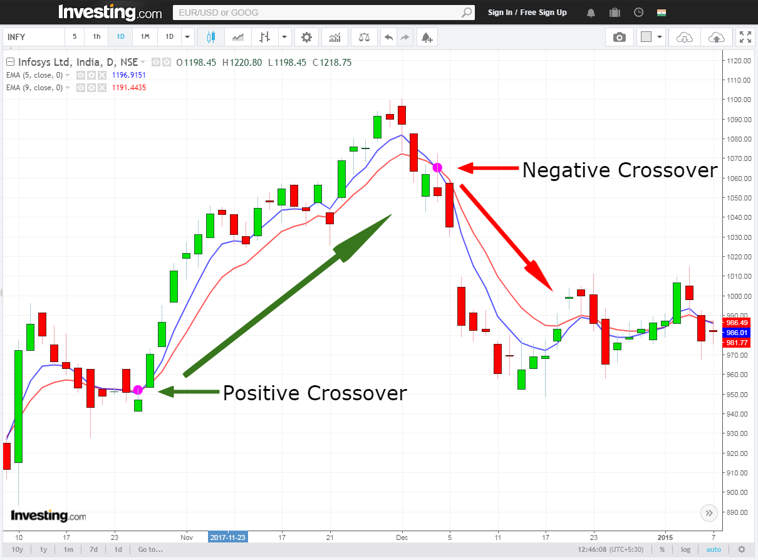
This one-day chart of Infosys showing a positive and negative crossover.
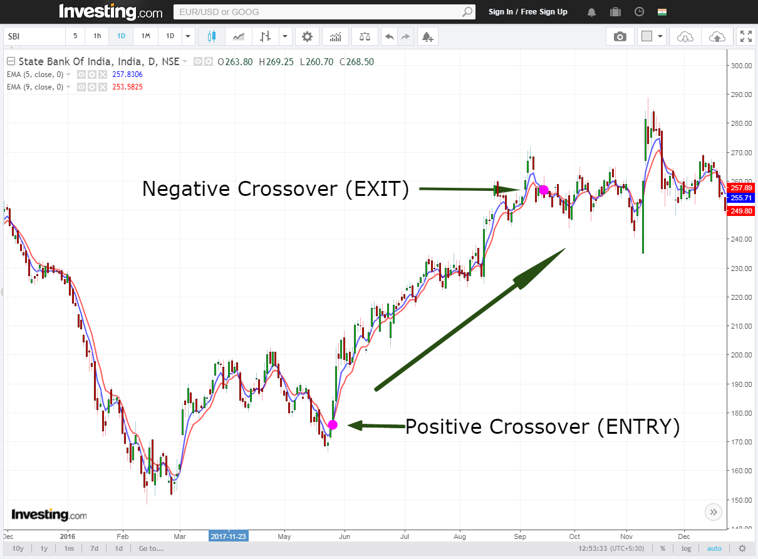
This is the daily chart of SBI. A positive crossover happened during the month of May-June and the stock moved nearly 80points in the upward direction.
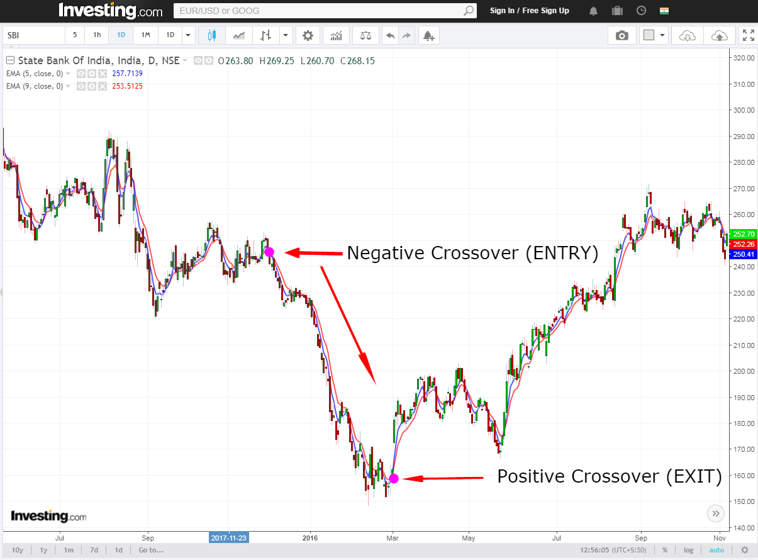
Another example also from SBI. This negative crossover happened in the daily chart. This time also it gave nearly 80 points downward move.
Drawbacks:
1>Due to the high fluctuation of these EMAs they often end up generating false trade signals.
2> Does not work well in choppy market condition.
3> Signals generates very frequently.
It is advisable that do not trade only using these two EMAs. Take the other indicators like RSI and stochastics for better trading decisions.
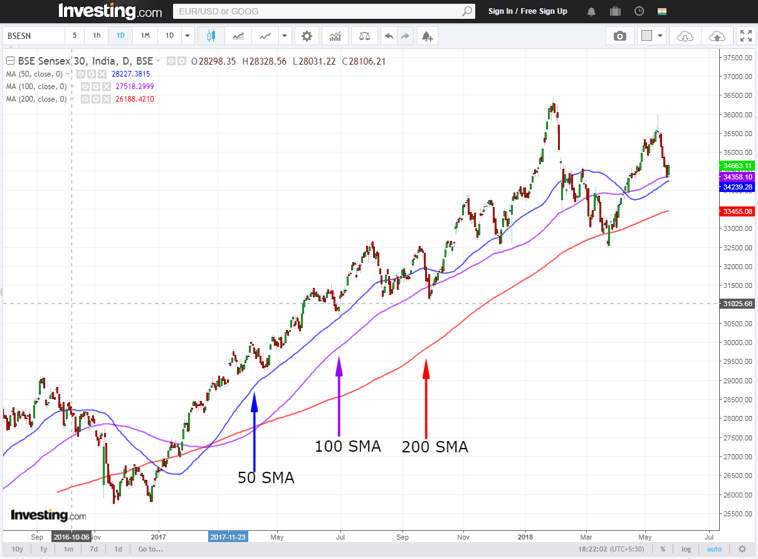
How do 50-day, 100-day, and 200-day moving averages differ?
These are the most important SMAs in technical analysis. SMA 50 is considered as a medium-term moving average SMA but 100 SMA and 200 SMA both are considered as long-term moving average.
The main difference lies in the calculation of these SMAs. SMA 50 requires 50 time periods to calculate, in case of 100 MA and 200 MA 100time periods and 200 time periods are required.
For short-term trades, 50SMA plays an important role and it is considered as a basic resistance and support line. In longer-term time frame, 100 SMA and 200SMAs both play the same role but weightage of these lines are greater than 50 SMA line. It is always better to take a trade at these levels because the price in these level is generally less risky to enter because they are good support levels.
Also Read : A comprehensive study on Support and Resistance
For SMA 50 it is constructed by using the 50 trading day’s closing price. So basically traders see it as a line which is representing 10weeks’ average closing price. Similarly, for SMA 100 line and SMA 200 line represents the average closing price of 20 weeks and 40 weeks.
You can also watch the video below to Learn a Trading Strategy using Moving Average in the Stock Market :
Bottomline:
Moving average indicator is very useful. They suggest good entry and exit points while trading. The simplicity of this indicator makes it popular among the traders. But it has some drawbacks too. In a highly volatile market condition, short-term MAs generate false trade signals which lead to a loss. Moving Average does not work well in choppy market condition and it is advisable to not to use shorter or medium term MAs during that period.
Every indicator has different drawbacks but it is also true that they work well if they are combined with other indicators and oscillators. RSI and Stochastics are one of the most commonly used indicators and oscillator to combine with a moving average indicator.
Frequently Asked Questions (FAQs)
What is a moving average (MA)?
A series of averages of various subsets of the entire data set are created statistically to examine data points, and this process is known as a moving average. It smoothes price data in financial markets so that trends over a given time span can be found.
How does a moving average work?
Using moving averages, one may determine the average price of an asset or security over a certain time frame, like 10, 50, or 200 days. A dynamic average is produced as the computation advances and older data points are removed in favor of newly available data points.
What is the significance of using moving averages in trading?
Moving averages smooth out short-term swings to show the underlying direction of price movements, which aids traders in identifying trends. They also serve as dynamic levels of resistance or support, suggesting possible locations of entry or departure.


Know more about INTRADAY trading strategies.
Learn about INTRADAY trading.