
Nifty ended the week above 12050 with a gain of 1 percent after hitting a fresh record high. The big gains however came from midcap and small cap space.
On the other hand, GDP grew at 4.5% in July-September 2019 which is the lowest since fourth quarter of 2012-13. This data is little alarming and raises concerns of a deepening slowdown in the economy.
Nifty Hourly
Nifty made another retest to the breakout area but witnessed sharp bounce from the upper line of the rectangle pattern. Likely to see further bounce in the short term until 12000 is protected on the downside and further strength to be seen above swing high of 12160.
Technical parameters however look neutral to weak since most of the parameters including CCI and Stochastic are trading in the oversold zone and RSI is trading in the normal area.
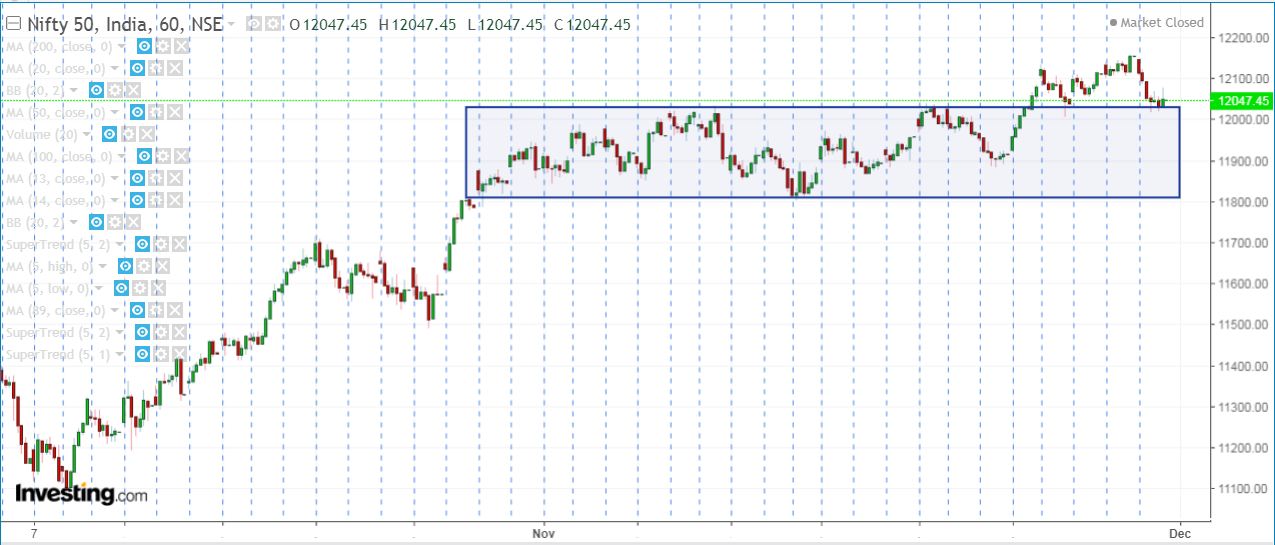
Nifty Hourly chart
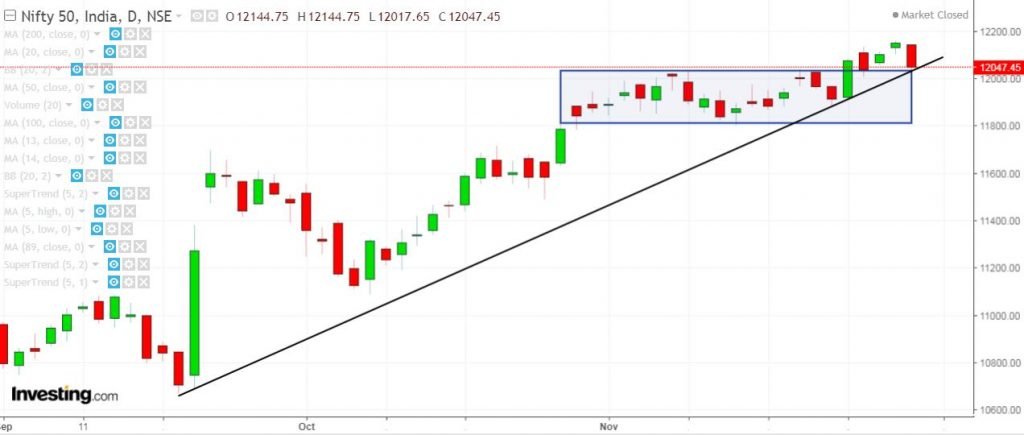
Nifty Daily
In daily chart, the index is trading right at the convergence of uptrend line and daily support zone and the uptrend is still intact as of now. Technical parameters looks positive since most of the indicators including RSI and Stochastic are trading close to the upper bound while CCI is still in the overbought territory.
Probable resistance in the daily chart comes at 5 Day High EMA at 12117 and next resistance at previous swing high of 12160. Probable support in the daily chart comes at 5 Day low EMA at 12120 and 13 Day SMA at 11979.
Nifty Weekly
In weekly timeframe, the index has already witnessed breakout from ascending triangle pattern and trading above the support zone. The uptrend is likely to stay intact until the support zone of 11750-12000 is protected on a broader basis.
Technical parameters looks strong since Stochastic and CCI are still trading in the overbought area while RSI is very close to the upper bound.
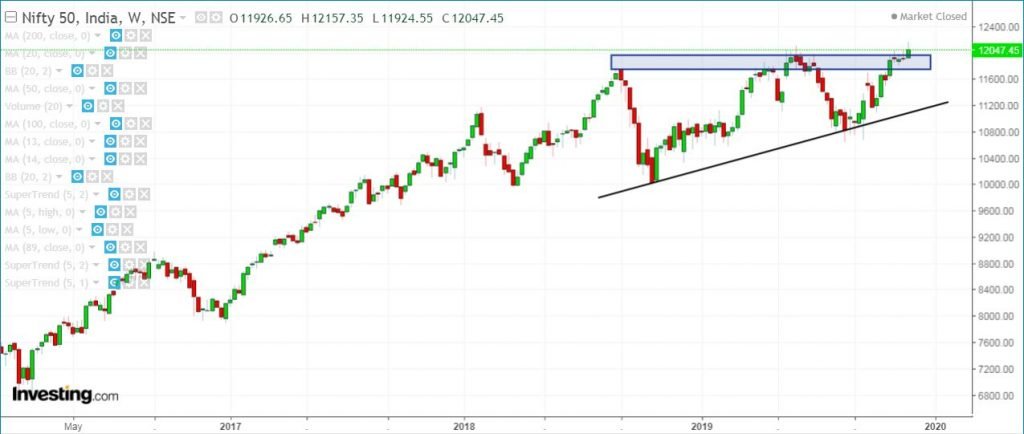
Nifty Weekly chart
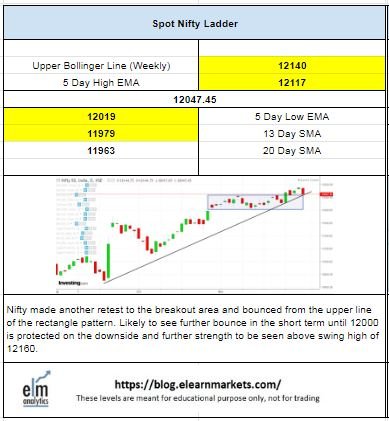
Nifty Tech Table
Nifty Tech Table


