Join Courses
Attend Webinars
Get Free Counselling
  • Select Language
    • Hindi
    • Bengali
+91 9903 222 555
Elearnmarkets - Financial Market Learning
Join Courses Of Elearnmarkets
  • Basic Finance
  • Technical Analysis
  • Fundamental Analysis
  • Derivatives
  • Financial Planning
  • Miscellaneous
No Result
View All Result
  • Basic Finance
  • Technical Analysis
  • Fundamental Analysis
  • Derivatives
  • Financial Planning
  • Miscellaneous
No Result
View All Result
Elearnmarkets - Financial Market Learning
Home Technical Analysis Market Analysis

Nifty sees some profit booking at the record high

Elearnmarkets by Elearnmarkets
November 6, 2017 - Updated on November 18, 2020
Reading Time: 2min read
0
17
VIEWS
Share on FacebookShare on TwitterShare on LinkedIn

Nifty close: Nifty saw some profit booking in the second half of today’s trading session. There was a heavy selling by FII on Friday’s session at the top so it’s better to be cautious.

Hourly Technical:

In the hourly chart, Nifty moved higher in the first hour but later on gave away the gains in the second half.

The probable support in the hourly chart comes at 34 Hour moving average (presently at approx.10434.4), lower Bollinger line (presently at approx.10418.3) and 50 Hour moving average (presently at approx.104090).

On the upside, Nifty may face resistance at Upper Bollinger line (presently at approx.10470.1).

Hourly Stochastic, CCI and RSI are in the normal zone. ADX is still down suggesting some loss of momentum and some profit booking near the lifetime high area.

Overall Nifty remains neutral bullish in the Hourly chart.

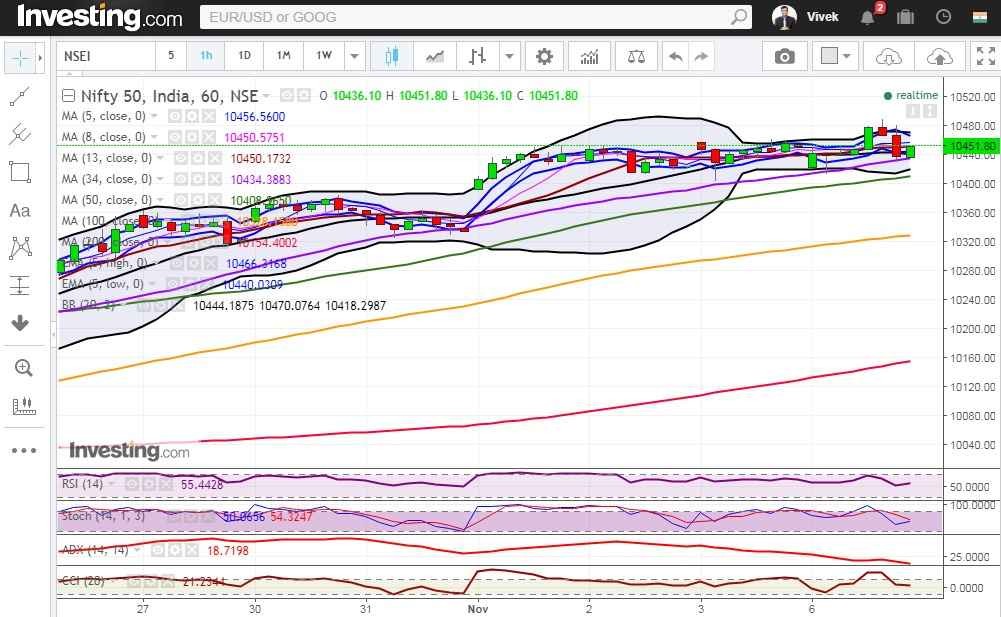
Figure: Nifty Hourly Chart
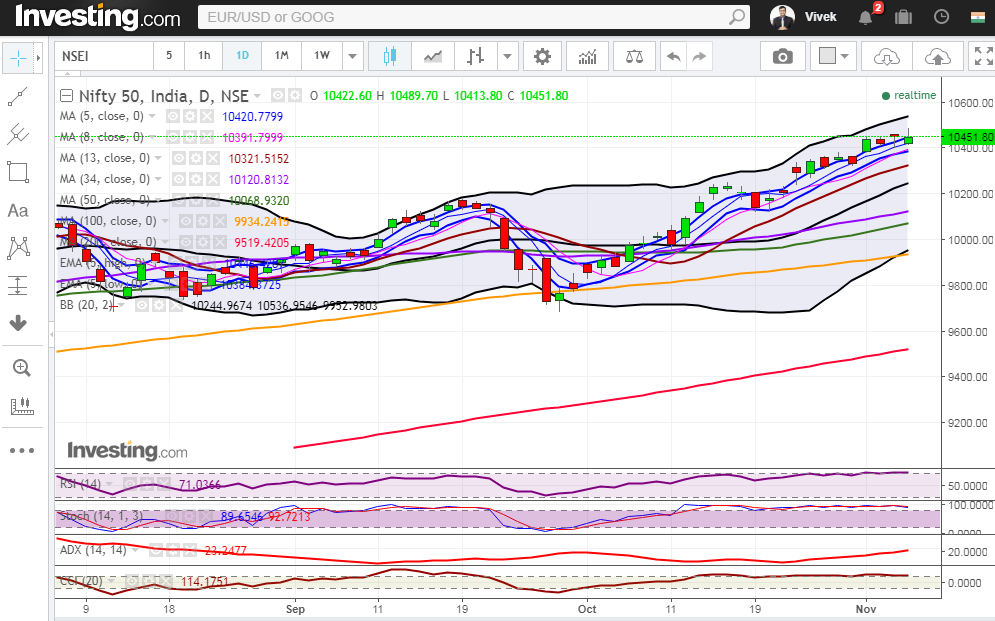
Daily Technical:

In the daily chart, Nifty is still above 5 Day High EMA and also above all short-term moving averages indicating a positive bias.

The probable support in the daily chart comes at 5 DMA (presently at approx.10420.8), 8 DMA (presently at approx.10391.8) and 5 Day Low EMA (presently at approx.10384.4).

On the upside, Nifty may face resistance at Upper Bollinger line (presently at approx. 10537).

Stochastic, CCI and RSI are in the overbought zone and ADX is still up indicating a gain in upside momentum.

Overall Nifty remains bullish in the daily chart.

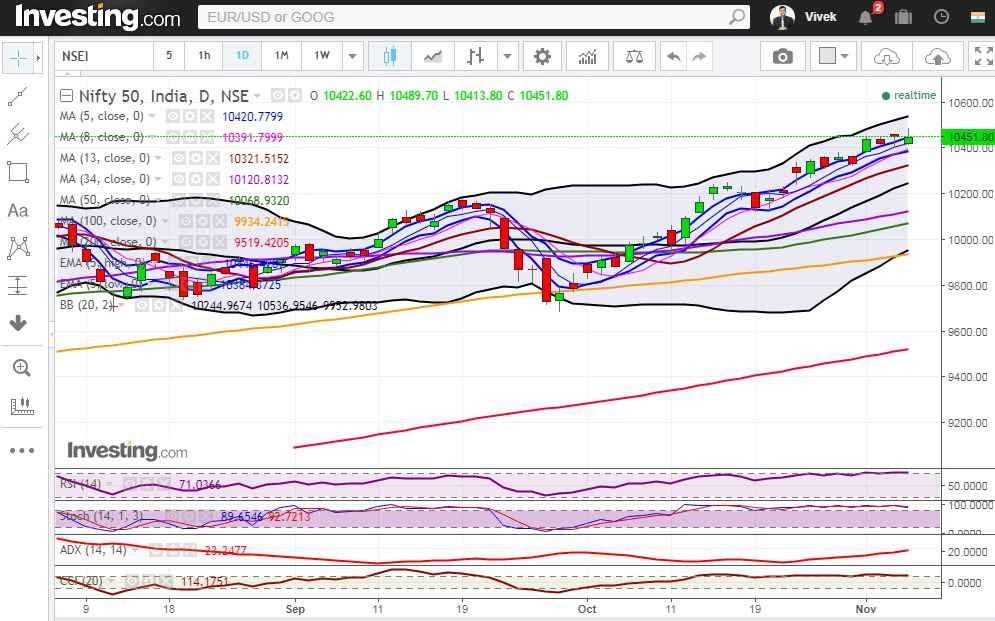
Figure: Nifty Daily Chart

Want to know how to analyze the below table?Watch the video below:

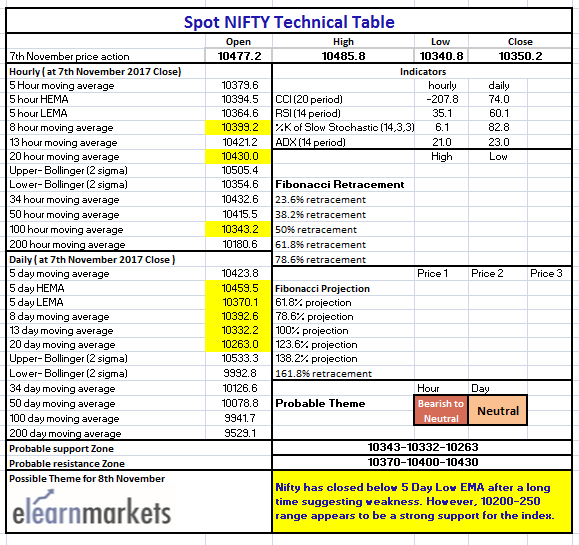
Figure: Nifty Tech Table

Bottomline:

You can read the related blogs here

Happy  Reading!!

Tags: english
ShareTweetShare
Subscribe To Updates On Telegram Subscribe To Updates On Telegram Subscribe To Updates On Telegram
Previous Post

Weekly Nifty closing resonate bullish sentiment

Next Post

How to trade using Larry Connor’s 2-period RSI?

Elearnmarkets

Elearnmarkets

Elearnmarkets (ELM) is a complete financial market portal where the market experts have taken the onus to spread financial education. ELM constantly experiments with new education methodologies and technologies to make financial education effective, affordable and accessible to all. You can connect with us on Twitter @elearnmarkets.

Related Posts

Hourly Chart
Market Analysis

Nifty Washes Off Three Day’s Gain, Closes Below 11500

March 22, 2019 - Updated on November 18, 2020
407
Market Wrap

Nifty breaks the consolidation phase, up approx. 360 points

March 16, 2019 - Updated on November 18, 2020
96
Hourly Chart
Market Analysis

Nifty Made A Close Above 11000. Is The Consolidation Over?

March 9, 2019 - Updated on November 18, 2020
67
Hourly Chart
Market Analysis

Nifty Ends In Green Amid Geopolitical Tension

March 2, 2019 - Updated on November 18, 2020
53
Next Post

How to trade using Larry Connor’s 2-period RSI?

Bank Nifty likely to make a sharp move either way

Lupin triggers sharp selloff in Nifty; forms bearish engulfing

Leave a Reply Cancel reply

Your email address will not be published. Required fields are marked *

Follow Us

Download App

Register on Elearnmarkets

Continue your financial learning by creating your own account on Elearnmarkets.com

Register Free Account

GET ARTICLES ON EMAIL

Enter your email address:

Categories

  • Banking
  • Basic Finance
  • Bonds & Fixed Income
  • Budgeting & Savings
  • Capital Markets
  • Charts
  • Charts, Patterns & Indicators
  • Commodity, Currency & FOREX Market
  • Derivatives
  • ETFs & Mutual Funds
  • Financial Planning
  • Financial Statement Analysis
  • Fundamental Analysis
  • Macroeconomics
  • Market Analysis
  • Market Updates
  • Market Wrap
  • Marketshala
  • Miscellaneous
  • Open Interest
  • Personal Wealth
  • Retirement Planning
  • Sector Analysis
  • Tax Planning
  • Technical Analysis
  • Trading Terms, Rules & Strategies
  • Visit Elearnmarkets
  • Courses
  • Webinars
  • Financial Guides
  • Get Free Counselling

© 2020 Elearnmarkets All Rights Reserved

No Result
View All Result
  • Article Categories
  • Basic Finance
  • Derivatives
  • Financial Planning
  • Fundamental Analysis
  • Market Analysis
  • Miscellaneous
  • Technical Analysis
  • Select Language
    • Hindi
    • Bengali
  • Learn finance
  • Browse Courses
  • Webinars
  • Free Guides
  • Get Free Counselling

© 2020 Elearnmarkets All Rights Reserved