Nifty close 11922.8: This was a week of consolidation post election result. Vix consolidate between mid 14 to mid 16 ranges and price tried to push a little higher, before eventually giving up some of its gains on Friday ahead of GDP data post market.
GDP data was at 5.8% for the Jan-March quarter while unemployment rate came at 6.1%. This data may dampen the mood of bulls. However sharp 10% decline of crude oil during the week may be supportive from price advancement perspective.
SGX nifty actually rose 60 points after the release of GDP data as crude oil saw sharp 6% fall while the Indian market was closed.
However market has failed twice in two weeks to close above the 12k mark. We have to focus at the price action in the week ahead.
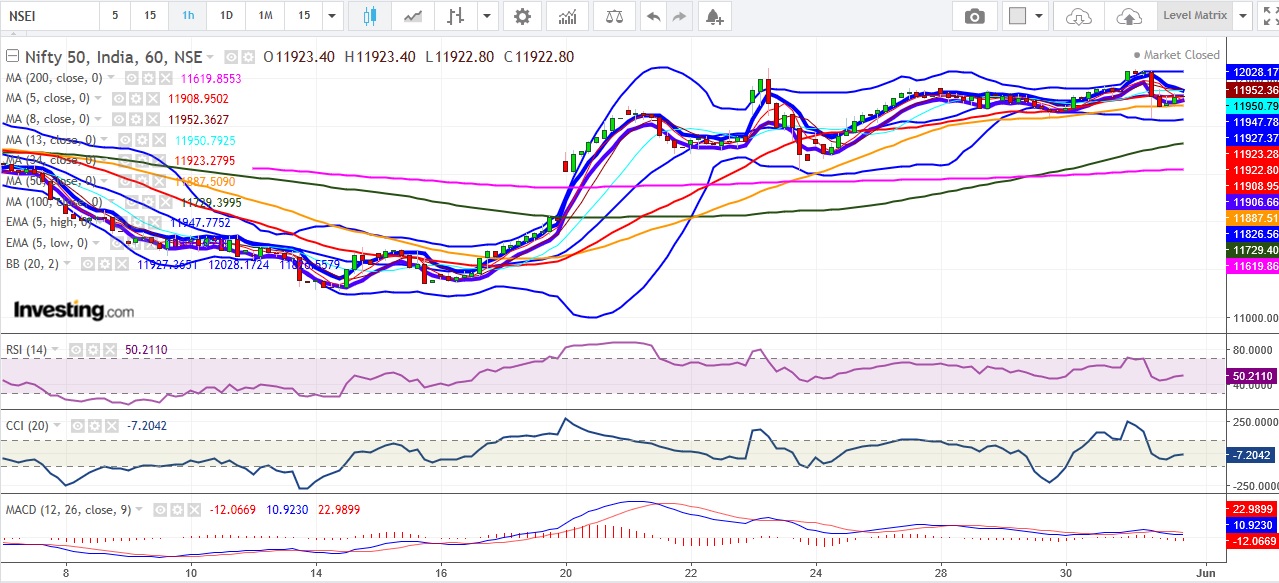
Hourly Technical: In hourly chart, we can see that all the moving averages are at a similar level and almost entangled with price.
Bollinger band is also horizontal and flat. The Hourly RSI is near 50 an hour CCI is at -7 and Hourly MACD is very near to midpoint 0 and all of them indicate lack of directional bias and momentum. All these indicate very range bound situation and market may consolidate ahead of upcoming budget in first week of July and 1Q19 results due in the month of July.
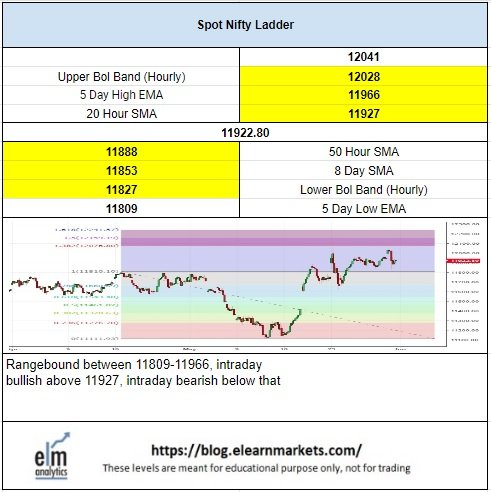
Hence for now 12041 (the election result day high) and 11827 (lower Bollinger band) remain two important areas for the market. Below 11827, 100 Hour SMA of 11729 and 200 hours SMA of 11620 may provide, support to the market.
On the other side, if price breaches 12042 and sustains above that, Nifty may scale new highs ahead of budget.

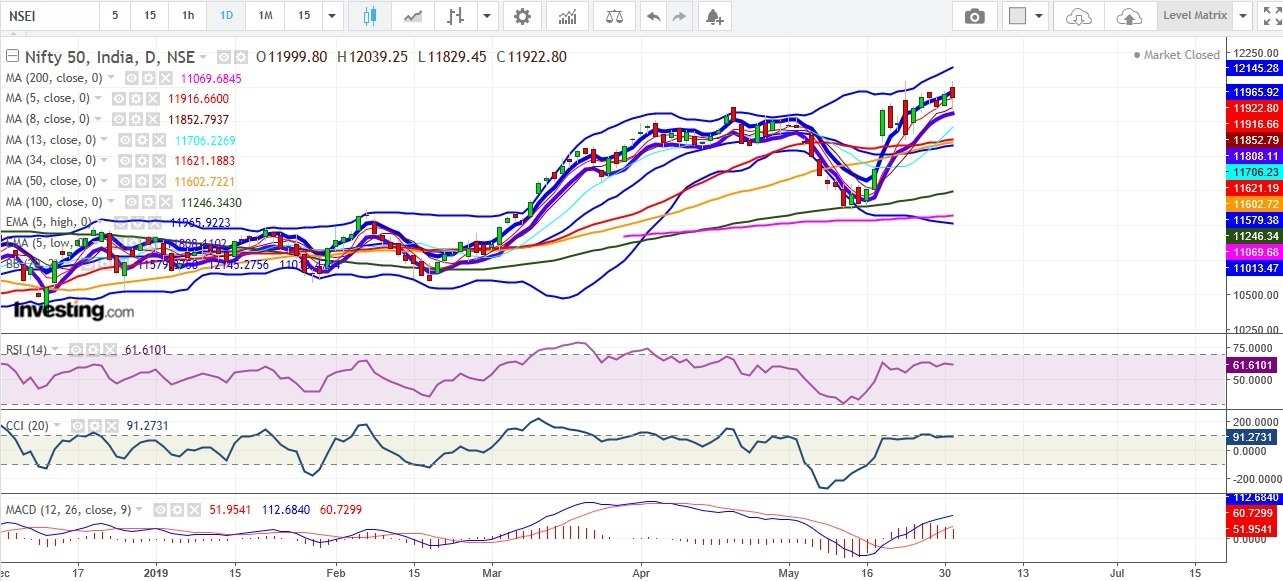
Daily Technical: On the daily chart, the index shows little more bullishness than in hourly chart.
Price closed above 5 Day SMA of 11917, but failed to close above 5 Day High EMA 11966.
The 5 Day Low EMA stands at 11808. As long as price is between 5 Day High EMA and 5 Day Low EMA, The index should remain range bound, However as soon as it start closing above 5 Day High EMA, bullish probability will become dominant. However, close below 5 Day Low EMA will open up bearish possibilities as macro data has not been great recently.
On the upside, 12145, i.e. upper Bollinger band, remains a possible mark if Nifty breaks out above 12041. On the downside, 11706 i.e. the 13 Day SMA and 11579 i.e. the 20 Day SMA remains an important support beyond 11808.
Presently RSI is near 62, CCI is near 92 and MACD is above signal line and still expanding. All these things indicate towards the possibility of a continued bullish momentum in the days to come.
So, the overall sentiment is positive. But as we mentioned earlier that breaking below 11808 can create downside momentum. Until then there would be a totally range bound movement.
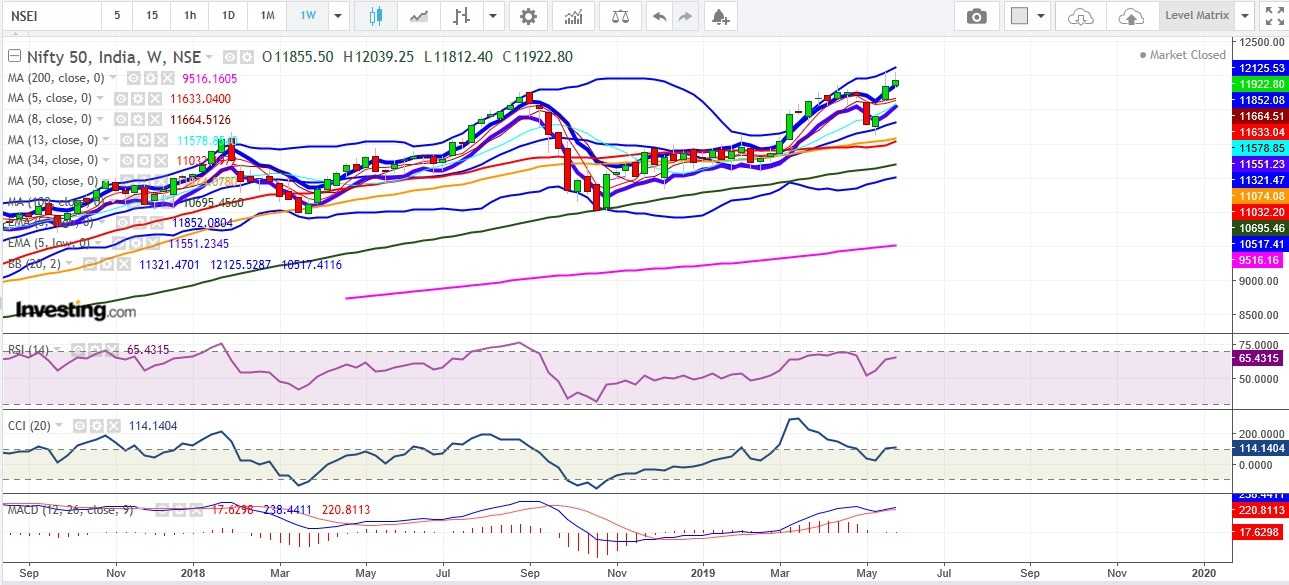
Weekly Technical: Nifty is most bullish in the weekly time frame. This weekly candle was relatively smaller; however it managed to close above 11852, i.e. 5 Week High EMA. Nifty presently closed above most short term moving averages, which signifies bullishness.
On the downside, 11633 i.e. the 5 Week Low EMA is an important support if price stays below 11852.On the up-side weekly Upper Bol Band 12126 may act as an important mark.
The Weekly RSI is at 65 and trending Higher. The Mid-Bollinger line is trending higher and CCI has breached 100 and is at 114 now. MACD is above signal line and is trending higher. However we may observe bearish divergence of Nifty with RSI and CCI in weekly charts. That does not necessarily mean immediate down move , unless 11633 is violated on closing basis in weekly time frame. Over all the bullish probabilities still look higher in weekly time-frame.
You can use StockEdge app to get cutting edge over others in both short term trading and investing. Here you not only get data at one particular place but can also create your own combination scans based on your own technical and fundamental parameter. See the video below to know about various features in StockEdge app.


