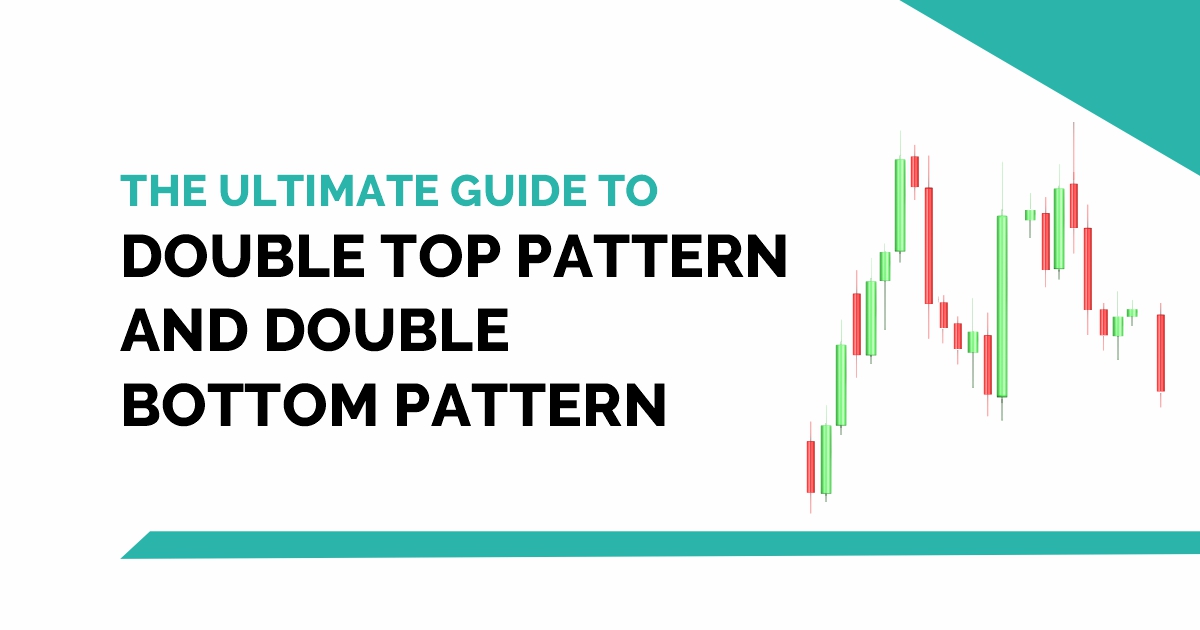
The Ultimate Guide to Double Top Pattern and Double Bottom Pattern
Double top and double bottom chart patterns are important technical indicators in stock trading. Learn how to identify and interpret ...
Double top and double bottom chart patterns are important technical indicators in stock trading. Learn how to identify and interpret ...
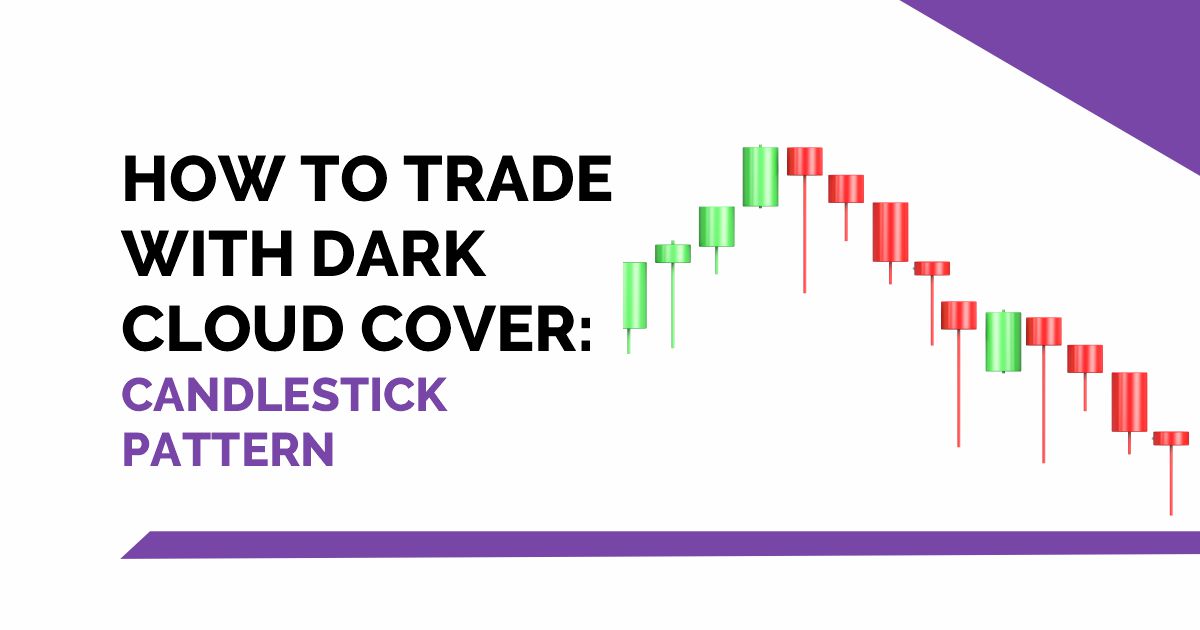
Hindi: आप इस लेख को हिंदी में भी पढ़ सकते है| Dark Cloud Cover is a bearish reversal candlestick pattern ...

Chart patterns play a crucial role when analyzing the charts for trading. In technical analysis, the transitions in the trends ...

Wedges are a type of chart pattern that is formed by converging two trend lines. They can be continuation as ...

A flag pattern is a type of chart continuation pattern that shows candlesticks contained in a small parallelogram. Read this ...

Discover the secrets of the triple top and triple bottom patterns with this comprehensive guide. Learn how to trade these ...

Looking to understand the symmetrical triangle pattern? This article breaks down the key characteristics and provides tips on how to ...

Looking to enhance your technical analysis skills? This guide explains the concepts of ascending and descending triangles and how to ...

The Channel is a continuation chart pattern which is formed by the combination of two lines. These two lines are ...

Pennants are a type of continuation chart pattern. Pennants are similar to flag chart patterns in the terms that they ...

English: Click here to read this article in English. मूल बातें: डार्क क्लाउड कवर एक बेयरिश (मंद) रिवर्सल कैंडलस्टिक पैटर्न ...
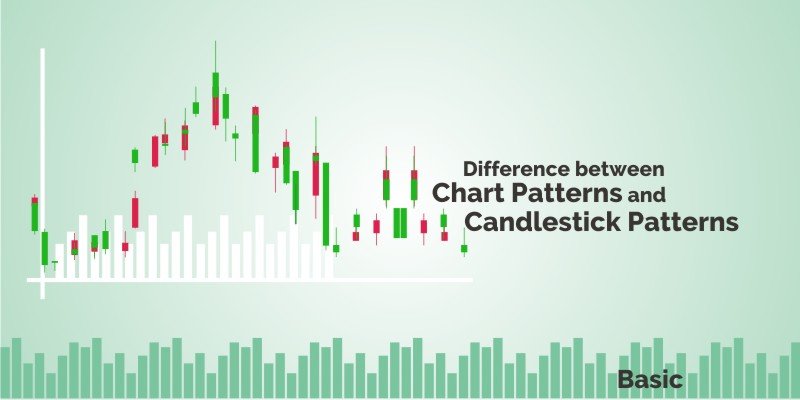
Identifying patterns one of the biggest tasks for any trader in the stock market. This is where candlestick charts or ...