5 MACD Strategies For Stock Market Trading
In In today's blog, we'll go through 5 trading strategies that use the MACD indicator, as well as we will also discuss how to incorporate these methodologies into your trading system.
In In today's blog, we'll go through 5 trading strategies that use the MACD indicator, as well as we will also discuss how to incorporate these methodologies into your trading system.

Here is a comprehensive guide on 35 Candlestick Chart Patterns and how to trade with these candlesticks.

A very common problem with intraday traders is which indicators work well for the intraday trades. Being an intraday trader, chances are that you use technical analysis to identify trades based on different parameters. However, the first indicator which comes...
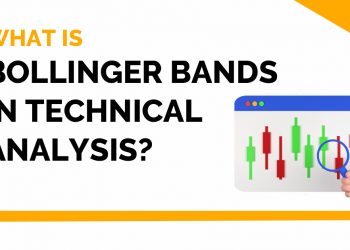
In the 1980s, a tool named “Bollinger Bands” was invented by John Bollinger. These bands are volatility indicators similar to the Keltner Channel. Except for the Bollinger Bands, which are placed two standard deviations above and below the moving average,...
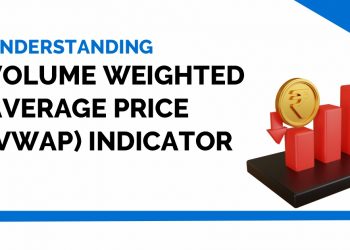
In today's blog, let us discuss the Volume Weighted Average Price (VWAP) Indicator and how to use this indicator.

The Chaikin Money Flow Indicator is a volume indicator created by Marc Chaikin (as well as the Chaikin oscillator). In today's blog, we will discuss Chaikin Money Flow Indicator and How to use it:
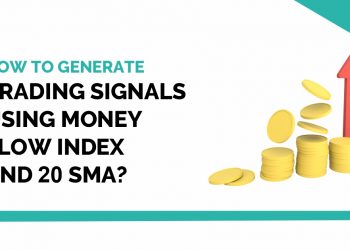
How to potentially generate trading signals for buying and selling stocks by combining the Money Flow Index (MFI) and the 20-day Simple Moving Average (SMA) technical analysis indicators.
Read our blog on On Balance Volume (OBV) technical indicator.

Parabolic Stop and Reverse (PSAR) is a technical indicator developed by J. Welles Wilder Jr., introduced in his 1978 book, "New Concepts in Technical Trading Systems." PSAR is used primarily by traders to identify potential reversals in the direction of...
In 1987, J. Welles Wilder developed the Average Directional Index (ADX) as an indicator of trend strength. He developed the ADX Indicator with commodities and daily prices in mind, but it can also be applied to stocks. ADX quantifies the...
The Relative Strength Index indicator can also forecast trends, trend reversals, trend continuations, and stagnate corrections. The RSI indicator can be a helpful tool in your trading arsenal with practice and a firm understanding of volume and price action.
Read our blog to know the Best 25 Technical Indicators that Every Trader Should Know when trading in the stock market.