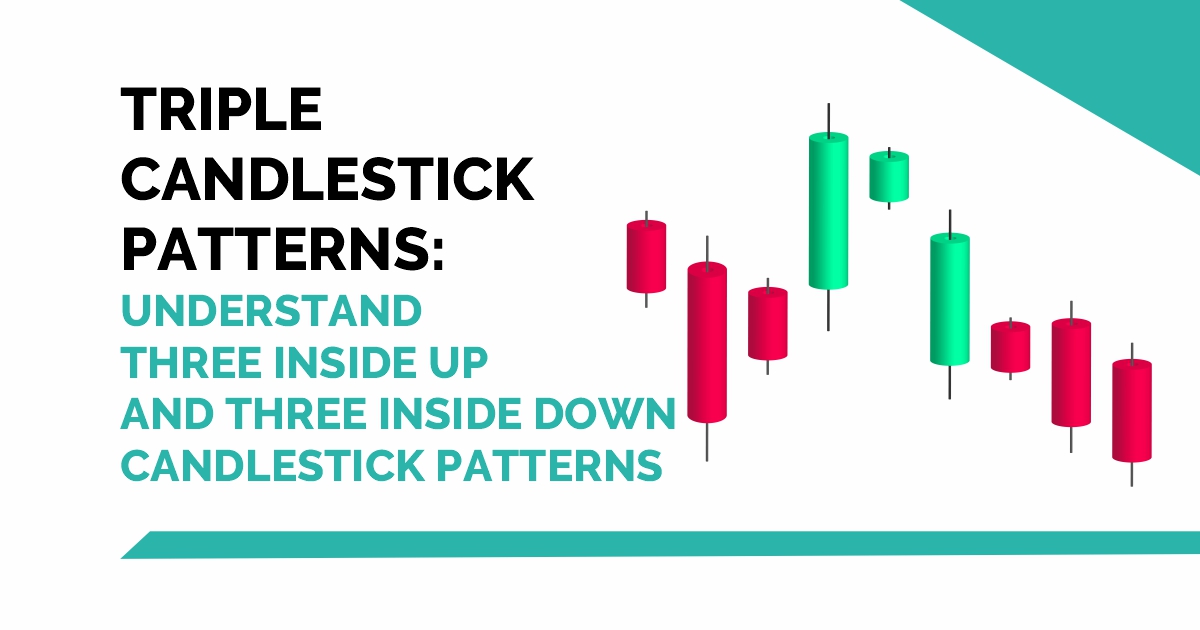
Business Models – Example, Types, Importance & Advantages
April 12, 2024
How to Withdraw Money from ATM ?
April 1, 2024
9 Types of Volume Indicators a trader should know
March 13, 2024
5 MACD Strategies For Stock Market Trading
April 24, 2024
The three up/down candlestick patterns are variations of chart candle reversal patterns. They are usually used to indicate a trend reversal. So, in today’s blog will discuss Three Outside up and Three Outside Down Candlestick Patterns.
The inverted hammer is a candlestick pattern in financial chart analysis that typically signals a potential reversal in the prevailing trend. It appears as a single candlestick with a small body at the top and a long lower shadow, resembling...
The Harami, which means "pregnant" in Japanese, is a multiple candlestick pattern and is considered a reversal pattern. The first candlestick is referred to as the "mother" with a large real body that embodies the smaller second candlestick, thus creating...
When the traders see the formation of tweezer up and bottom candlestick patterns on the charts, they should get cautious that reversal is going to place.
On candlestick charts, the three inside up and down patterns are types of candle reversal patterns.So, in today's blog will discuss these triple candlestick patterns in detail.
Learn how to interpret Marubozu patterns and integrate them into your trading strategy for enhanced decision-making. Elevate your trading knowledge with insights into this single-candlestick pattern that speaks volumes about market sentiment.
Three white soldiers is a multiple candlestick pattern that is used for analyzing charts of stocks, currencies, commodities, etc. Also known as the Three Advancing White Soldiers, this candlestick pattern is used for predicting reversal from a downtrend to an...
Explore the world of High-Frequency Trading (HFT) with insights into lightning-fast financial transactions. Learn how advanced algorithms and cutting-edge technology enable traders to execute large numbers of orders at unprecedented speeds, gaining a competitive edge in today's dynamic markets.
Morning star is formed at the bottom of a downtrend and it gives us a warning sign that the ongoing downtrend is going to reverse.
"Discover the power of bullish engulfing candlestick patterns in technical analysis. Learn how this bullish reversal pattern, characterized by a smaller red candle followed by a larger green candle, signals potential upward market momentum. Enhance your trading skills with insights...
Unlock market insights with the piercing candlestick pattern – a powerful technical analysis tool in trading. Learn how this bullish reversal pattern signals potential trend changes, helping you make informed decisions and maximize your trading success. Explore the significance of...
Hammer candlestick pattern is a bullish reversal and it occurs at the bottom of a downtrend.
Create your free Elearnmarkets account and
Get 20% off with code WELCOME
on your first purchase of any course or webinar