Forex Indicators are considered to be an essential part when trading in the forex market.
Several forex traders use these forex indicators daily, which helps them understand when they can buy or sell in the forex market. These forex indicators are known as an important part of technical analysis, and every technical or fundamental analyst should be aware of these forex indicators
Today’s article will show the top 10 Forex indicators that every forex trader should know.
As indicators are an important part of Forex trading, and for a forex trader- every technical and fundamental analyst should know the structure and use of mostly used mt4 indicators.
Let’s look at the top 10 Forex indicators that every forex trader should know.
1. Moving Averages
The concept of moving average is very important that every trader should know. The central bank and multinational companies drive the forex market. Therefore, it is important to understand what is happening at the macro level.
The moving average is one of the forex indicators that is the average price of the last number of candles that represent the overall sentiment of the price.
If the price is trading above the moving average is it is an indication that buyers are controlling the price.
On the other hand, if the price is trading below the moving average, it means sellers control the price. Therefore, in your trading strategy, you should focus on buy trades if the price is above the moving average. It is one of the best forex indicators that a trader should know
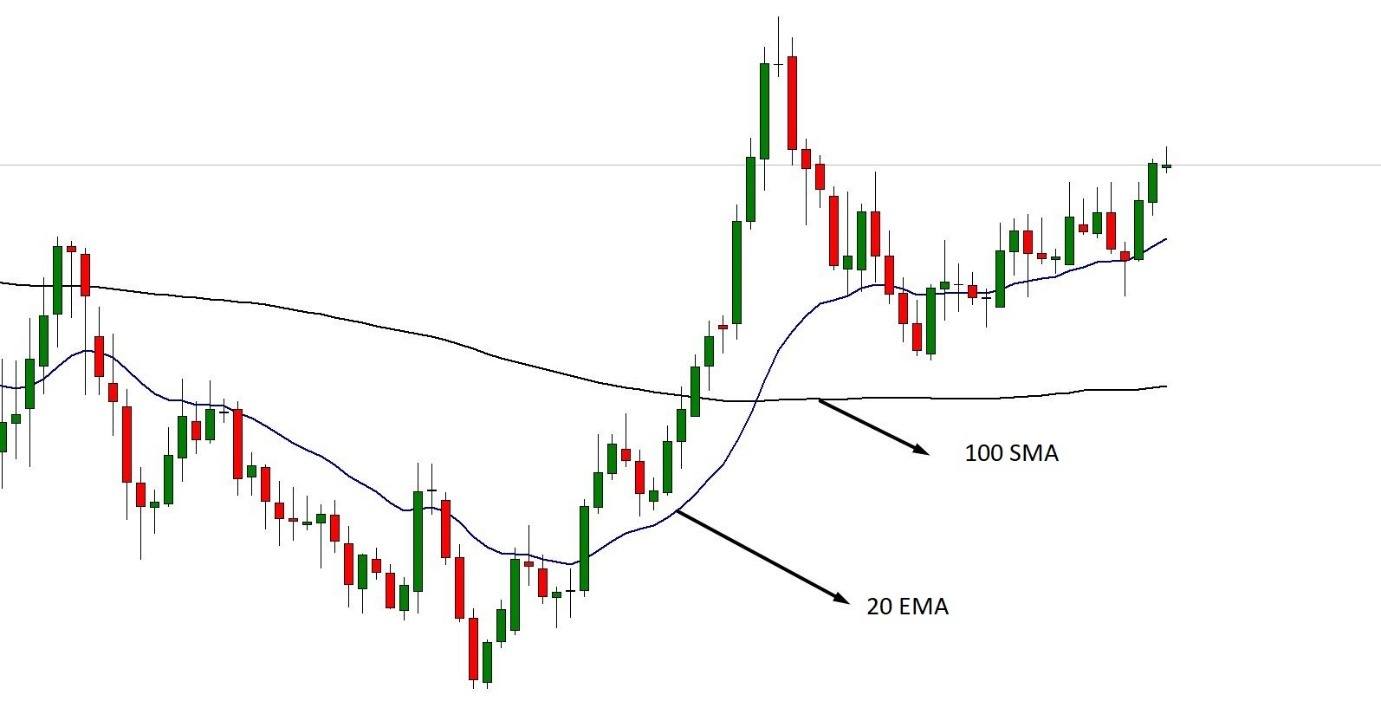
Furthermore, the simple moving average indicates the average price of the last number of candles that helps traders to understand the market context.
On the other hand, the exponential moving average focuses on the most recent movement that helps traders enter a trade.
2. Relative Strength Index
The relative strength index is another type of forex indicators that ranges from 0 to 100 levels. This indicator indicates where the price is likely to reverse.
In an uptrend, when the price moves above the 70 levels, it indicates a bearish market reversal. Similarly, if the price moves below the 30 levels in a downtrend, it indicates a bullish market reversal.
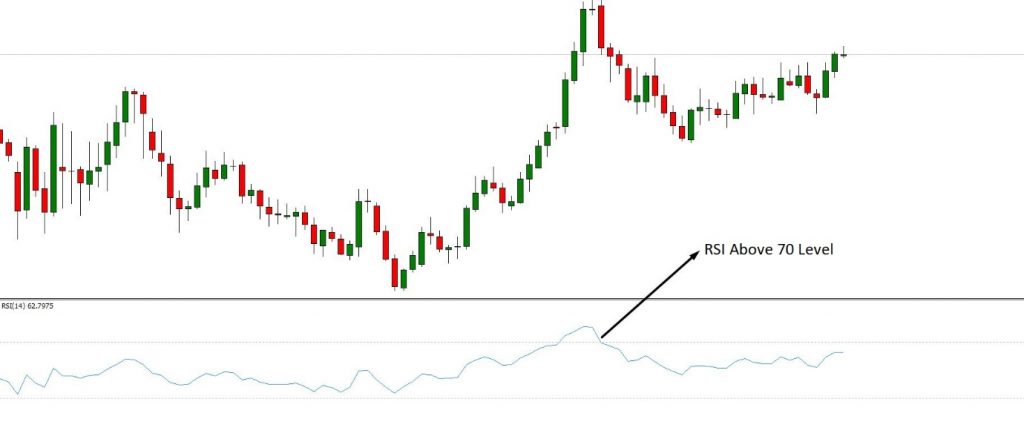
On the other hand, RSI provides trading opportunities by creating a divergence with the price.
Learn about technical indicators with Technical Trading Made Easy Course by Market Experts
3. MACD
One of the most used forex indicators is MACD- Moverage Average Convergence and Divergence
MACD is a trading indicator that consists of a histogram and an exponential moving average. The main purpose of this indicator is to calculate divergence with the price. The regular divergence with MACD and price indicates a market reversal, while their hidden divergence indicates a market continuation.
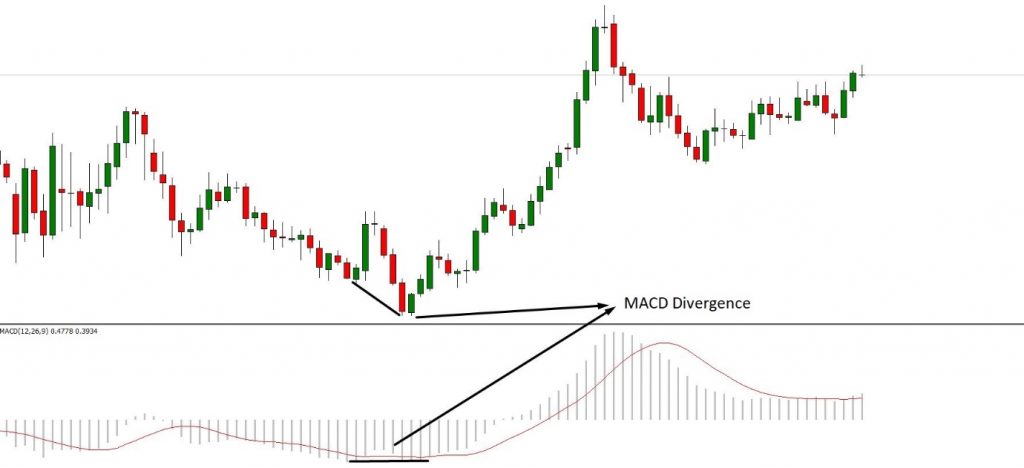
Traders often use it as a primary indicator to create a trading strategy. On the other hand, you can use this indicator to find a possible market reversal point or a continuation point. Therefore, you can enter the trade according to a trading strategy based on other mt4 indicators.
4. Bollinger Bands
John Bollinger created the Bollinger Bands indicator which is one of the forex indicators. The main element of Bollinger bands is moving averages.
There are two standard deviations in upside and the downside and a classical moving average in the middle.
Overall, this trading indicator is very easy to use and provides a reliable trading entry.
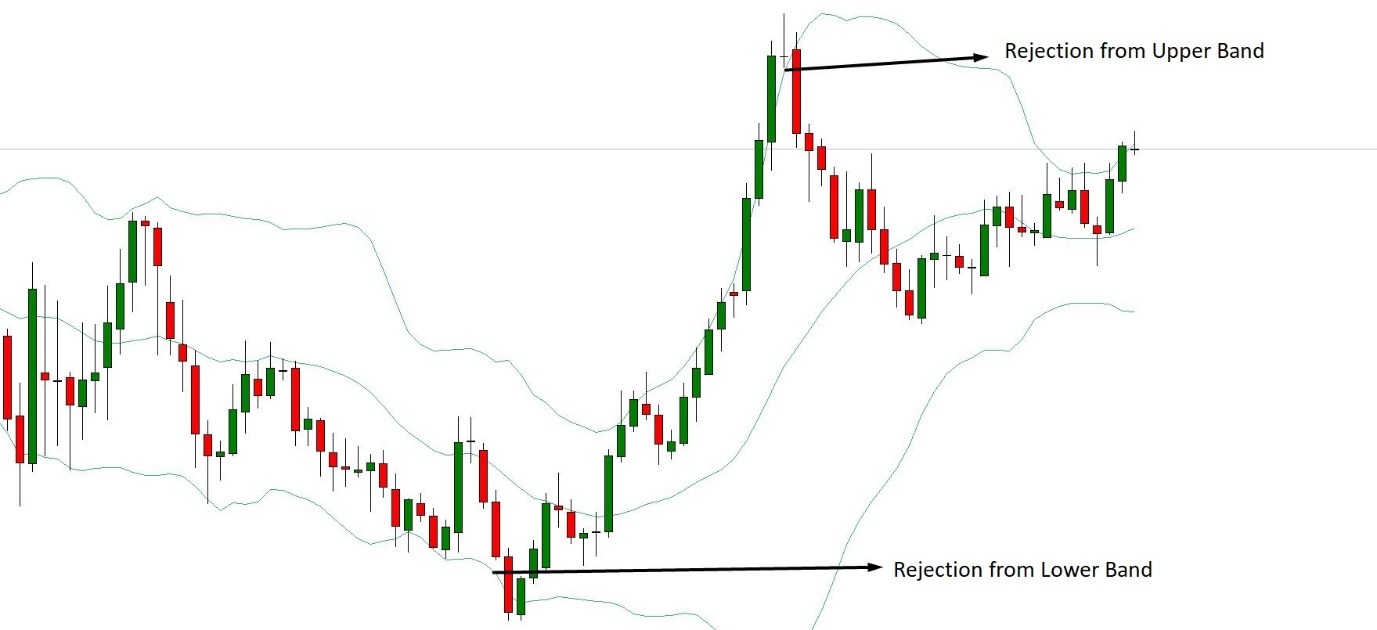
The upper and lower line in Bollinger bands indicator works as dynamic support and resistance levels.
Any rejection from these levels indicates a possible entry. Furthermore, any breakout from these levels also provides profitable trades.
However, a candle close below or above the middle line creates the possibility of testing the next level.
5. Stochastic
Stochastic is a popular momentum indicator that was developed in the early 1950s. The main aim of this indicator is to identify the overbought and oversold zone.
Traders often need to find a possible profit-taking area in their trading strategy.
Therefore, they use this forex indicator to find the location from where the price is expected to reverse. The Stochastic indicator moves from 0 levels to 100 levels.
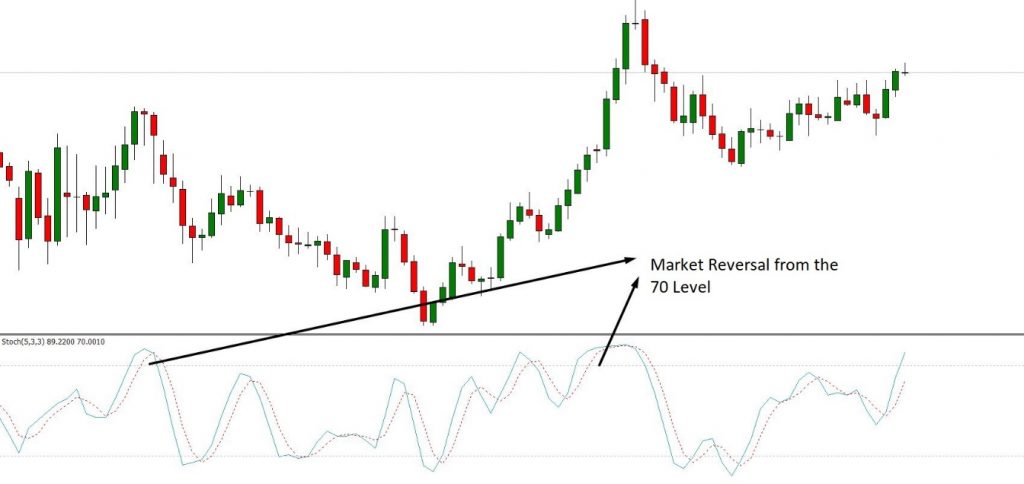
If the price moves above the 70 levels, the price will likely reverse. On the other hand, if the price moves below the 30 levels, it creates the possibility of a bullish reversal.
6. Ichimoku Kinko Hyo
Ichimoku Kinko Hyo or the Ichimoku Cloud is one of the forex indicators with elements to create a complete trading strategy.
Several elements in this indicator help traders to identify every aspect of the market.
The Kumo Cloud is the first element of this indicator that helps to understand the market context. If the price is trading below the Kumo Cloud, the overall trend is bearish, and above the Kumo Cloud is bullish.
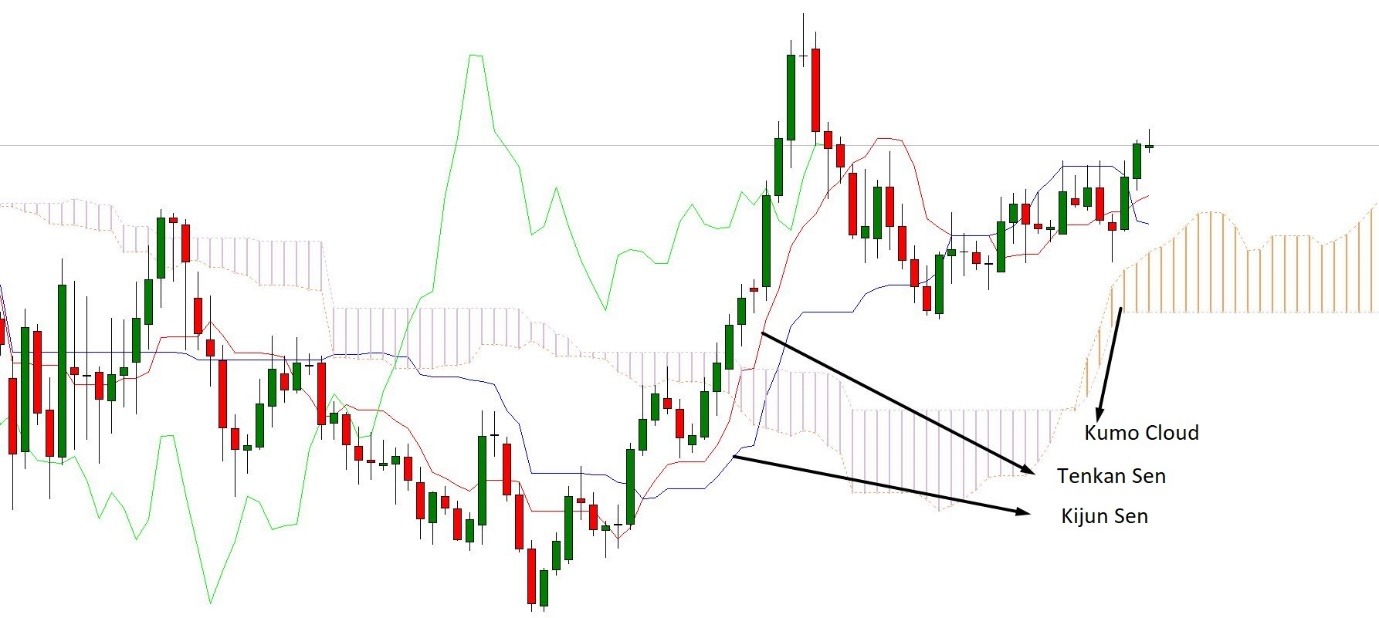
On the other hand, Tenkan Sen and Kijun Sen are two important elements of this indicator that made with the concept of moving average. These two lines move with the price, and any rejection from these creates a trading entry.
7. Fibonacci
Fibonacci is a trading tool that shows the most accurate market direction as it is related to every creature in the universe.
The most significant part of the Fibonacci tool is the golden ratio of 1.618. In the forex market, traders use this ratio to identify market reversal and the profit-taking area.
Suggested Read – Fibonacci Retracement – How to use it while trading stocks
If the price moves with a trend, corrects towards 61.8% Fibonacci retracement, and shows a market reversal, the price will likely move 161.8% Fibonacci extension level of the current leg.
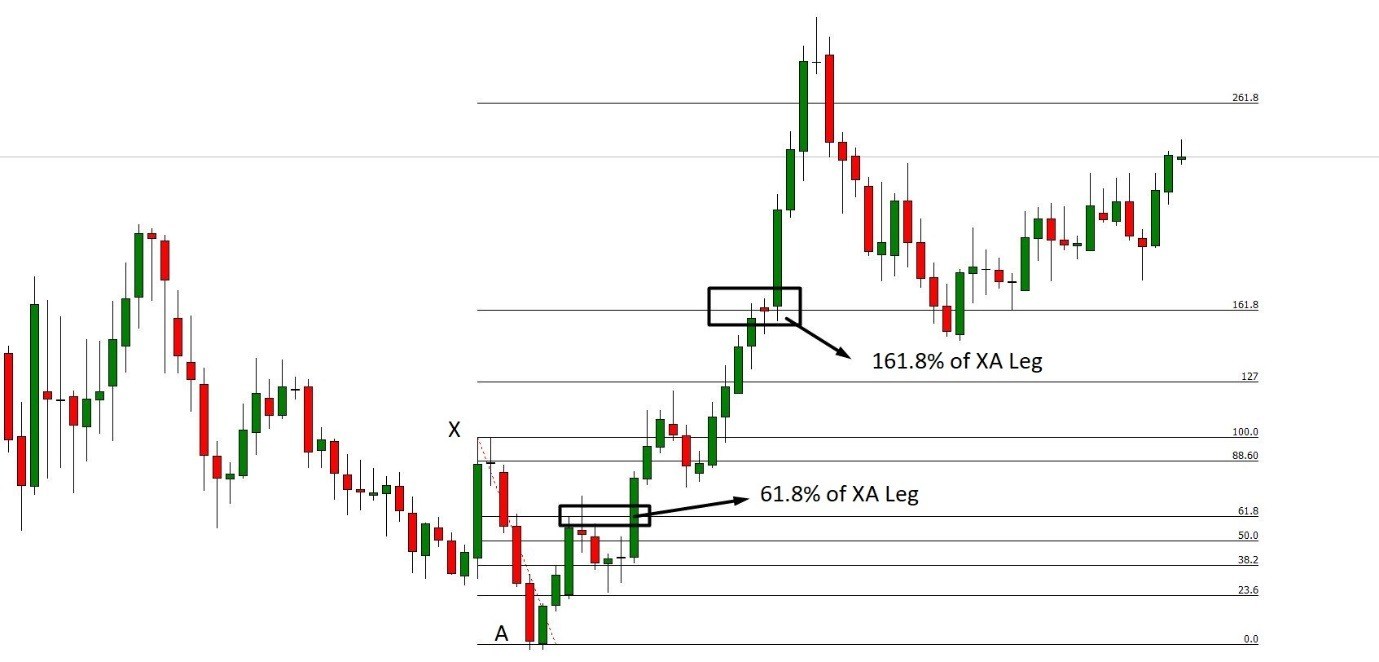
Furthermore, based on the market behaviour and momentum there are other Fibonacci levels like 23.6%, 38.2%, 50.0%, 88.6%, 127.0%, 261.8%, etc.
8. Average True Range
Average True Range indicates the volatility of a currency pair. In the forex market, measuring the volatility is very important as it is related to direct market movement.
In every financial market, the increase of volatility indicates the market reversal, and the decrease of volatility indicates the market continuation.
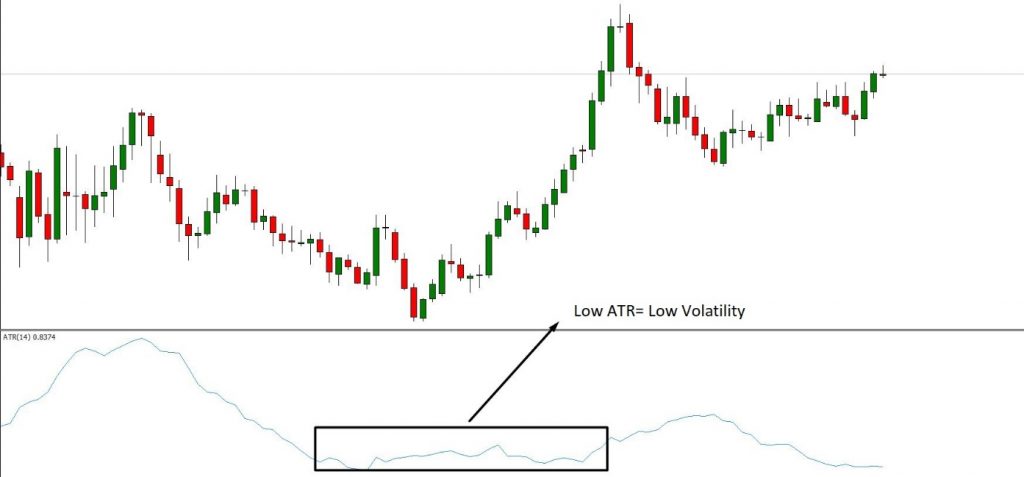
The lower Average True Range indicates the lower volatility and the higher ATR indicates the higher volatility. Therefore, if the volatility is low, you can extend your take profit. On the other hand, in the lower volatility, you can find reversal trade setups.
9. Parabolic SAR
Parabolic SAR indicates the market trend of a currency pair. If the price is above the Parabolic SAR, the overall trend is bullish. On the other hand, if the price is below the SAR, the overall trend is bearish.
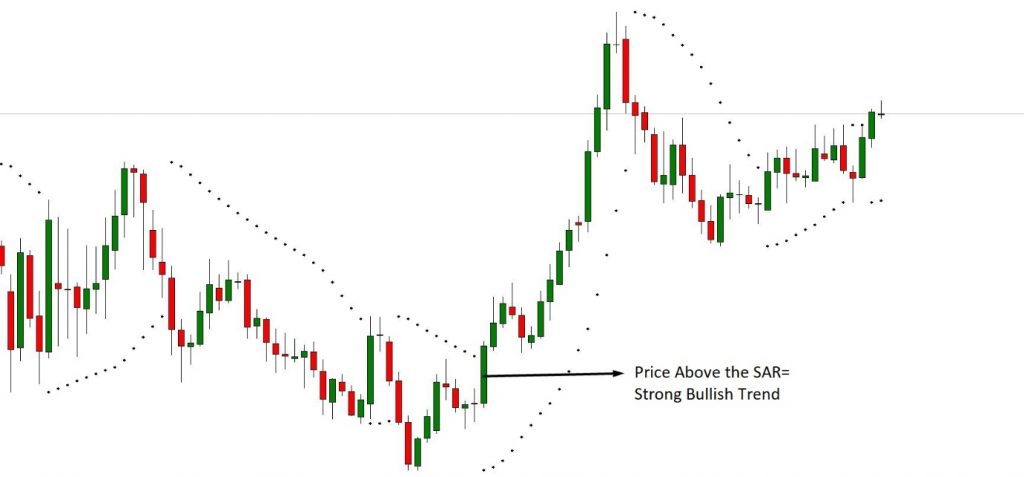
Traders use this indication to identify the trend. Furthermore, a market rejection from the Parabolic SAR indicator provides a potential entry point.
10. Pivot Point
Pivot point indicators the equilibrium level of supply and demand of a currency pair. If the price reaches the pivot point level, it indicates the supply and demand of the particular pair are the same.
If the price moves above the pivot point level, it indicates that the demand for a currency pair is high. However, if the price moves below the pivot point, the supply would be high.
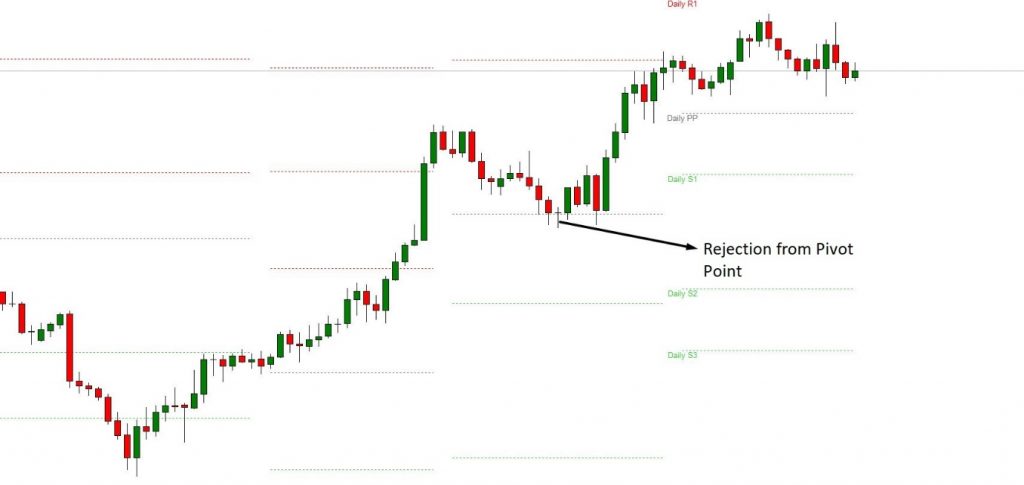
In the financial market, price tends to move at the equilibrium point before setting any direction. Therefore, this trading indicator provides a possible trading entry from the rejection of the pivot point.
Forex indicators are important trading tools that most traders should know. However, the effectiveness of a technical trading indicator depends on how you are utilizing it. Traders often use multiple indicators with different parameters to increase the probability of a market movement.
Happy Learning!


Thanks for this post now I can see the top forex indicators i’ve been missing all these years. So far I’ve downloaded ichimoku but it seems a life time to understand it with all the text book guides, keep up.
Very nice explanation of different indicators. I will embark on studying it every day
Hi,
We really appreciated that you liked our blog.
Keep Reading!
thanks for sharing, now i can understand
Hi,
We really appreciated that you liked our blog.
Keep Reading!
Your approach to teaching these indicators is so simple, straight forward and easy to understand. Thanks a lot.
Soji.
Hi,
We really appreciated that you liked our blog.
Keep Reading!
Great
Hi,
We really appreciated that you liked our blog! Thank you for your feedback!
Keep Reading!
Thank you for offering such valuable Information and surprisingly for Free. ⭐⭐⭐⭐⭐ You deserve extra 🌟