
Do you know Harmonic trading, unlike other more common trading methods, attempts to forecast future movements?
Harmonic price patterns take geometric price patterns to the next level by defining precise turning points with Fibonacci numbers.
The primary theory underlying harmonic patterns is based on price/time movements that follow Fibonacci ratio relationships and market symmetry. Fibonacci ratio analysis applies to any market and timeframe chart.
The fundamental idea behind using these ratios is to identify key turning points, retracements, and extensions, as well as a series of swing high and swing low points. The projections and retracements derived from these swing points (Highs and Lows) will provide key price levels for Targets and Stops.
So, in today’s blog, let us discuss Harmonic Patterns and different types of Harmonic Chart Patterns:
What are Harmonic Patterns?
Using Fibonacci sequences, harmonic patterns create geometric pattern structures (retracement and projection swings/legs). These specified (harmonic) patterns provide traders with unique opportunities, such as potential price movements and key turning or trend reversal points.
This factor gives traders an advantage because harmonic patterns attempt to provide highly trustworthy information on price entries, stops, and targets. This could be a key distinction between other indicators/oscillators and how they work.
Harmonic patterns are chart patterns that can help traders spot pricing trends by predicting future market movements. They are used as part of a trading strategy. They use Fibonacci numbers to create geometric price patterns in order to identify potential price changes or trend reversals.
Types of Harmonic Patterns
Let us different types of Harmonic Patterns:
1. The ABCD Pattern
The ABCD (or AB=CD) pattern, arguably the simplest of all, is made up of three movements and four points. The impulsive movement (AB) comes first, followed by a corrective movement (BC), and then another impulsive movement (DC) in the same direction as AB.
Using the Fibonacci retracement tool on the AB leg, the BC leg should reach 0.618 exactly. The CD line will be the same length as the AB line, and the time it takes for the price to move from A to B should be the same as the time it takes for the price to move from C to D.
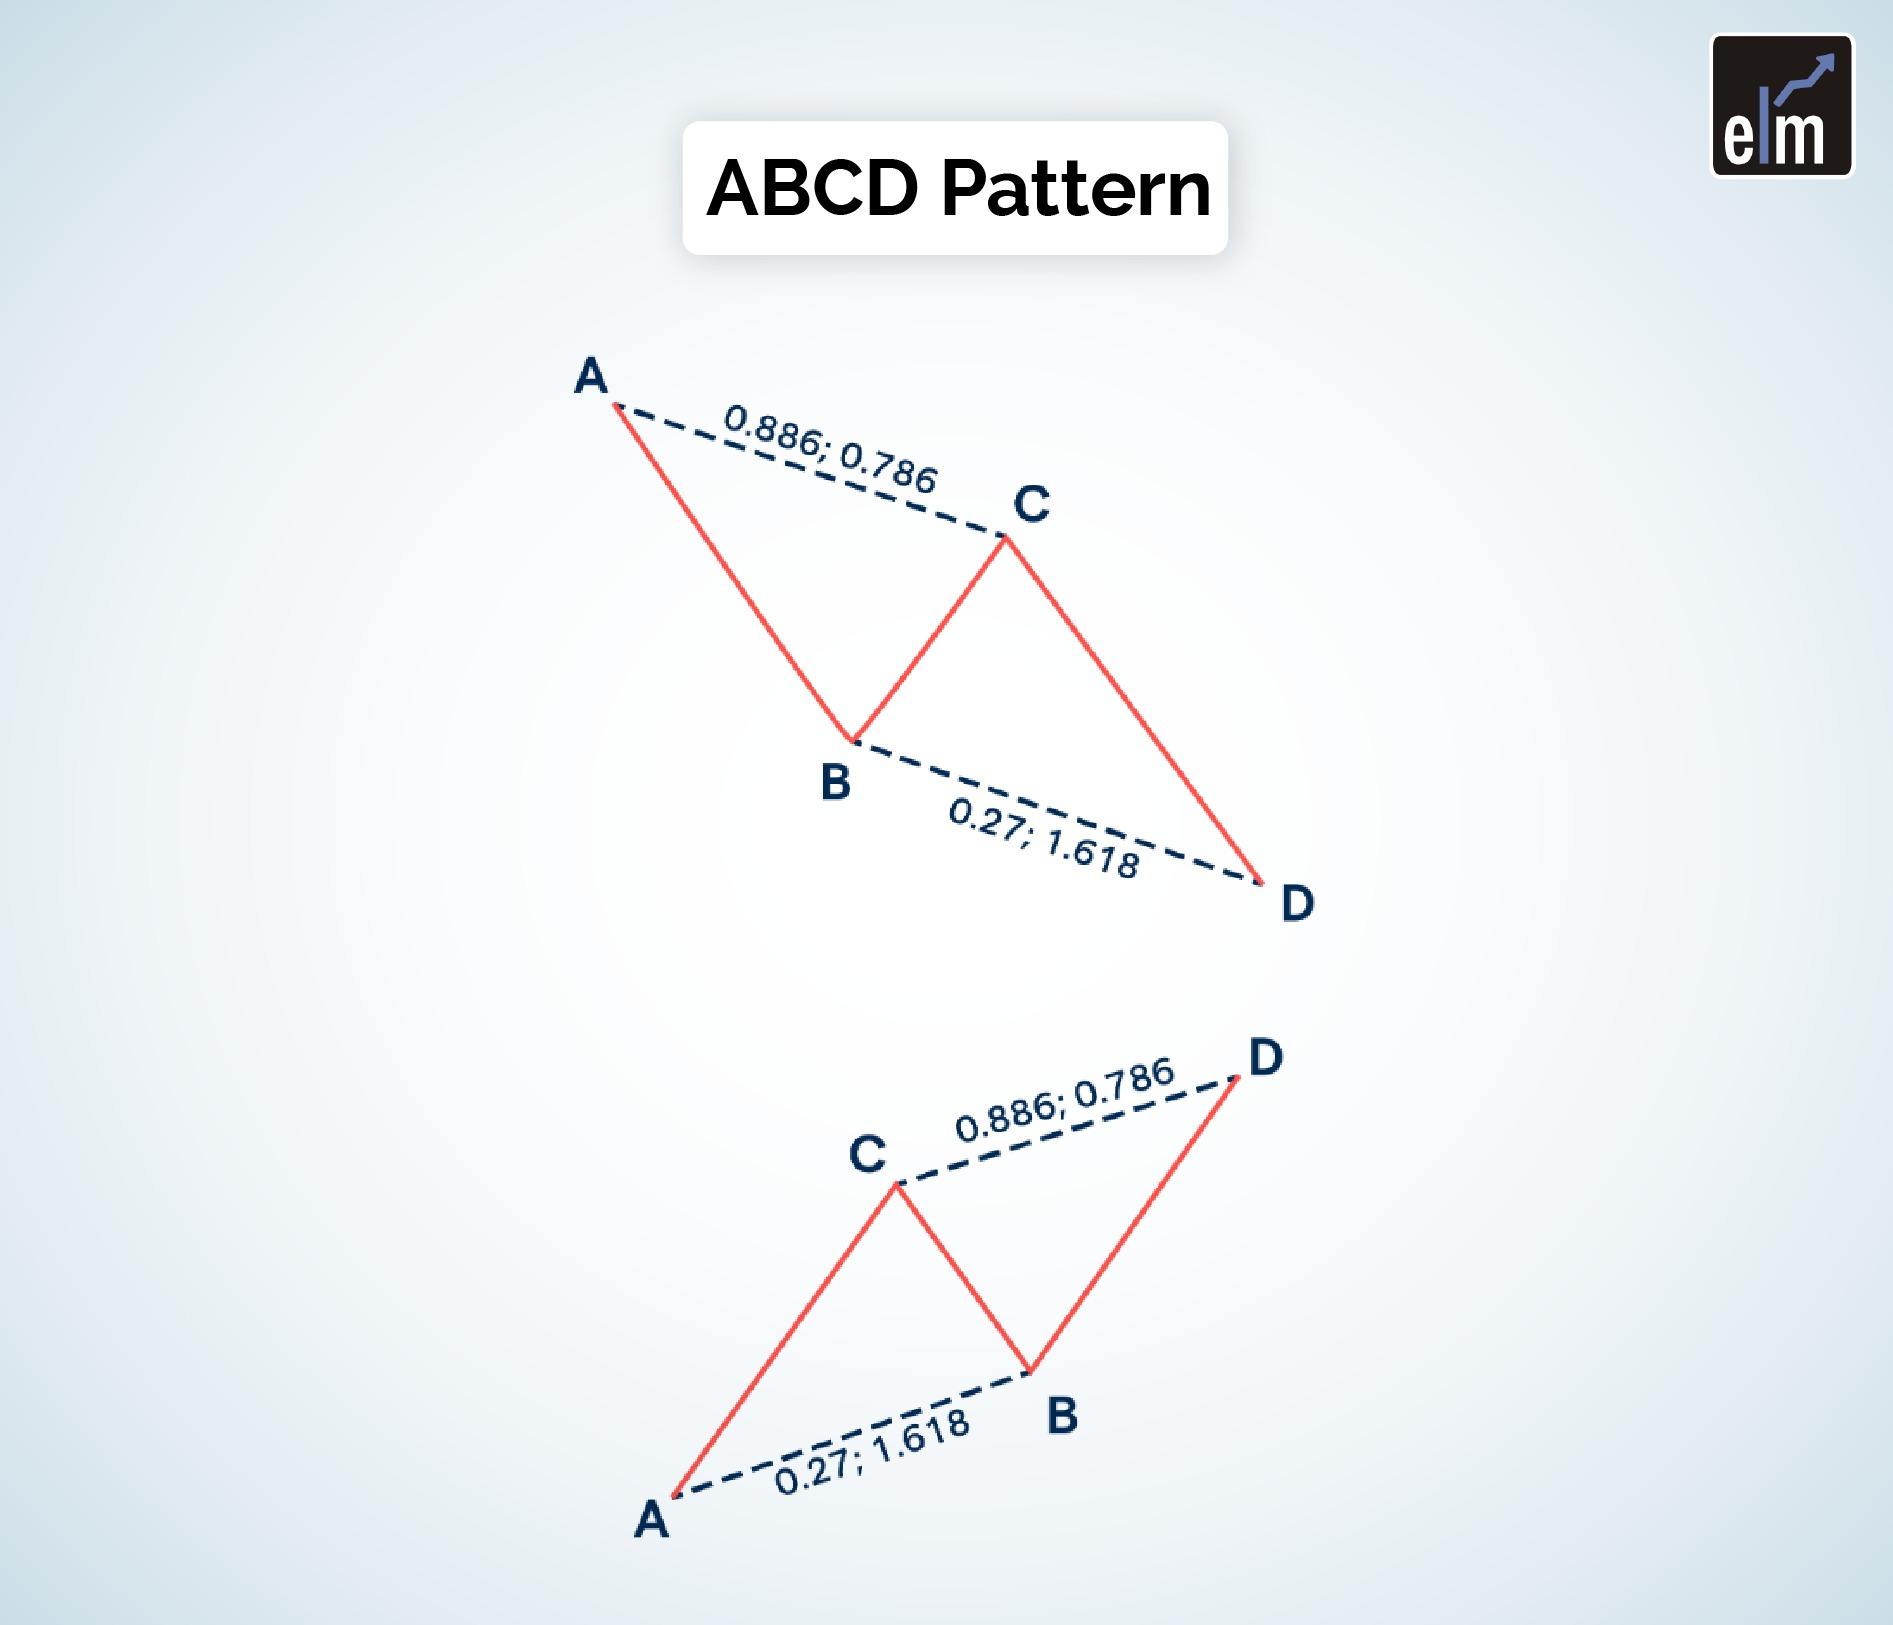
Traders can either place their entry orders near the C point, which is defined as the Potential Reversal Zone (PRZ), or they can wait until the entire pattern is completed before entering a long or short position from the D point.
2. The BAT Pattern
The BAT pattern is named after the bat-shaped finished product. The BAT pattern, discovered by Scott Carney in 2001, is composed of precise elements that identify PRZs.
It has one more leg than the ABCD pattern and one extra point called X. The first leg (XA) will result in a BC retracement. If the retracement to point B stops at 50% of the initial XA movement, you’re looking at a BAT pattern.
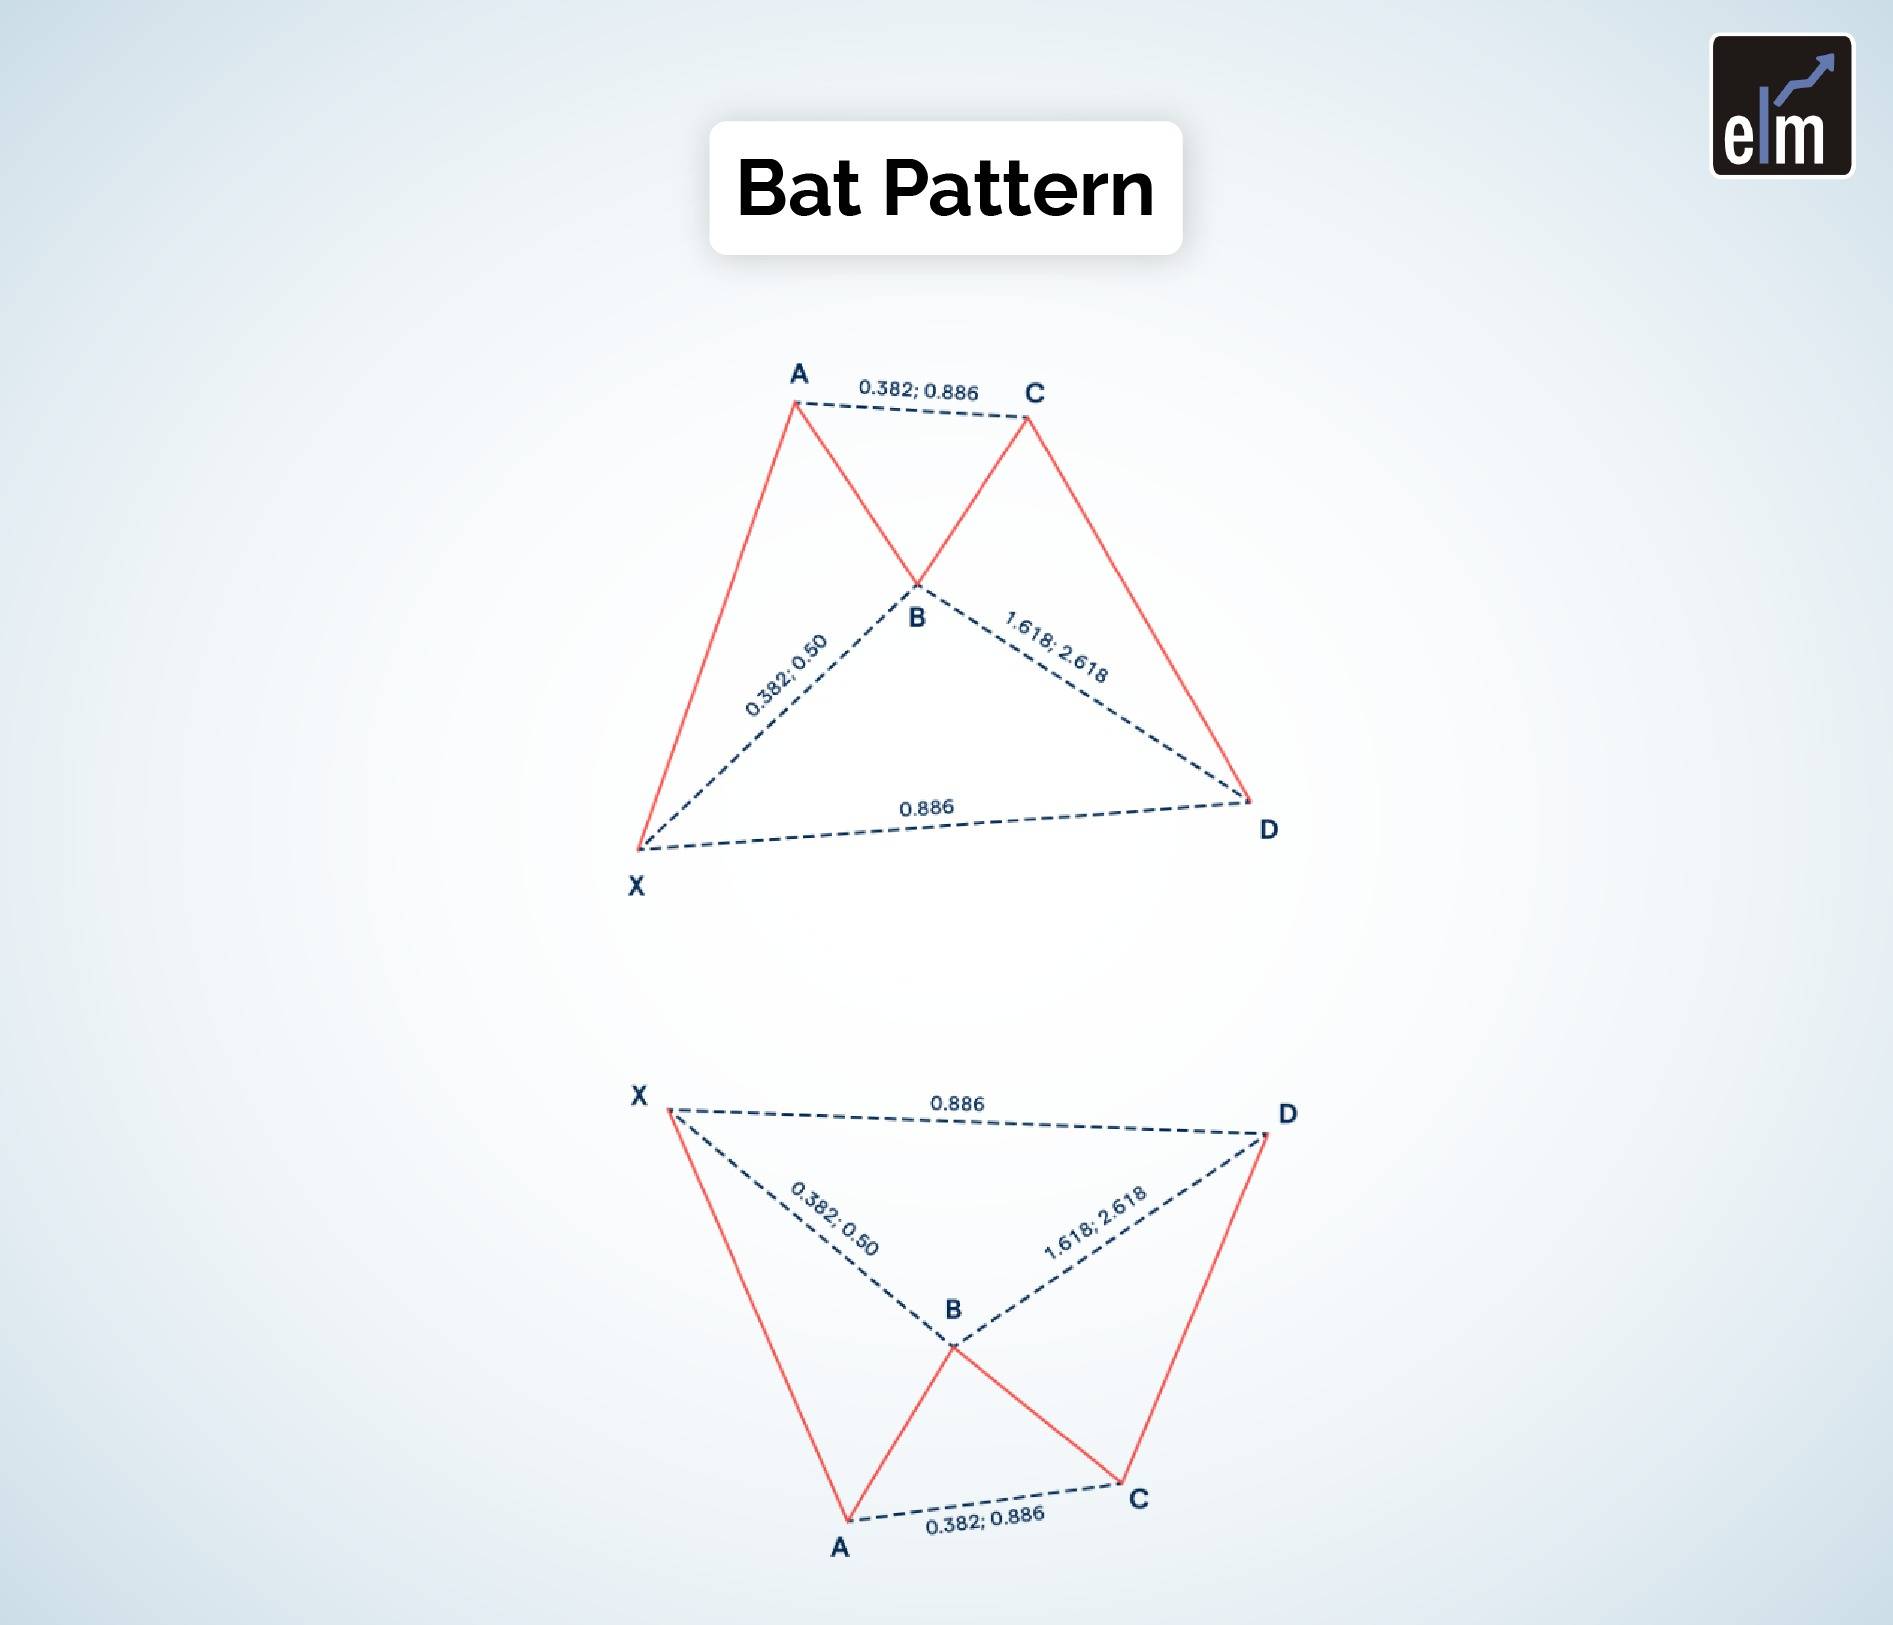
The CD extension must be at least 1.618 times the BC keg and can go up to 2.618 times. The CD extension cannot be less than the BC extension; otherwise, the figure is invalid. The PRZ is formed by the end point (D), which means that traders can open positions to trade either a bullish price reversal or a bearish price inversion.
3. The Gartley Pattern
The Gartley pattern, developed by HM Gartley, has two main rules:
- Point B’s retracement must be 0.618 of XA.
- Point D’s retracement must be 0.786 of the XA movement.
The XA leg leads to a BC retracement, similar to the BAT pattern, except that the retracement of point B must be exactly 0.618 of XA. The stop-loss point is frequently set at point X, while the take-profit point is frequently set at point C.
4. The Butterfly Pattern
Bryce Gilmore discovered the butterfly pattern by combining different Fibonacci ratios to identify potential retracements. It is a reversal pattern with four legs labeled X-A, A-B, B-C, and C-D.
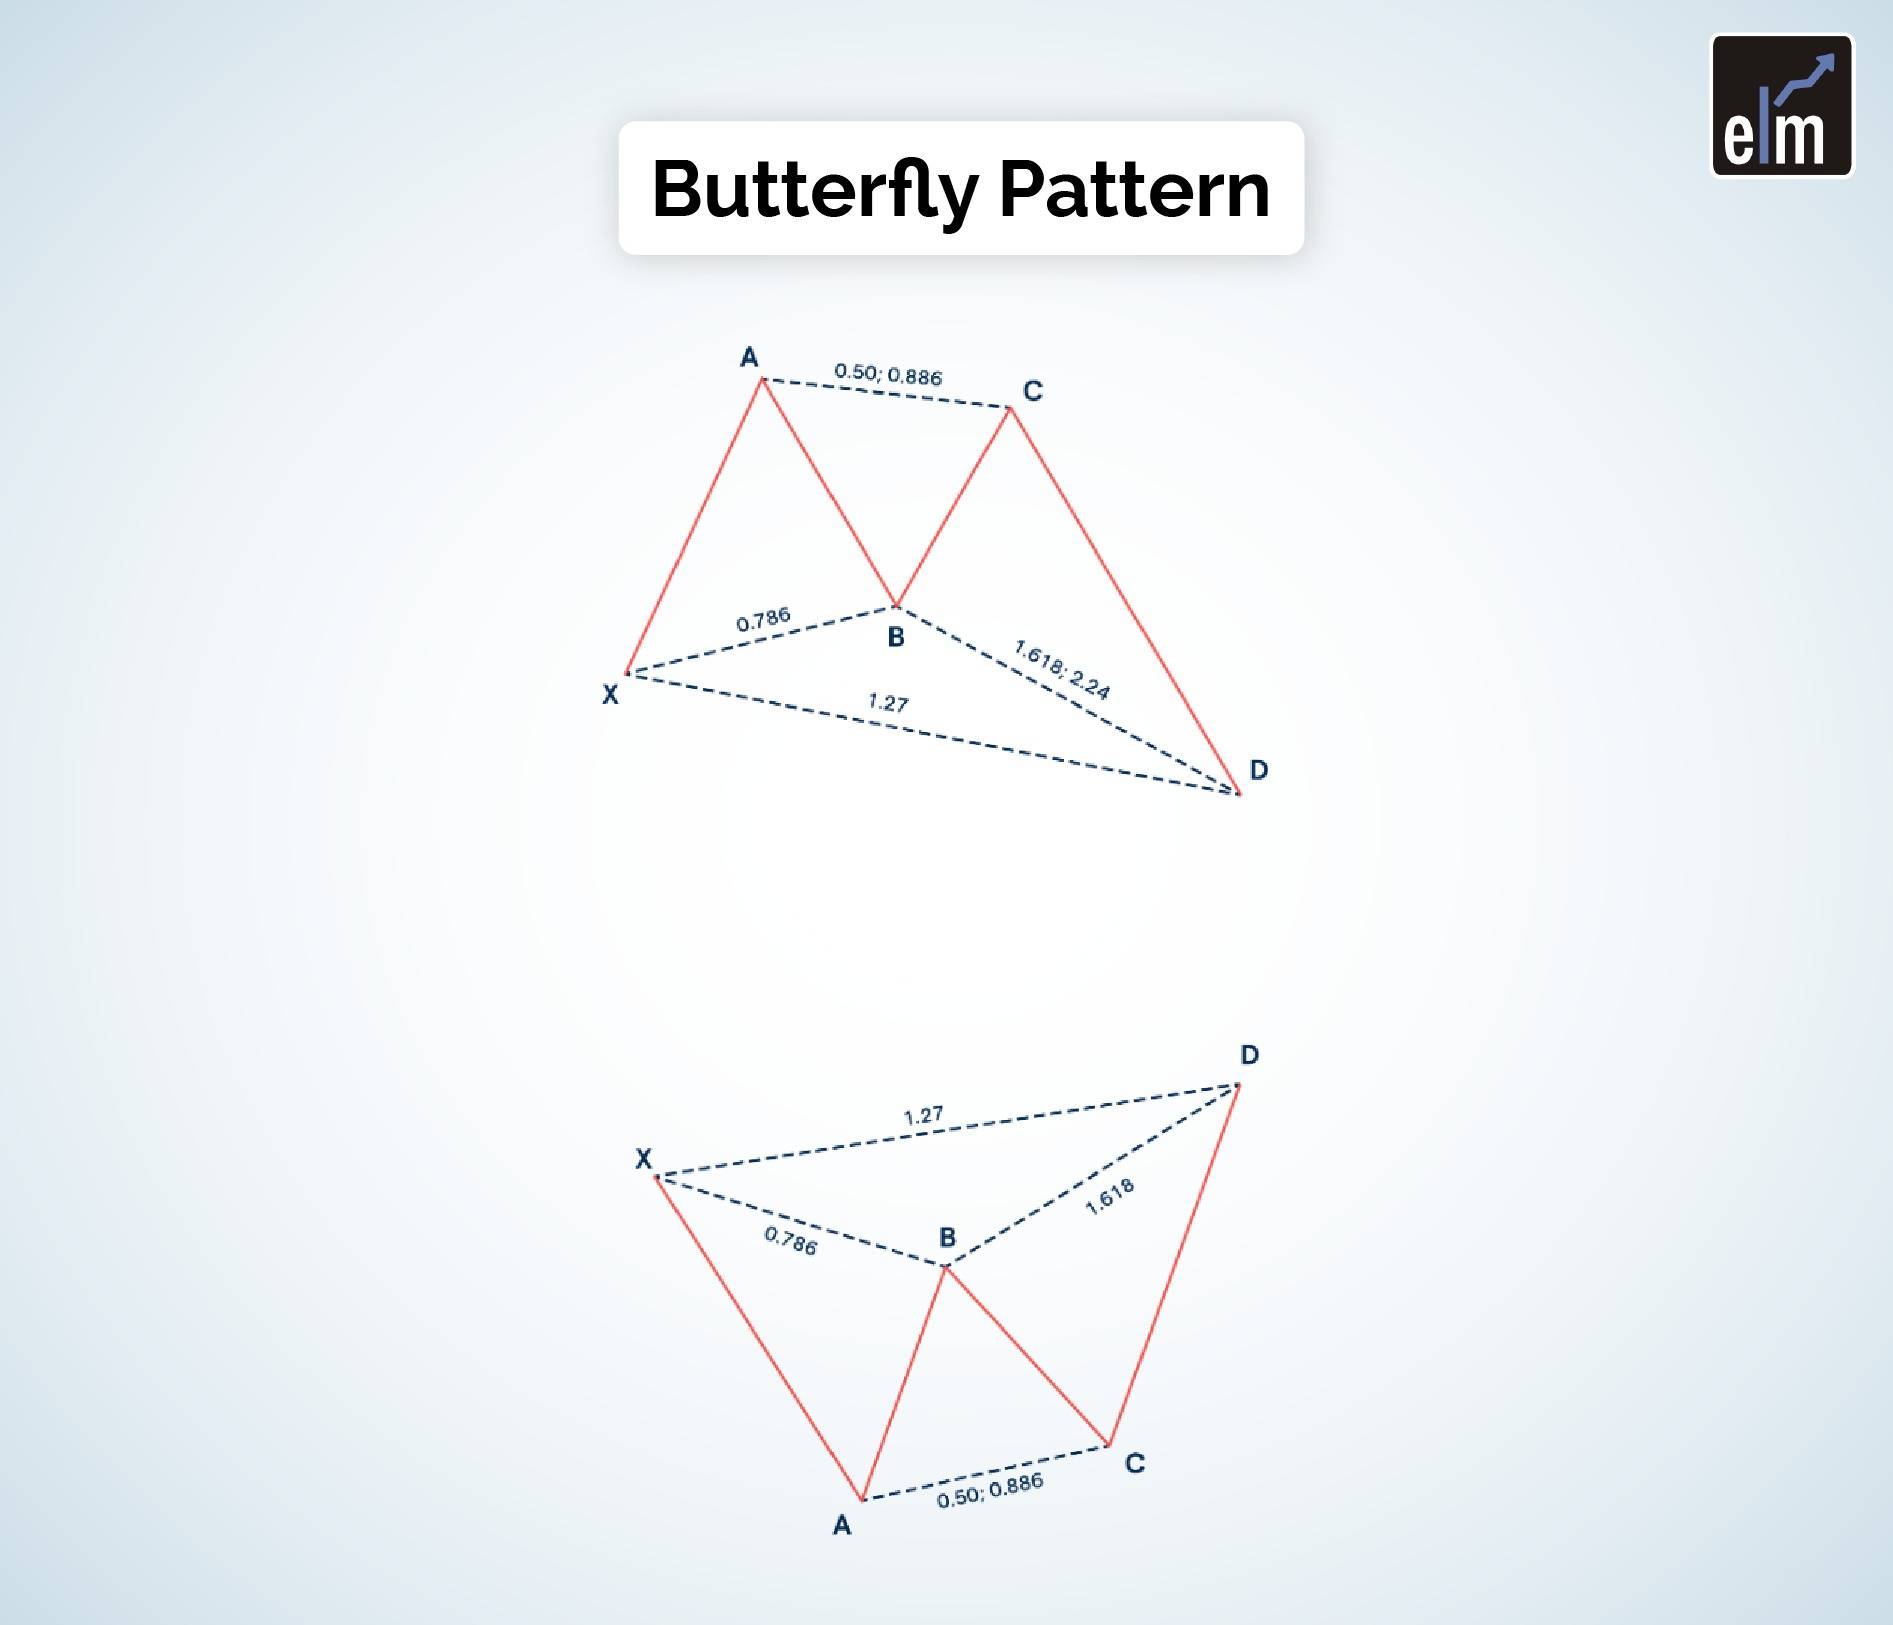
The 0.786 retracement of the XA leg is the most important ratio to define. This aids in the plotting of point B, which aids traders in identifying the PRZ.
5. The Crab Pattern
The Crab, yet another Scott Carney discovery, follow an X-A, A-B, B-C, and C-D pattern, allowing traders to enter the market at extreme highs or lows. The 1.618 extension of the XA movement that determines the PRZ is the most important feature of the crab pattern.
The first leg of the Crab in its bullish version forms when the price rises sharply from point X to point A. The AB leg retraces 38.2% to 61.8% of XA. This is followed by an extreme projection of BC (2.618 – 3.14 – 3.618), which identifies a valid area for pattern completion and potential trend reversal.
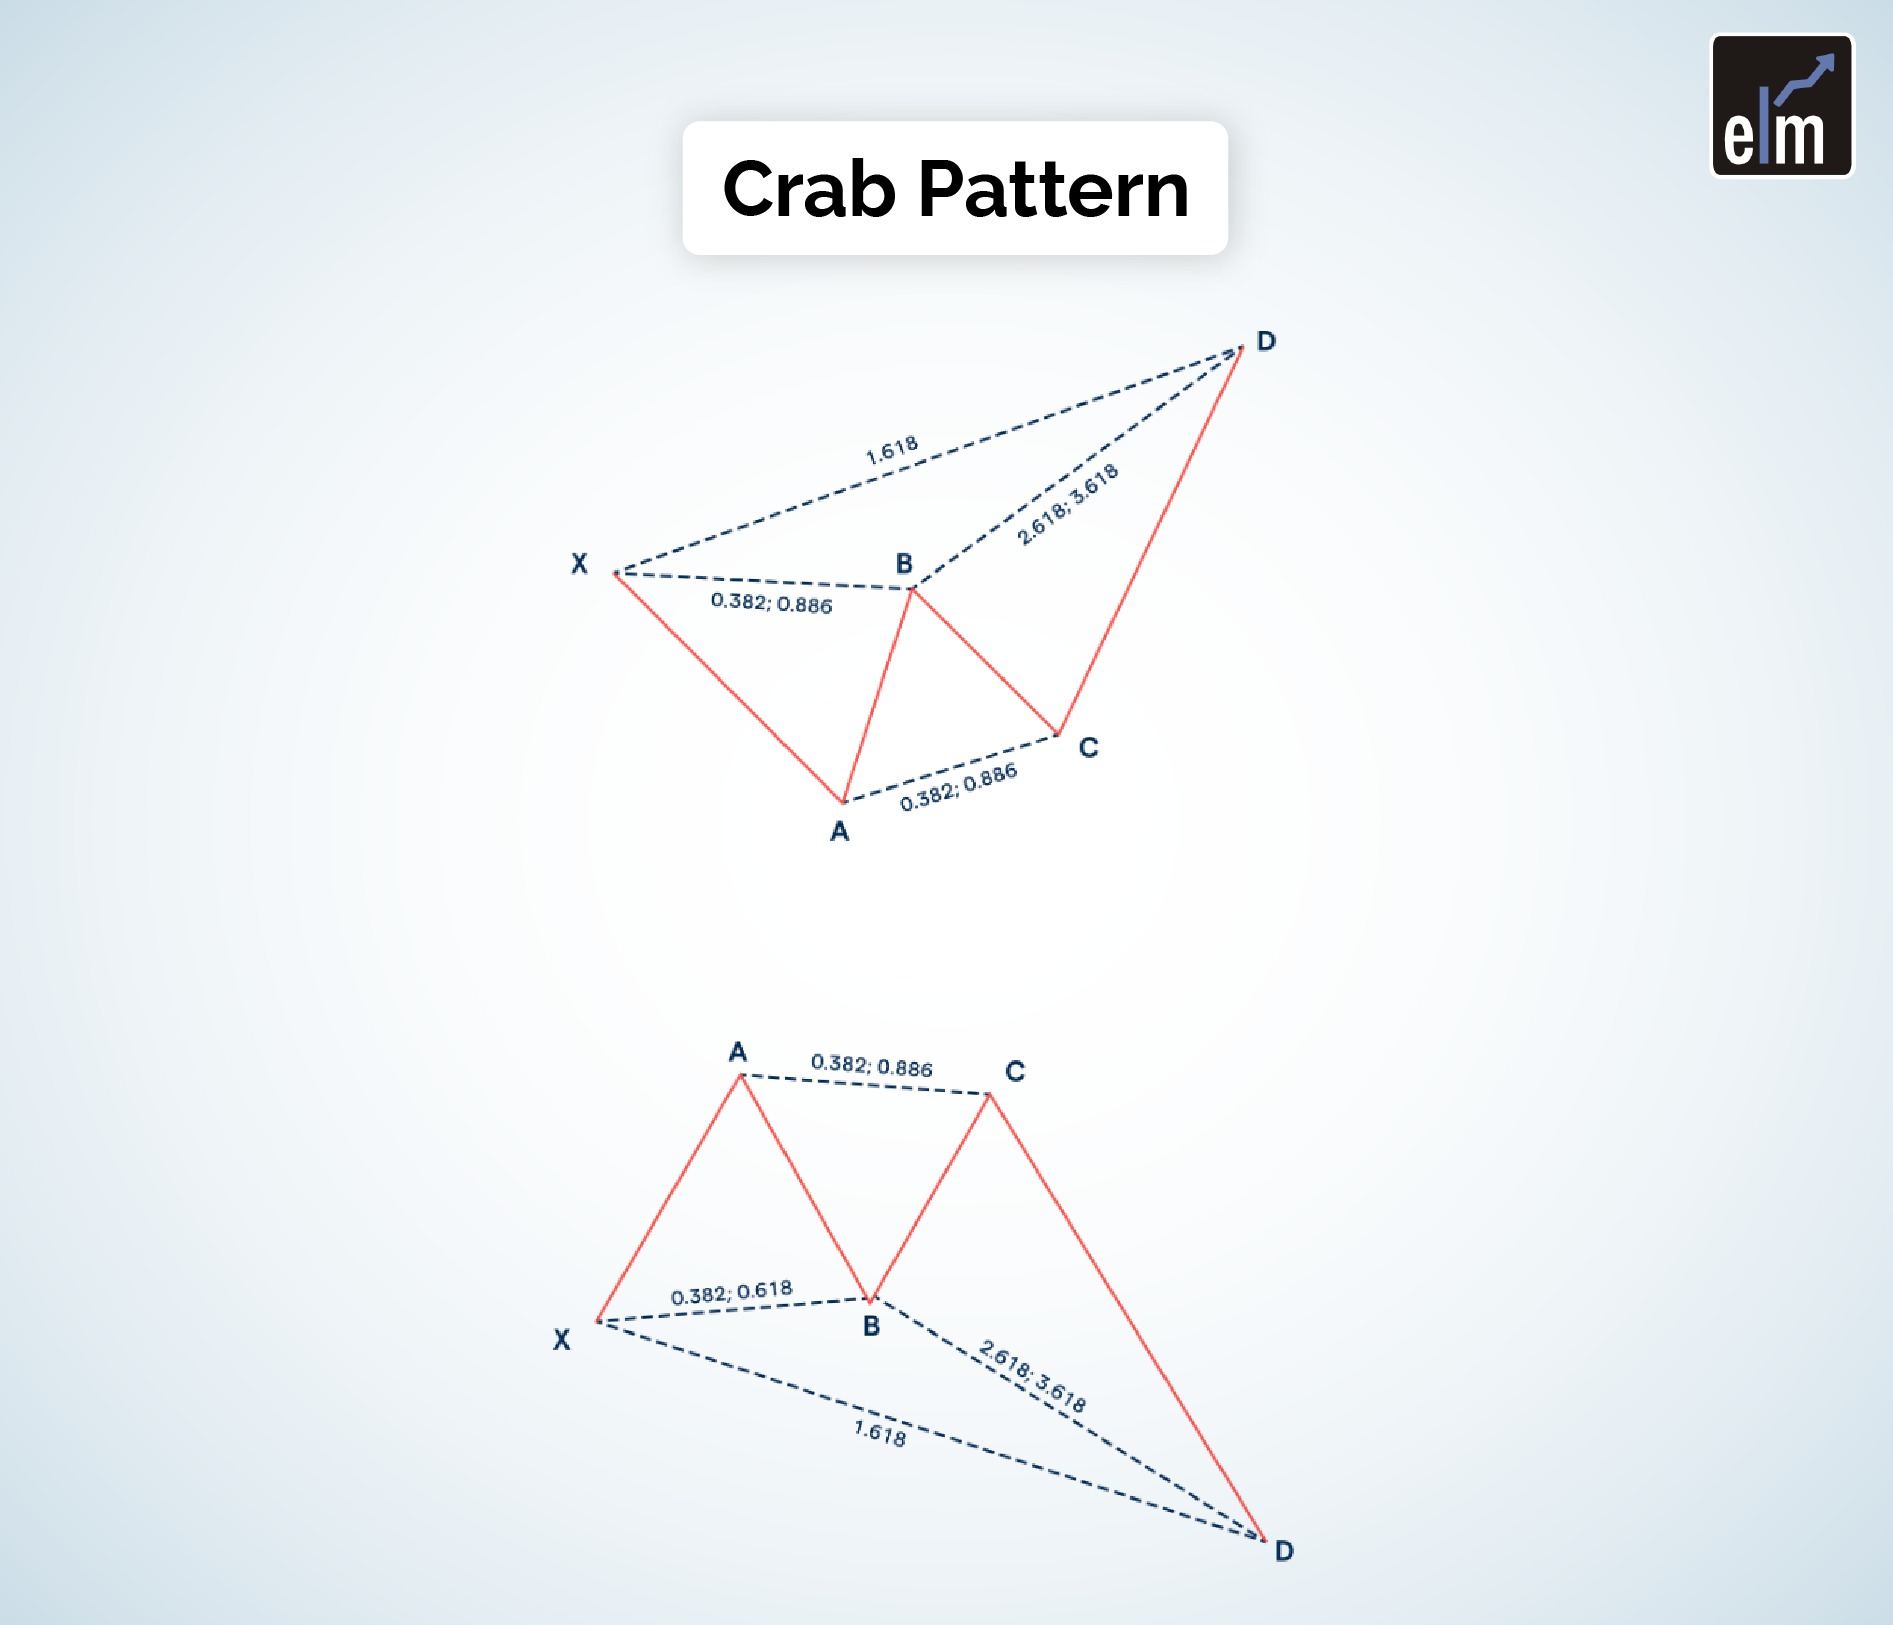
A bearish crab will follow a drop from point X to point A, then a modest price rise, a slight drop, and a sharp rise to point D.
You can also join our course Learn how to Trade with Harmonic Chart Patterns
Bottomline
Harmonic trading is a precise and mathematical way to trade, but mastering the patterns takes time, practice, and a lot of research. The fundamental measurements are only the beginning. Movements that do not line up with the correct pattern measurements invalidate the pattern and can lead traders astray.
The Gartley, butterfly, bat, and crab patterns are the most well-known patterns that traders look for. When price confirmation indicates a reversal, entries are made in the potential reversal zone, and stop losses are placed just below a long entry or above a short entry, or alternatively outside the pattern’s furthest projection. You can learn more about these patterns from our Harmonic pattern trading course.
Happy Investing!


