Hindi: आप इस लेख को हिंदी में भी पढ़ सकते है|
One day someone had told me that one cannot trade based on Support and Resistance levels.
But this is not true at all.
One can definitely trade using it.
Support is an area where the prices of any type of assets tend to stop falling.
Resistance is an area where the prices of any type of assets tend to stop rising.
But knowing just these definitions will not help you in your trading.
Traders need more information than these definitions for making trading decisions based on support and resistance.
| Table of Contents |
|---|
| Minor and Major Resistance and Support levels |
| By using Trend lines |
| Trading decisions based on new Support and Resistance levels |
| Key Takeaways |
In order to use it effectively, one needs to understand how does the prices move of a particular asset for interpreting support and resistance from this framework.
One should also need to know about the major and minor support and resistance levels.
The minor level can be broken whereas the strong one may stop the prices to move in the ongoing direction and cause reversals.
1. Minor and Major Resistance and Support levels:
Minor levels don’t hold the prices.
Suppose in the uptrend the price will be making higher high suddenly there will be a little pullback and then it will continue to make higher highs.
This pullback can be considered as the minor support area as the price bounced back from that area.
These areas of minor support and resistance provide opportunities for increasing your holding.
Major levels are those areas that create trend reversals.
When the prices are making higher highs and are in an uptrend, then reversed into a downtrend, the area at which the reversal took place can be considered as a major resistance level.
2. By using Trend lines:
You can also identify these levels by using trend lines.
In an uptrend, the prices make higher highs and higher lows whereas in the downtrend the prices make lower lows and lower highs.
To draw a trend line you need to connect the high and low.
Extend the trend line to see if there is a potentiality of prices to find support and resistance.
These trend lines provide visual flow whether the market is in a downtrend or uptrend and in the future what could happen.
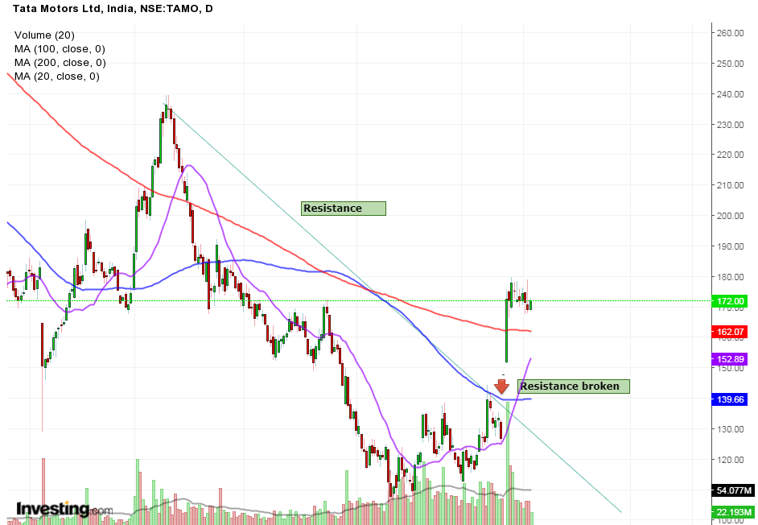
On the charts of Tata Motors, we have drawn a trendline from the high to the low point and also plotted 100 and 200 Moving Averages.
We can see how the trendline is forming a resistance to the prices and eventually the prices break from the trendline as well as the 100 moving average along with volume signaling reversal.
3. Trading decisions based on new Support and Resistance levels:
When the prices are in an uptrend, then the last low and the last high prices are very important.
If the prices start making a lower low, then it indicates trend reversal may take place.
But if the prices continue to make higher highs then the uptrend is confirmed.
Also Read: Applying Mental Models to understand Support and Resistance
One should mark the relevant and current major support and resistance levels as they may become important when the prices approach that level.
Also one should mark the relevant and current minor support and resistance levels which will help you in analysing the current trends, chart patterns, and ranges.
You should keep drawing new support and resistance level and delete the old support and resistance levels which are no longer important as the prices have already broken through them.
4. False Breakouts:
False breakouts provide excellent trading opportunities.
One strategy is to wait for a false breakout, and then enter the market after it occurs.
For example, if the trend is up, and the price is pulling back to support, then let the price break below support and buy when the price starts to rally back above support.
Similarly, if the trend is down, and the price is pulling back to resistance, then let the price break above resistance and sell when the price starts to drop below resistance.
5. Adapting Trading Decisions to New Support and Resistance Levels
One should mark major support and resistance levels on the chart, as they could become important if the price approaches those areas.
Then delete them once they are no longer relevant—for example if the price breaks through strong support or resistance and continues to move well beyond it.
You can also mark the current and relevant minor support and resistance levels on your chart.
As these will help in analyzing the current trends, ranges, and chart patterns.
These minor levels lose their importance quite quickly as new minor support and resistance areas form.
One should keep drawing the new support and resistance areas, and delete support and resistance lines that are no longer relevant because the price has broken through them.
Key Takeaways:
- Minor Resistance and support levels don’t hold the prices.
- These areas of minor one provide opportunities for increasing your holding.
- Major levels are those areas which cause trend reversals.
- The trend lines provide visual flow whether the market is in downtrend or uptrend and in the future what could happen.
- One should mark the relevant and current major levels as they may become important when the prices approach that level.
- One should also mark the relevant and current minor levels which will help you in analyzing the current trends, chart patterns and ranges.
Happy Learning!
In order to get the latest updates on Financial Markets visit https://stockedge.com/


I think other web-site proprietors should take this website as an model, very clean and wonderful user genial style and design, as well as the content. You’re an expert in this topic!
This web site is really a walk-through for all of the info you wanted about this and didn’t know who to ask. Glimpse here, and you’ll definitely discover it.