The Ichimoku cloud indicator looks complex when we first apply it to our technical charts as it has too many components.
But when you understand its components and how to use this indicator then Ichimoku cloud is very helpful to identify resistance, supports, and trends.
The Ichimoku Cloud indicator is a technical indicator that tells you everything about the price trends like momentum, direction, volatility, support, resistance, and potential reversals.
So this indicator can be termed as an “All in one” indicator.
Ichimoku cloud indicator was released in the book published by Goichi Hasoda, a Japanese journalist.
What does the Ichimoku cloud indicator tells you?
This indicator tells us relevant information about the price movement of the stock at a glance.
When the price is above the cloud then the overall trend is bullish and when the price is below the cloud then the overall trend is bearish.
When Leading Span A is above Leading Span B and rising, then it confirms the uptrend and space between the lines are green.
Similarly, when Leading Span A below Leading Span B and falling, it confirms the downtrend and space between the lines in red.
Traders will often use the Cloud to find the levels of support and resistance.
The support and resistance levels can be projected into the future by using this indicator.
Components of Ichimoku cloud Indicator:
This indicator consists of five components, each of them stating information about price actions.
Let us first discuss the components of the Ichimoku cloud indicator:
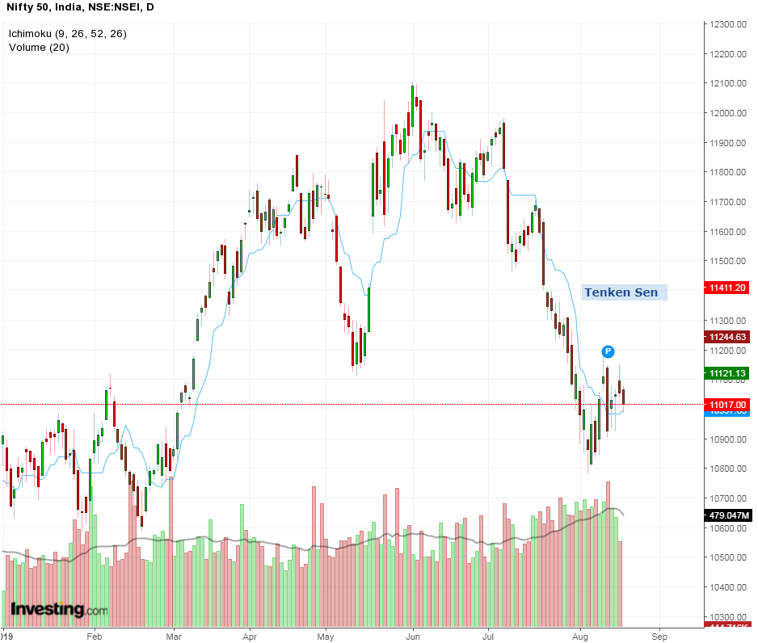
1. Tenken Sen
This is 9 days moving average line which shows the middle value of the highest and lowest points on the charts of the last 9 days.
This is a leading indicator and moves rapidly with the increase or decrease in the price.
This is the first line of support when the prices move in an uptrend and the first line of resistance when the prices move in a downtrend.
The formula for calculating this line is:
[(9-period high + 9-period low)/2].
When the prices are above tenken then the trend is bullish and when the prices are below then the trend is bearish.
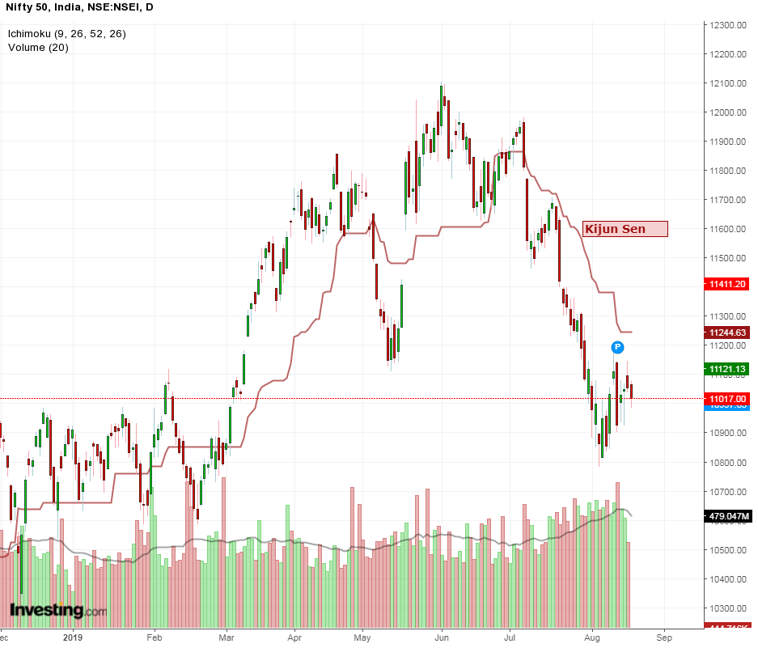
2. Kijun Sen
This is 26 days moving average line which shows the middle value of the highest and lowest points on the charts of the last 26 days.
Also Read – Moving Average – an essential technical tool for traders to buy stocks
As this line moves slower than tenken due to a larger number of periods, we can see the flatness in some areas. This flatness can be considered as support and resistance for the prices.
This is also a critical level of support in uptrend and resistance in a downtrend.
If the prices and tenken are above kijun sen then we can say the prices are in an uptrend and if the prices and tenken is below kijun sen then we can say the prices are in a downtrend.
When kijun is flat then it indicates that the market is in consolidation and attracts the prices towards it like a magnet.
As both tenken sen and kijun sen are moving averages, the bullish crossover occurs when tenken sen cuts kijun sen from below and bearish crossover occurs when then tenken sen cuts kijun sen from above.
The formula for calculating this line is:
[(26-period high + 26-period low)/2].
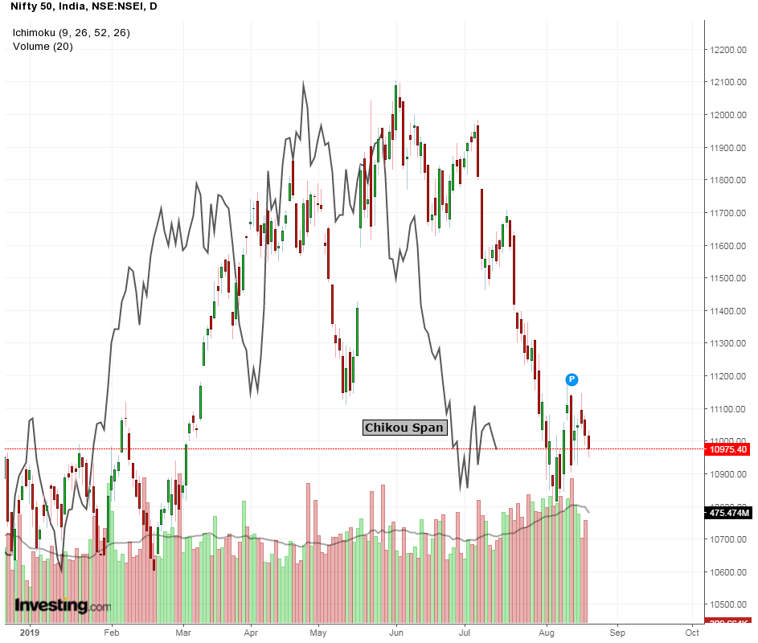
3. Chikou Span
Chikou span is a lagging indicator and it plots the closing price 26 periods back.
Learn to analyse Ichimoku with Ichimoku – One look Equilibrium Chart in just 2 hours by Market Experts
While trading one should know to see that the chikou span is not facing any obstruction of candlesticks or kumo clouds and it is free to move in any direction either uptrend or downtrend.
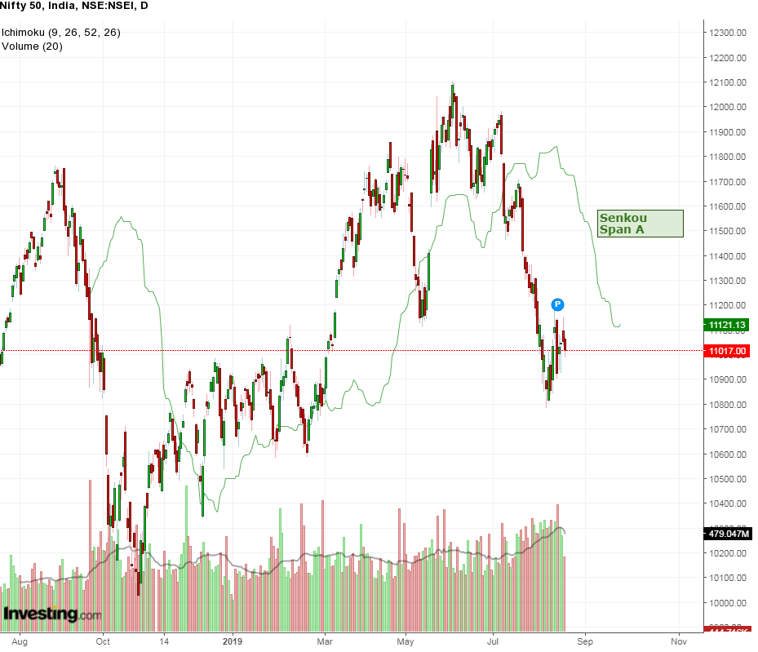
4. Senkou Span A
It is a leading indicator that is plotted 26 periods ahead.
It is calculated from the last 26 periods by taking the midpoint of tenken and kijun.
This indicator is mostly slanting along with the prices and it does not remain flat as it takes a small period in its calculation.
Senkou Span A forms the first part of Kumo cloud. If prices are above this, then it acts as a support and when the prices are below the prices then it acts as the resistance.
It is calculated as:
[(Tenken Sen + Kijun Sen)/2]
5. Senkou Span B
This indicator is calculated by taking the midpoint of the last 56 periods.
As it takes a long period for calculation it is flat for most of the time can be taken as the line of support when the prices are above it and can be taken as the line of resistance when the prices are below it.
This is the second part of the Kumo cloud.
It is calculated as:
[(52-period high + 52-period low)/2]
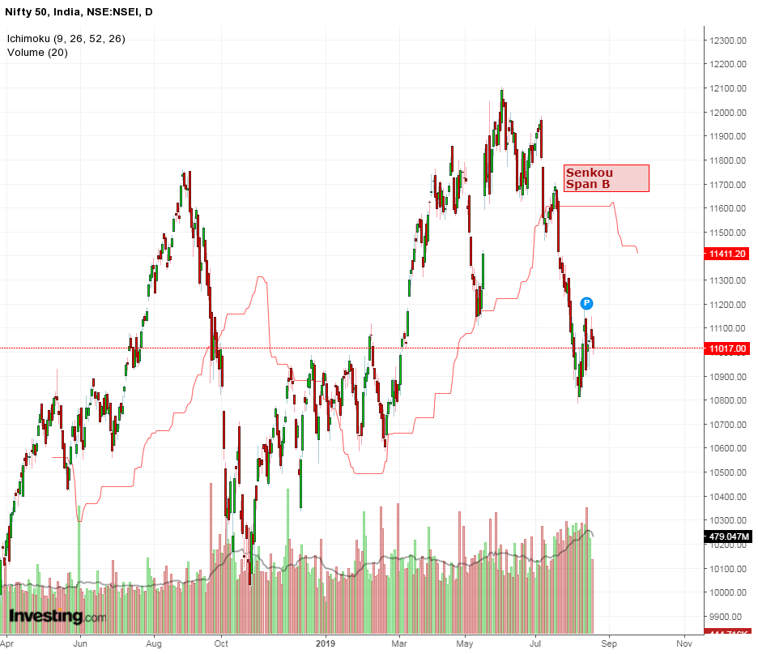
Senkou Span B
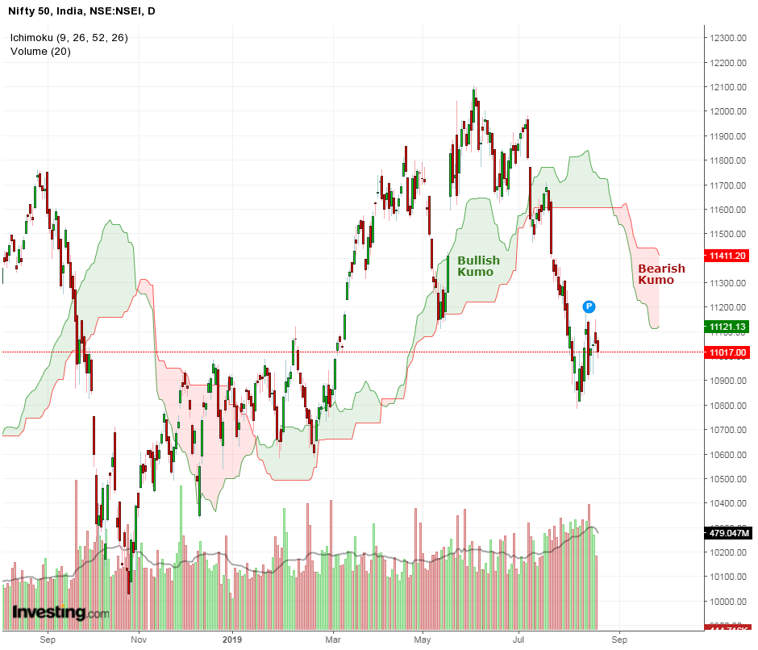
6. The Cloud (KUMO)
Kumo is the Japanese name for the cloud and it is the region between Senkou A and Senkou B.
If Senkou A is above Senkou B then it is bullish kumo and If Senkou A is below Senkou B then it is a bearish kumo.
When we combine all the indicators above then we get Ichimoku cloud indicator as seen in the chart below, each indicator telling us some information about the price movement as discussed above.
Trading Strategies using ichimoku indicator:
Now that we know about each and every component of Ichimoku cloud, let us discuss some bullish and bearish strategies using this indicator:
Bullish Trading Strategy:
For determining if the prices are in an uptrend, there are certain Ichimoku cloud indicator criteria one should follow:
Criteria for uptrend:
Prices should be above Tenken and Tenkun should be above kijun.
Both Tenken and Kijun should be moving upwards along with the prices.
Kijun should be not too far from the price.
Future Kumo should be bullish
Prices should be above kumo.
Example:
Let us take an example of how to trade a stock when it is in an uptrend using ichimoku cloud indicator:
Let’s discuss how could we have traded the uptrend in the monthly chart of Maruti Suzuki ltd for the long term.
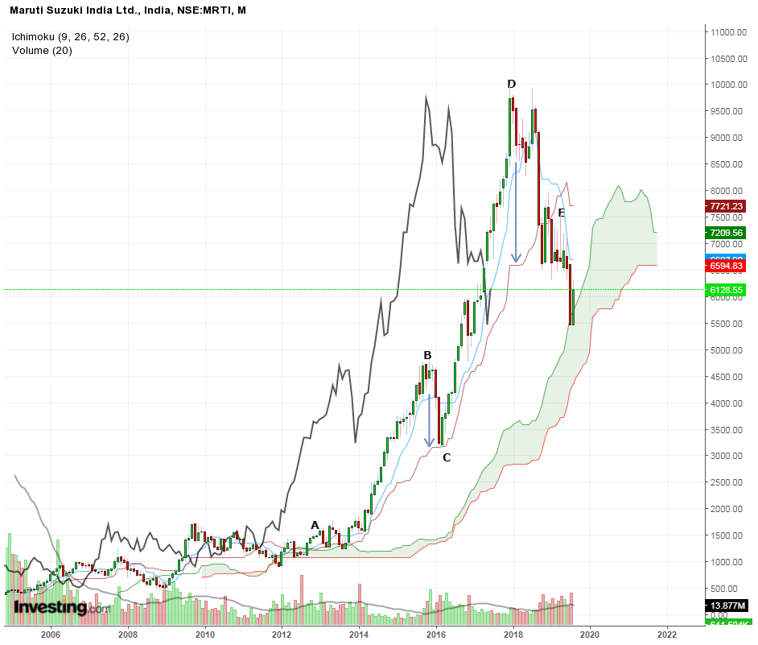
We can see in the chart that till point A, the prices were in the consolidated zone and there was also no specific order of Tenken and Kijun so we should avoid this zone for trading.
At point A, Tenken emerges out of the cluster, the prices start moving above it, Kijun goes below Tenken.
We can also see that there is no obstruction of price bars or kumo clouds for the Chikou to move up.
There is also a future Bullish Kumo cloud.
As all the uptrend criteria are met, we can expect the price to move uptrend from the consolidated zone.
Then at point B, we see that there is a huge gap between the prices and Kijun.
Kijun also remains flat and can attract prices towards it. So we should be cautious at this point.
At point C, we can see how prices have fallen towards Kijun and taken support there.
Here the Kijun Sen acted as the line of support and price didn’t break kijun, so we should continue holding our position.
The prices again reversed from the little fall and continued moving upward which was indicated by the future bullish kumo cloud.
The prices kept moving upwards, with tenken below it and kijun below tenken, chikou having no obstruction and the future kumo continued to be bullish till the point D.
At point D, we can again see a huge gap between the prices and Kijun Sen.
So it’s time to be cautious again.
Kijun Sen attracted prices towards it and eventually, the prices break this line.
At point E, there is a bearish crossover, when kijun sen overtakes tenken sen from below.
It’s better to close our buy position at this point as the chikou also starts moving down and eventually may face obstructions from the price bars.
Bearish Trading Strategy:
For determining if the prices are in a downtrend, there are certain Ichimoku cloud indicator criteria one should follow:
Criteria for downtrend:
Prices should be below Tenken and Tenkun should be below kijun.
Both Tenken and Kijun should be moving downwards along with the prices.
Kijun should be not too far from the price.
Future Kumo should be bearish
Prices should be below kumo.
Example:
Let us take an example of how to trade a stock when it is in a downtrend using ichimoku cloud:
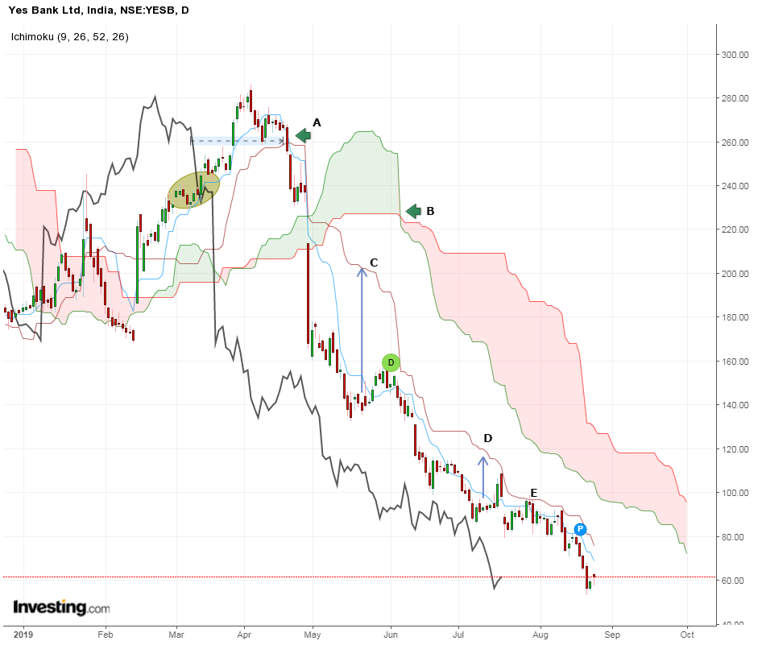
From the above chart of Yes bank, the ichimoku cloud indicator made so clear that the stock is still in a downtrend
Whereas the investors kept buying this stock at different levels hoping for the prices to bounce back.
Let us discuss in detail:
The stock price started declining from point A when the Tenken Sen cut Kijun Sen from above indicating a bearish reversal.
We can also see that chikou may face obstruction from the price bars below it as marked in the chart which indicates that the prices may range bound.
At point B, we can see Kumo cloud turning bearish due to the gap down opening and big red candlestick chart pattern indicating more downside.
Chikou also has no obstruction and it is free to fall.
The downside continues and at the point C we can see that the gap between Kijun Sen and the price bar has increased which means that the prices can move up towards Kijun
Prices did move up but it did not break the resistance of Kijun Sen and it bounced back the resistance and continued to fall down.
If the prices had broken the resistance of Kijun Sen then we could have expected a bullish reversal.
Again at point D, we can see how a gap was formed between kijun sen and prices and it again did not break the resistance of kijun sen and continued to fall down.
The situation is the same also at point E and still it the prices continued to fall down.
This is how Ichimoku cloud indicated that the stock is still in a downtrend and one should not buy the stock unless it shows some kind of bullish reversal.
Limitations of Using the Ichimoku Cloud :
Below are some limitations of Using the Ichimoku Cloud indicator:
- As this indicator has too many components, it becomes difficult for the trader to analyze the stock.
- It is based on the historic data whereas the two of the data points are plotted in the future.
- As the price remain above and below the cloud for a long time, the cloud may become irrelevant for a longer period of time.
Should Newbie Traders us the Ichimoku Cloud?
As a newbie, this indicator is difficult a bit. Thus they should avoid using ichimoku cloud indicator.
They could start with candlesticks and one or two indicators as it will be difficult for them to understand all of the rules and setups required for trading with Ichimoku cloud indicator.
As a new trader, you should first understand the market volatility and basic chart pattern.
You can also use technical scans to filter out stocks for trading the next day by using StockEdge App, now also available in the web version.
Key Takeaways:
- The ichimoku cloud indicator consists of five components, each of them stating information about price actions.
- One should understand each component of it and then trade.
- When the prices are above tenken then the trend is bullish and when the prices are below then the trend is bearish.
- If the prices and tenken is above kijun sen then it indicates that the prices are in uptrend and if the prices and tenken is below kijun sen then it indicates that the prices are in downtrend.
- While trading one should know see that the chikou span is not facing any obstruction of candlesticks or kumo clouds and it is free to move in any direction uptrend or downtrend.
- If Senkou A is above Senkou B then it is bullish kumo and If Senkou A is below Senkou B then it is a bearish kumo.
Tell us if you found this price pattern interesting by commenting below.
Happy Learning!


Super instructions to understand with graph! Best wishes!
Hi,
We are glad that you liked our blog post.
Thank you for Reading!
Superb information.
Thanks
Hi,
Thank you for Reading!
Keep Reading!
Yes, simple explanation of a complex trading system.
Hi,
We are glad that you liked our post, you can read more blogs on Technical Analysis from here.
Thank you for Reading!
Very clear and simple. Looking at the ichimoku chart it appeared very complicated, but the way it is explained, it sounded easy. Should apply and see. Thank you.
Hi,
We are glad that you liked our post.
Thank you for Reading!