
Traders constantly look for where big money is trading to find a low-risk, high-probability trade entry. One technical indicator that gives us an edge in the stock market and futures trading is the volume profile.
A volume profile is a horizontal graph depicting the volume traded at a specific price over a specified period. What distinguishes this from a traditional horizontal volume profile at the bottom of your chart?
So, In today’s blog, let us discuss volume profile and how to trade with this volume indicator:
What is Volume Profile?
A volume profile is a horizontal graph depicting the volume traded at a specific price over a specified period. What distinguishes this from a traditional horizontal volume profile at the bottom of your chart?
Here’s a comparison of the volume profile to the more traditional horizontal volume tool.
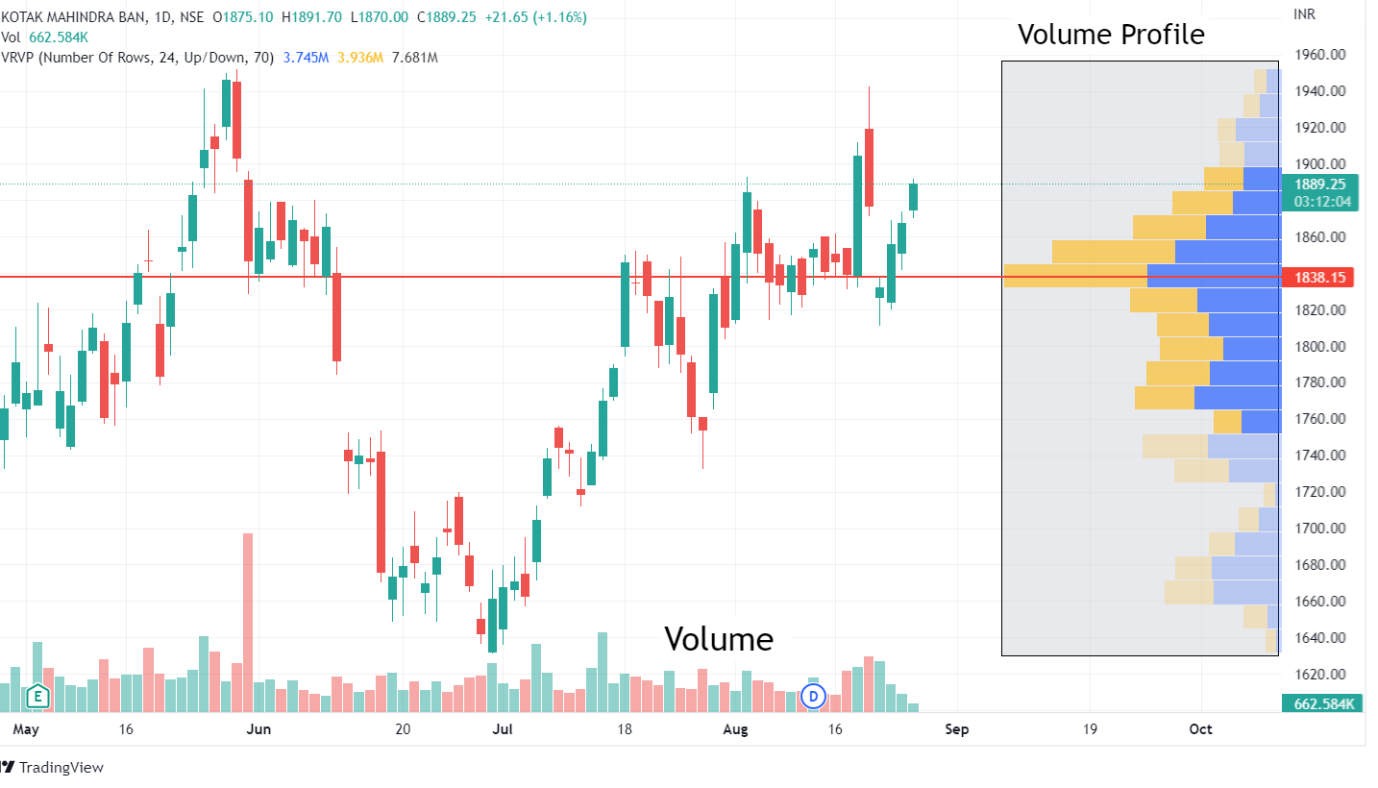
The benefit of using this volume indicator is that it allows you to see how many trades occurred at each price point for each trading day.
Volume on a time frame is meaningless because it only tells you the buying or selling intensity within the current candle. Traditional horizontal volume is ineffective for trade entry. A volume profile is a vertical breakdown of how many shares are available.
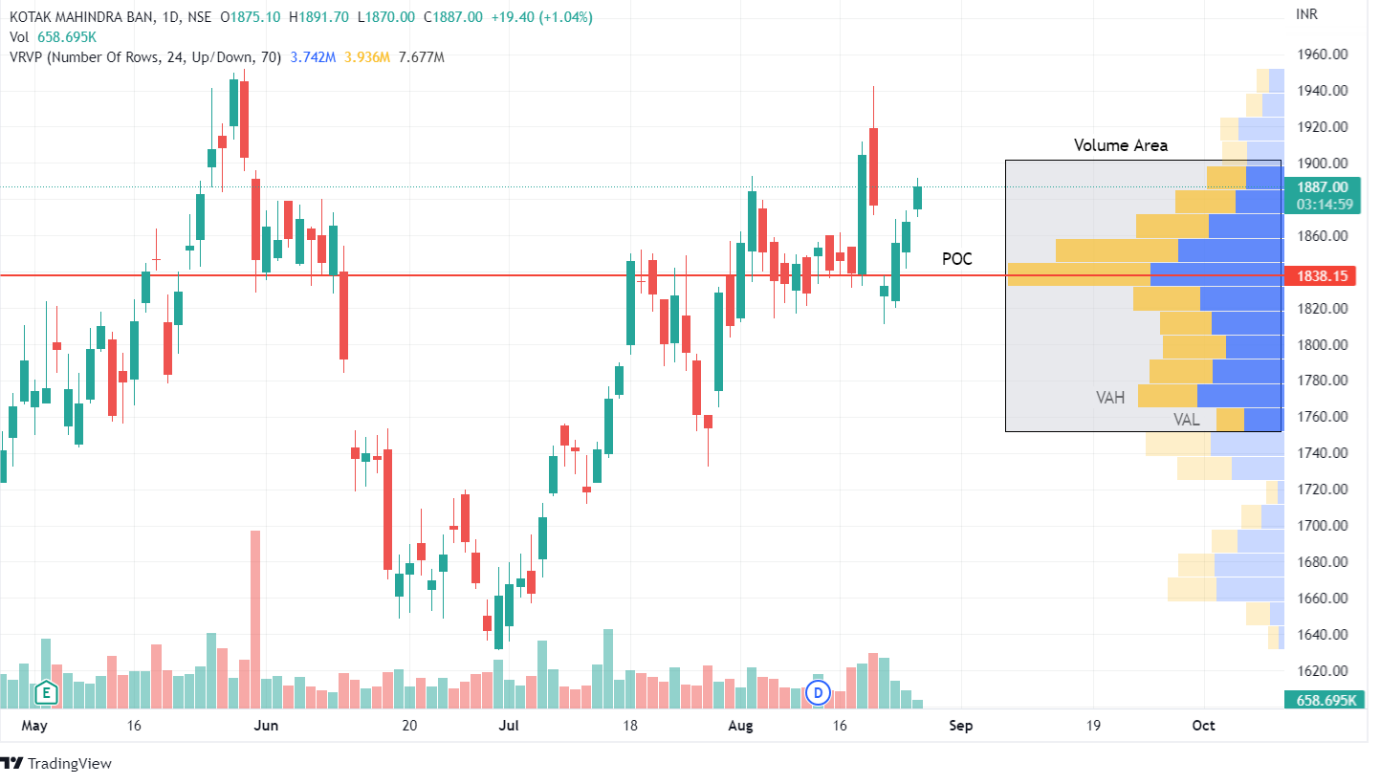
Before we get into explaining this volume indicator, there are some terms which you need to understand:
- The Value Area (VA) is the price range in which 70% of the total volume was traded, and it is frequently coloured differently for easier visualisation.
- Value Area High (VAH) – This is the highest price in the 70% total value area.
- Low-Value Area (VAL) – the lowest price in the 70% total value area.
- The Point of Control (POC) is the single price level where the most volume was traded for the session and represents the area with the most open trading positions.
After understanding the terms used in this volume indicator, let us know how to trade with Volume Profile:
How to trade with Volume Profile?
Below are the ways you can trade with volume profile indicator:
1. Support and Resistance
Most traders will first use a volume profile to identify basic support and resistance levels. However, we should note that using the Volume Profile as a support and resistance level identifier is reactive.
This means that the method of volume profile indicator is different from proactive methods like moving averages that are based on recent price action and are used to predict future price movements.
Reactive methods can help assign meaning or significance to price levels that the market has already passed through. According to basic technical analysis, a support level is a level that will prevent a price from falling, and a resistance level is a price level that can stop a price on its way up.
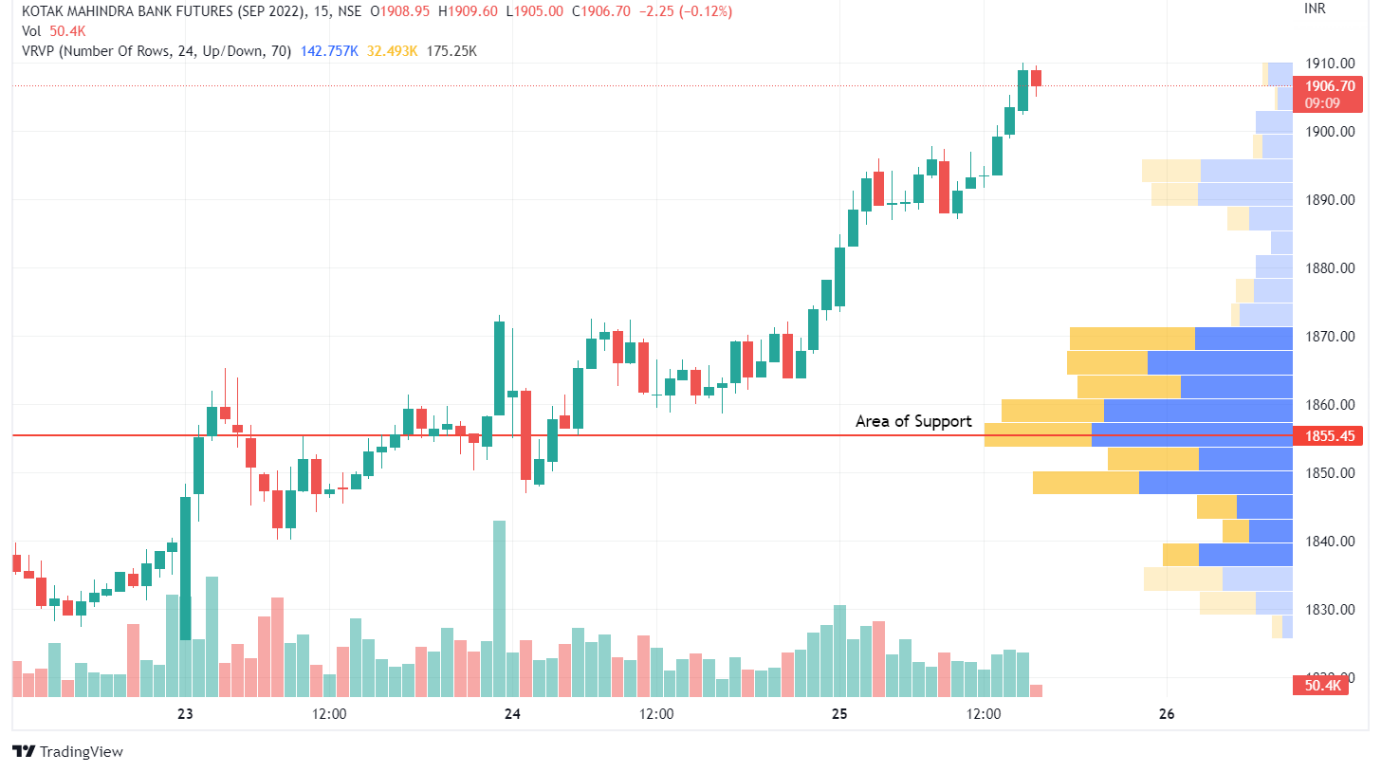
As a result, a price level near the bottom of the profile favouring the buy side in terms of volume is a good indicator of a support level. The inverse is also true. A price level that is near the top of this indicator that favours the selling side volume strongly indicates a resistance level.
2. High Volume Nodes and Low Volume Nodes
High Volume Nodes (HVN) are volume peaks at or near a price level. HVN can be interpreted as a sign of a period of consolidation. When compared to other levels in the profile, there is usually a lot of activity on both sides, and the market stays at that price level for a long time.
This could indicate a “fair value area” for the asset. A range-bound market is expected when the price approaches a previous HVN (or fair value area).
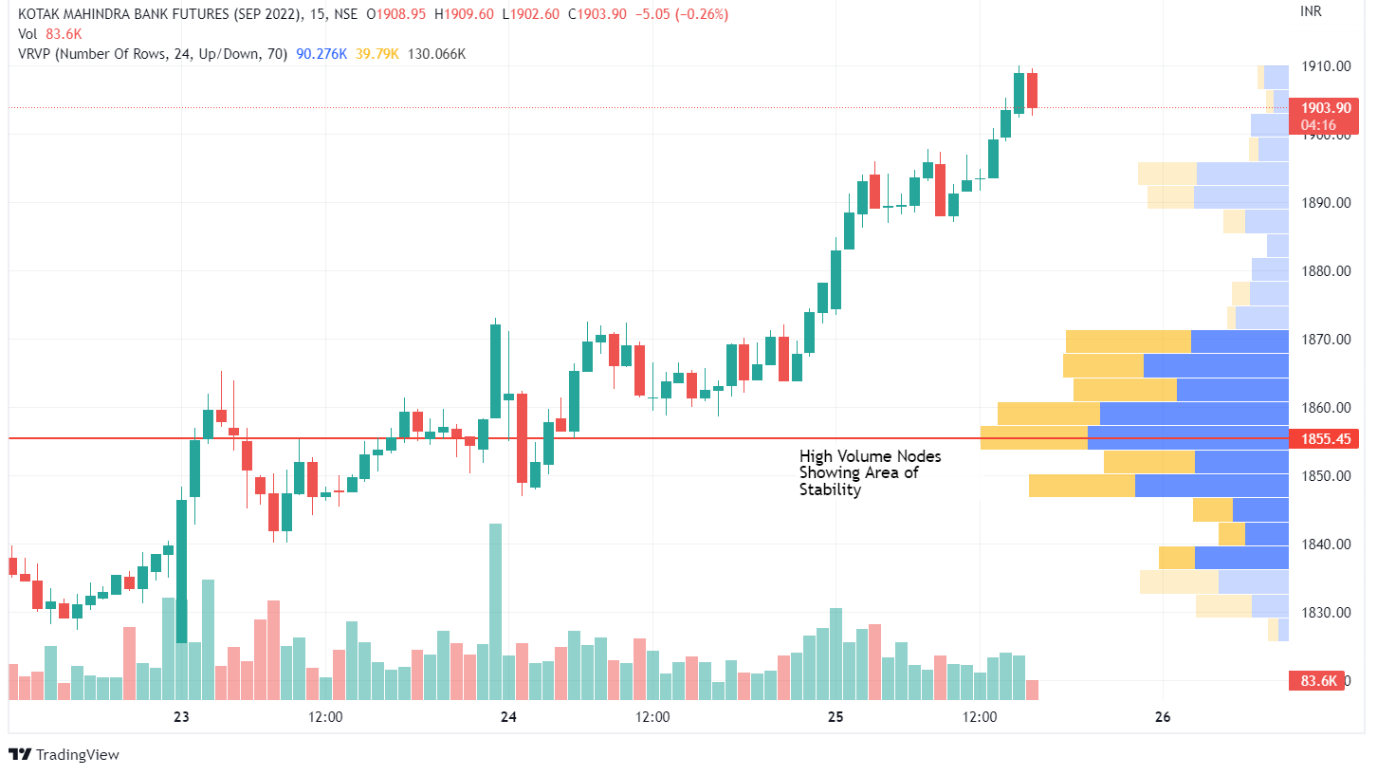
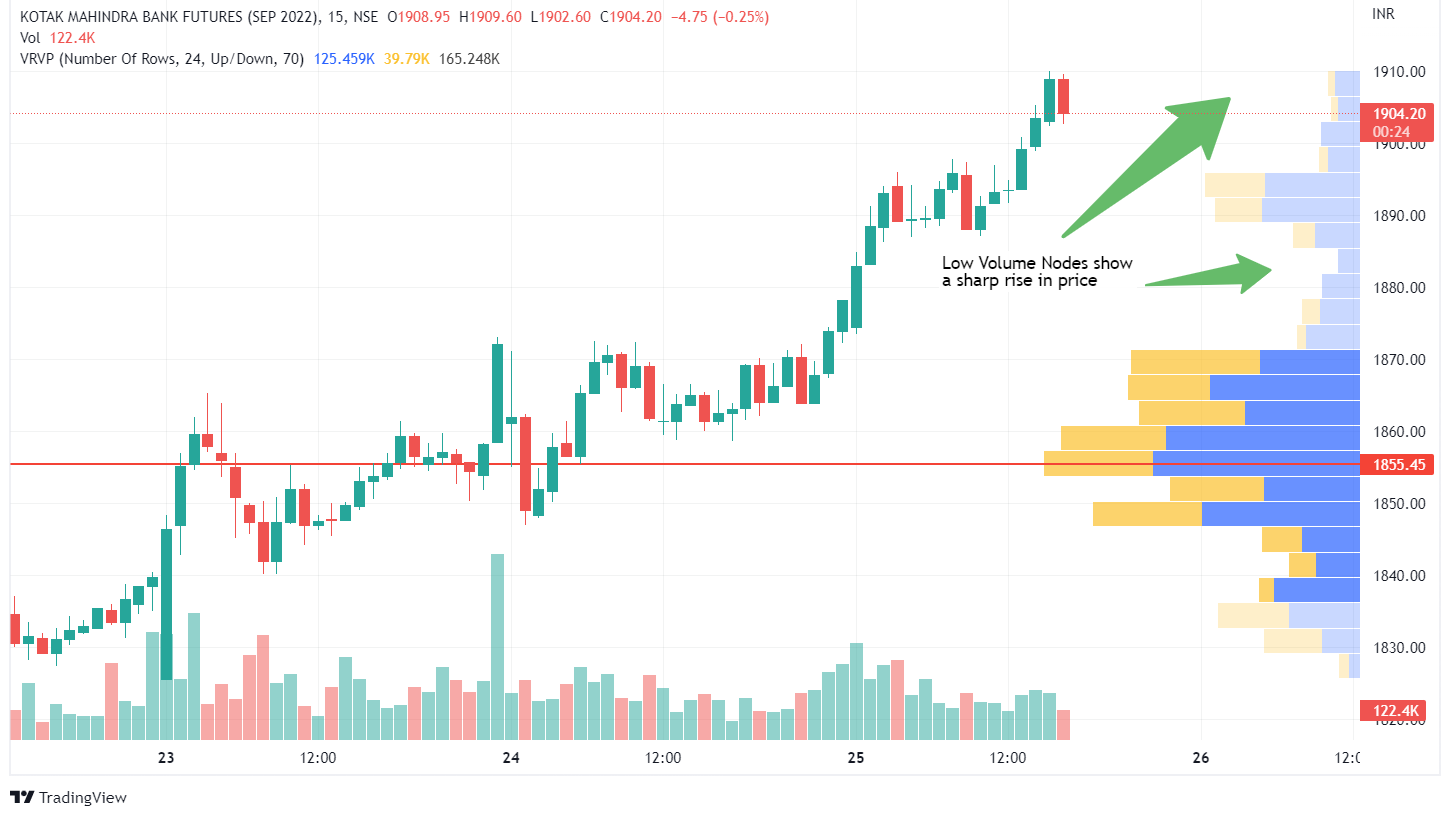
Low Volume Nodes (LVN) are volume valleys (or significant drops) at or near a price level. Low Volume Nodes are typically caused by a breakout rally or a breakdown. During a rally or a breakdown, there is usually a burst of volume followed by a significant drop-off.
You can also read our blog on 9 Types of Volume Indicator a trader should know
The decrease may indicate an “unfair value area” for the asset. When the market approaches a previous LVN (or unfair value area), it is much more likely to rally or bounce off that price level. Because it is perceived as an unfair value area, the market will spend less time there than at other levels in the profile.
Trading Example
Volume Profile, like most other tools or studies, has a variety of applications. In addition, there are numerous trading strategies that make use of Volume Profile as a key component.
The following are the fundamentals of one such strategy, which compares the recent day’s opening price to the previous day’s Volume Profile.
- If the recent day opens above the previous day’s value area (but below the Profile High), expect the price to retrace back towards the Point of Control before continuing to rise (in the direction of the day’s opening). As a result, there is a buying opportunity during the retracement to the Point of Control.
- If the recent day opens below the previous day’s value area (but still above the Profile Low), the price will retrace back towards the Point of Control before falling (in the direction of the day’s open). As a result, there is a selling opportunity during the retracement to the Point of Control.
- Suppose the recent day’s opening price is outside the previous day’s profile (above the Profile High or below the Profile Low). This can be interpreted as a possible runner in the opening price’s direction relative to the previous day’s profile range.
You can also join our course on Certification In Online Technical Analysis
Bottomline
Volume Profile is a highly valuable technical analysis tool used by traders worldwide. The versatility of the Volume Profile is the key to its continued relevance. It is a charting tool with a wide range of applications.
We hope you found this blog informative and use it to its maximum potential in the practical world. Also, show some love by sharing this blog with your family and friends and helping us in our mission of spreading financial literacy.
Happy Investing!


