Tweezer candlestick patterns are two candlestick trend reversal patterns. Tweezer top indicates a bearish reversal, whereas Tweezer bottom indicates a bullish reversal.
Tweezer top candlestick pattern occurs when the high of two candlesticks are almost or the same after an uptrend.
Tweezer bottom candlestick pattern occurs when the low of two candlesticks are almost or the same after a downtrend.
- What is the Tweezer Top pattern?
- What is the Tweezer Bottom pattern?
- How to identify Tweezer Top and Bottom Candlestick Patterns?
- What does Tweezer Candlestick Pattern tell us?
- What does the Tweezer Bottom Candlestick Pattern tell us?
- Importance of this pattern:
- Bottomline
- What is a tweezer top candlestick?
- Are tweezer tops bullish?
Let us about these two tweezer candlestick pattern in details:
What is the Tweezer Top pattern?
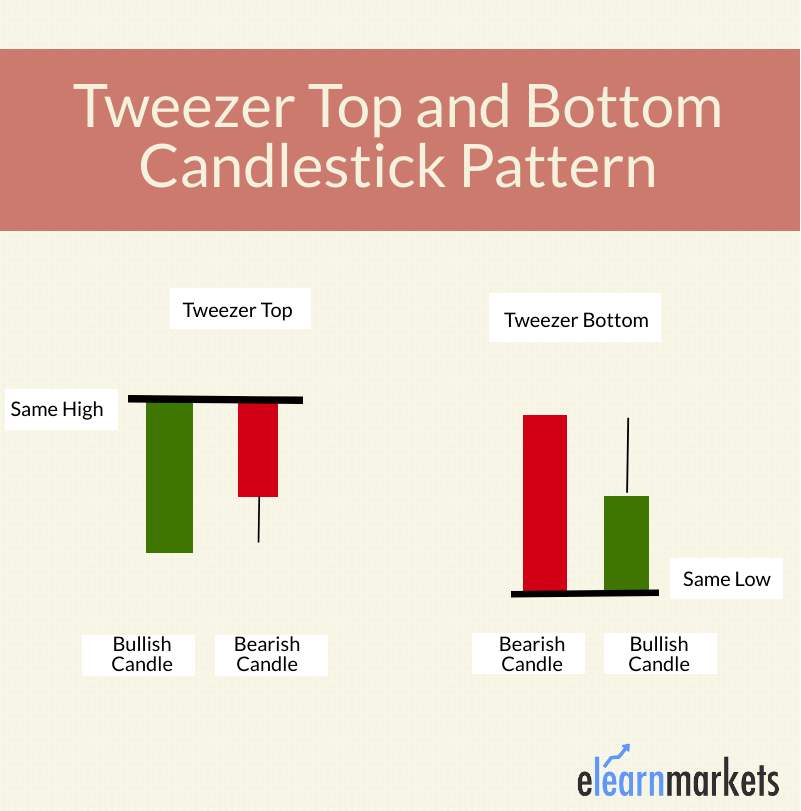
The Tweezer Top pattern is a bearish reversal candlestick pattern that is formed at the end of an uptrend.
It consists of two candlesticks, the first one being bullish and the second one being bearish candlestick. Both the tweezer candlesticks are almost the same height.
What is the Tweezer Bottom pattern?
The Tweezer Bottom candlestick pattern is a bullish reversal candlestick pattern that is formed at the end of the downtrend.
It consists of two candlesticks, the first one being bearish and the second one being bullish candlestick.
Both the candlesticks make almost or the same low.
How to identify Tweezer Top and Bottom Candlestick Patterns?
Below are some points that should be kept in mind when identifying Tweezer Top on the candlestick charts:
- The prior trend should be an uptrend
- A bullish candlestick should be formed on the first day of this pattern formation.
- On the next day, a bearish candle should be formed, having a similar high to the previous day’s candlestick.
Below are some points that should be kept in mind when identifying Tweezer Bottom on the candlestick charts:
- The prior trend should be a downtrend
- A bearish candlestick should be formed on the first day of this pattern formation.
- On the next day, a bullish candle should be formed, having a similar low to the previous day’s candlestick.
What does Tweezer Candlestick Pattern tell us?
When the Tweezer Top candlestick pattern is formed, the prior trend is an uptrend. A bullish candlestick is formed, which looks like the continuation of the ongoing uptrend.
On the next day, the high of the second day’s bearish candle’s high indicates a resistance level. Bulls seem to raise the price upward, but now they are not willing to buy at higher prices.
The top-most candles with almost the same height indicate the strength of the resistance and also signal that the uptrend may get reversed to form a downtrend. This bearish reversal is confirmed on the next day when the bearish candle is formed.
What does the Tweezer Bottom Candlestick Pattern tell us?
When the Tweezer Bottom candlestick pattern is formed, the prior trend is a downtrend.
A bearish tweezer candlestick is formed, which looks like the continuation of the ongoing downtrend.
On the next day, the second day’s bullish candle’s low indicates a support level.
The bottom-most candles with almost the same low indicate the strength of the support and also signal that the downtrend may get reversed to form an uptrend.
Due to this the bulls step into action and move the price upwards.
This bullish reversal is confirmed the next day when the bullish candle is formed.
Importance of this pattern:
When the traders see the formation of tweezer top and bottom candlestick patterns on the charts, they should be cautious that reversal is going to place.
They should square off their position when this reversal pattern forms.
They should also confirm the formation of a tweezer candlestick pattern with other technical indicators.
Read More- All 35 Candlestick Chart Patterns in the Stock Market
Bottomline
Tweezer Top and Bottom candlestick is a trend reversal pattern that involves two candlesticksTweezer top candlestick indicates a bearish reversal, whereas Tweezer bottom indicates a bullish reversal. When the traders see the formation of tweezer candlestick patterns on the charts, they should be cautious that reversal is going to place. Traders should also confirm the formation of tweezer candlestick patterns with other technical analysis indicators.
Read More- All 35 Candlestick Chart Patterns in the Stock Market
Frequently Asked Questions (FAQs)
What is a tweezer top candlestick?
When two candlesticks top at nearly the same level after an advance, this is known as a tweezers topping pattern. A tweezers bottom happens when two consecutive candles have very similar low points. Tweezers are a common candlestick pattern, much like many others.
Are tweezer tops bullish?
Popular candlestick patterns called “tweezers” aid in identifying trend reversals. When two candlesticks’ high points stay the same following an uptrend, it’s known as a tweaker top candlestick. It alludes to a bearish reversal (bullish reversal trends are denoted by a tweaker bottom).


This topic on Tweezers Top and Bottom is very informative and an eye opening for me.
Wonderful explanation, very easy to understand by even a beginner, thanks sir
I watched several videos of vivek Bajaj of elearnmarkets , iam fan of vivek Bajaj,I liked his interviews, grateful to you 🙏🙏
K.Vasudevan
Good explanation.
Very interesting.
Hi,
We are glad that you like our blog post. Please do read more blogs on Technical Analysis.
Thank you for Reading!
Thanks for such wonderful and easy to understand write ups. You have really made life easy for an average investor. None of TA coaches ever elaborate on candlestick patterns and they simply gloss over. I am really profiting in my trades by identifying CS patterns. A big thanks.
Hi,
We are glad that you liked our blog post.
Thank you for Reading!