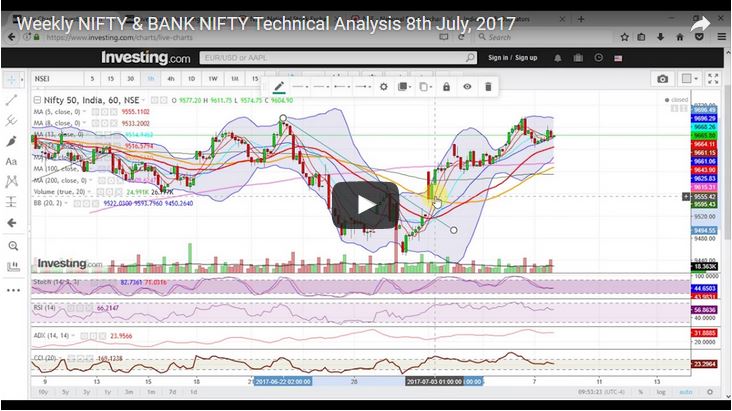
Nifty (weekly close approx. 9665.8):
Last week’s technical: After taking support from 50 day moving average the previous week. Nifty direction was mostly up during last week while volume was low. The market steadily drifted towards previous high of 9709 with low volume and ADX index losing momentum.

On Monday market opened gap up and started selling off. But after first hour of trade the Nifty reversed its trend and moved steadily upwards during the week, with prices taking support near hourly mid-Bollinger band. Someone could take long position in Nifty futures on pull back on Monday, targeting daily Mid Bollinger line situated at approx. 9605 (for spot Nifty) as the down trending trend line was broken. Then prices started trading over daily Mid Bollinger. A trader could also have taken long position in Nifty futures on Wednesday with the break of symmetrical triangle in spot Nifty chart and he could have made approx. 40 – 50 points in the up move. Overall, it was a low volume consolidation week with upward bias.

Next week’s technical possibilities: The daily ADX is indicating loss of momentum and also daily mid Bollinger line (20 day sma) has turned horizontal. Also the width of daily Bollinger band has contracted. Hence there is a possibility that market may remain range-bound and consolidate in the range going forward, unless there is a breakout or break-down on either sides. There are good amount of put build-up seen at 9600, 9500 and 9400 strikes. Hence the down-side looks limited with 34 day and 50 day moving averages remaining at approx. 9591 and approx. 9524 respectively. If on the upside there is a decisive breakout above 9714, i.e. upper Bollinger line, market may scale new highs. The 9700 and the 9800 calls have approx. 4 million open interest.

Nifty option open interest ,Data source: www.nseindia.com
Bank Nifty (weekly close approx. 23449.15):
Last week’s technical: The bank Nifty traded in a steady upward bias during the latter part of the week with daily ADX showing loss of momentum as the week progressed. The previous week the Bank Nifty took support close to 50 dma (that time at approx. 29981) and moved upward. Hence this week was continuation of that move with price moving to daily mid-Bollinger close to 23450 level.

After that market consolidated in a tight range of approx. 23400 to 23530. However, this week Bank Nifty Underperformed Nifty from the context that Nifty moved close to its life time high whereas bank Nifty is approx. 450 point away from that. Also Nifty closed above daily-mid Bollinger band, while spot Bank Nifty is just below its daily mid-Bollinger level.

Next week’s technical possibilities: As we see from the daily chart of bank Nifty that the daily ADX is showing loss of momentum. Also the Bollinger band width has contracted and mid Bollinger band has turned horizontal. If we look at the option open interest table of 13th July expiring Bank Nifty we can see puts from 23400 to 23000 has fair amount of open interest while calls from 23500 to 24000 have good amount of open interest. All of these indicates to possibility of a range bound market going forward. On the downside, 34 day and 50 day moving average is situated at approx. 23353 and approx. 23132 which can act as support. Below that 100 dma is at approx. 22113. On the upside upper Bollinger line (presently at approx. 23823) in spot bank nifty can act as resistance.

Data source: www.nseindia.com
Disclaimer
Elearnmarkets wants to inform you that this post/video is solely for educational purpose. We are not advising any trading or investment ideas. We want to add that the data/indicator/signals contained in this website/post/video are not necessarily real-time nor accurate. All CFDs/traded instruments (stocks, indexes, futures, commodities) and Forex prices are not provided by exchanges but rather by web based charting platforms, and so prices/indicators may not be accurate and may differ from the actual market prices, meaning prices are indicative and not appropriate for trading or investing purposes. Therefore, Elearnmarkets doesn`t bear any responsibility for any trading losses you might incur as a result of using this data/ indicators/charting platform. This analysis is purely based on the technical observations and not meant for investing with real money. Elearnmarkets does not have any position in the market. One can create position in market at his/her own risk.
Elearnmarkets or anyone involved with Elearnmarkets will not accept any liability for loss or damage as a result of reliance on the information including data, quotes, charts and buy/sell signals/discussions contained within this website/post. Please be fully informed regarding the risks and costs associated with trading the financial markets, it is one of the riskiest investment forms possible.


