
Fibonacci meaning in Hindi: आप इस लेख को हिंदी में भी पढ़ सकते है|
When the price moves in the direction of the trend, it’s called impulses and the move counter-trend or against the main trend is known as pullbacks. Fibonacci Retracement highlight levels which help us identify potential reversal area thus identifying potential entry point after a pullback.
The retracement can be applied both after an uptrend or a downtrend to identify probable reversal levels in the direction of the prior trend.
When combined with other technical parameters, price parameters and some important moving averages, the chances of identifying successful trades go up.
The most popular Fibonacci Retracements are 38.2%, 50% and 61.8% and 78.6%.
| Table of Contents |
|---|
| Understand Fibonacci Series |
| How to use Fibonacci Retracement Levels? |
| Fibonacci Retracement Example |
| Bottomline |
Understand Fibonacci Series
Before we dig deeper into the topic of Fibonacci retracement, it’s important to understand about Fibonacci series.
Fibonacci series is a series of numbers beginning from 0 and arranged in such a manner that any particular number of the series is simply the summation of previous two numbers which is shown below-
0, 1, 1, 2, 3, 5, 8, 13, 21, 34, 55, 89, 144, 233, 377 and so on.
Lets understand the above logic with an example-
377 = 233 + 144
233 = 144 + 89
144 = 89 + 55
89 = 55 +34
55 = 34 + 21
34 = 21 + 13
And it goes on
An interesting property of this Fibonacci series is that if you simply divide any number in the series by the previous number, the ratio always comes to 1.618; which is considered as the Golden Ratio also referred to as ‘Phi’.=
Let’s have a closer look at this-
377/233 = 1.618
233/144 = 1.618
144/89 = 1.618
89/55 = 1.618
55/34 = 1.618
34/21 = 1.618
And so on.
Let’s understand some other properties of this ratio and you will find a unique consistency when a number in the Fibonacci series is divided by its immediate succeeding number in the series.
For instance:
21/34 = 0.618
34/55 = 0.618
55/89 = 0.618
89/144 = 0.618
144/233 = 0.618
Similar such consistency can be seen when any number in the Fibonacci series is divided by a number two places higher than the given number. For example:
13/34 = 0.382
21/55 = 0.382
34/89 = 0.382
55/144 = 0.382
89/233 = 0.382
Similarly when you divide the number by a 3 digit higher number in the series, the consistency is still maintained and is displayed below:
13/55 = 0.236
21/89 = 0.236
34/144 = 0.236
55/233 = 0.236
So if we express all the above numbers in percentage terms, the value comes as 23.6%, 38.2%, 61.8% and so on.
How to use Fibonacci Retracement Levels?
Whenever there is a sharp move in the stock price either upward or downward, it usually has a high possibility of pullback before continuing in the direction of the main trend.
For example, suppose a stock moved from Rs 100 to Rs 200, then it may witness some pullback to 170 before moving to higher to say 250.
Fibonacci analysis has its application in the Stock market and can be applied when you are expecting a correction after a sharp up move or a down move.
It helps you identifying major halts or probable bounce back levels after a decline or advance as the case may be.
These Fibonacci retracement levels create a good opportunity for the traders to make new positions in the direction of the trend.
The important Fibonacci ratios are 23.6%, 38.2%, 50% and 61.8% retracement which help traders to identify the probable extent of the retracement and position himself for the trade accordingly.
Usually, 23.6% retracement is comparatively shallow and is suitable for flag breakouts or short term pullbacks.
On the other hand, 61.8% retracement is comparatively deeper, which is considered as golden ratio and is very important level.
However, retracements in the range of 38.2%-50% could be considered as a moderate correction.
Usually, if the stock bounces from 38.2% retracement, the underlying strength of the previous move is considered strong. You can try out fibonacci retracement calculator to have a good idea on the concept.
Fibonacci Retracement Example
Let’s look at some of the recent examples to gain more clarity about the concept of Fibonacci retracement.
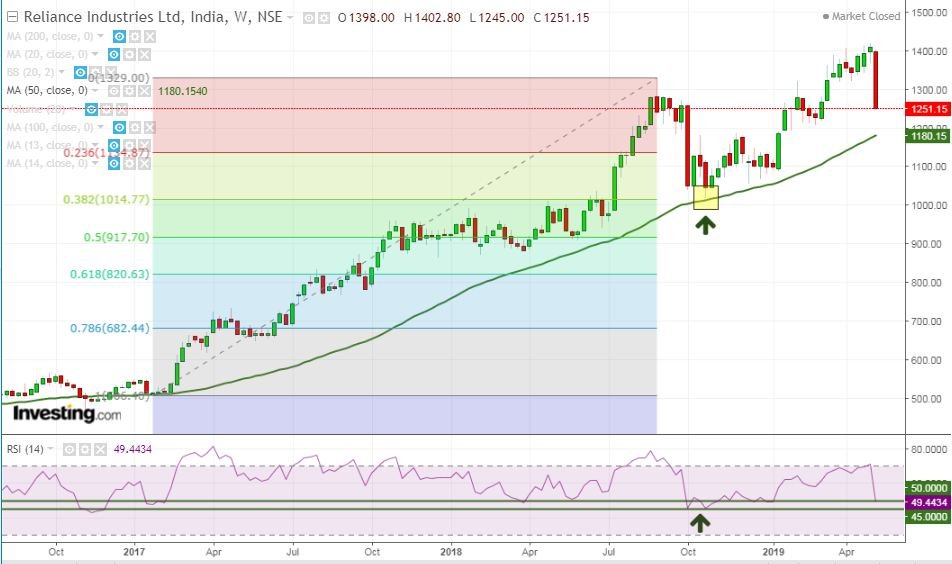
The above is an example of Reliance Industries where after a steady move which started from the year 2017 had undergone correction in the month of August 2018.
But it took support exactly from 38.2% retracement and witnessed sharp bounce in the coming months.
Further technical confirmation from 50 period MA and RSI zone of 45-50 confirmed the bounce.
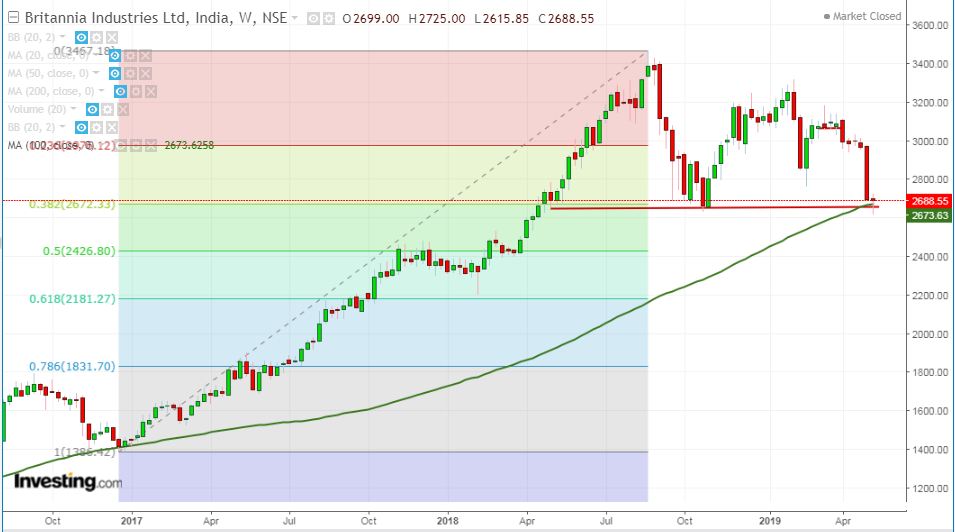
Next example is of Britannia ltd where presently the stock some bounce from the convergence of 38.2% retracement and 100 period MA and if the stock is able to trade and sustain above this week’s low, there could be a possibility of some pullback in the stock.
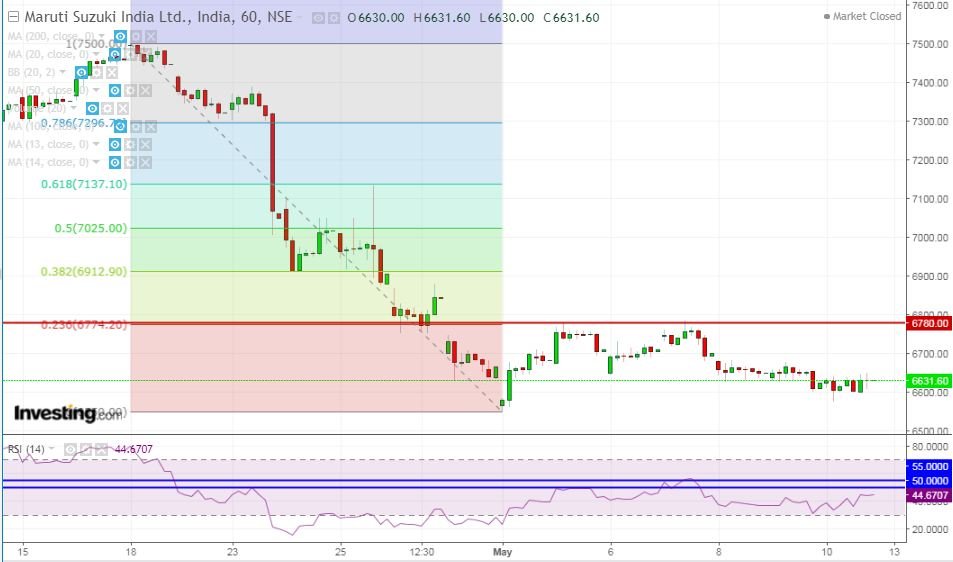
Next is the example of Maruti Suzuki India ltd where Fibonacci retracement is used in case of a downtrend and it is drawn by joining the highest point to the lowest point. As you can see, the stock constantly was facing resistance from 23.6% retracement which is further confirmed by RSI as it is not able to breach 45-50 level.
Watch the video below to know mora about Fibonacci Retracement:
Bottomline
Though Fibonacci is one of the useful methods to analyze your chart but it doesn’t provide an exact entry point rather an estimated area of entry.
Moreover, there is no guarantee that the price will reverse from any specified Fib level and hence you should combine it with other technical parameters as a confirmation.


How can I do technical analysis on your site.
Secondly is there anything about fibonacci channel.
Hi,
You can do Technical analysis from our StockEdge App.
We have a blog on Fibonacci.
Keep Reading!
Excellent explanation. Thanks
Hi,
We are glad that you liked our post.
Thank you for Reading!
Very good explanation..keep posting more information about technical expertise
Hi,
We really appreciated that you liked our blog.
Keep Reading!
It was wonderful learning of Fibonacci retracement tool
Hi,
We really appreciated that you liked our blog!
Thank you for Reading!
Keep Reading!