Learn this amazing Chart Pattern from a Real Trader
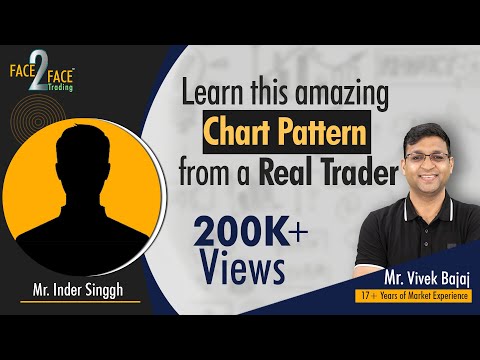
In this video of the Face2Face Series, watch a candid conversation between Mr. Vivek Bajaj, co-founder, Elearnmarkets & StockEdge and Mr. Inder Singgh, a technical analyst as well as freelancer trader with various proprietor trading desks with over 12 years of derivative trading experience.
Mr. Singgh focuses on the significance of chart patterns in stock market learning. He aims to encourage more learners to actively participate and gain a deeper understanding of the art of chart patterns in trading. He will be talking about his Wolfewave chart patterns strategy, which he has designed and used for himself. From the rules and structures to the efficiency of the strategy, he will be covering all the aspects.
To enhance the understanding and practical application to the traders, he has included demonstrations of charts as examples. These demonstrations showcase how the Wolfewave strategy can be applied to popular and strong Indian stocks. By consolidating the explanations of the strategy's rules and structures with the showcased chart demonstrations, traders will gain a holistic understanding of the Wolfewave strategy and its effective implementation in real-world trading scenarios.
Watch this video to learn more about the Wolfewave chart pattern analysis, a low-risk and high-reward trading strategy that specializes in identifying optimal entry and exit points for trades and investment decisions and discover how this strategy can help you in picking tops and bottoms in the market.

Your Speaker
Mr. Inder Singgh

Your Host
Vivek Bajaj