Basics of Elliott Wave
Introduction
The Elliott wave principle is a form of technical analysis that traders use to analyze financial market cycles. The traders forecast market trends by identifying the extremes in investor psychology, highs and lows in prices, and other collective factors.
Elliott Wave Theory suggests that market movements follow a natural sequence of crowd psychology cycles. Patterns are created according to current market sentiment, which alternates between bearish and bullish. However, the Elliott Wave is not an indicator or trading technique. Instead, it is a theory that may help to predict market behaviour.
Ralph Nelson Elliott
Ralph Nelson Elliott was the originator of the Elliott wave theory. He studied around 75 years of market charts and data, (including yearly, monthly, weekly, daily, hourly, and even half-hourly charts). He discovered a persistent and recurring pattern that operated between market tops and bottoms.
He theorized these patterns and named them “Waves”. By analyzing the waves, an analyst could forecast the market’s turns with a high degree of accuracy. After testing this theory for over four years, Elliott organized his research into an essay that he titled it as “The Wave Principle”. It was published in book form in 1935.
Elliott advocated that, although stock market trends may appear random and unpredictable, they actually follow predictable, natural laws and can be measured and predicted using the Fibonacci ratio.
Elliott Wave Theory was popularized in the seventies by Robert Prechter and A. J. Frost with their book “Elliott Wave Principle”.
Glenn Neely revolutionized and transformed the Elliott wave theory into the most objective, advanced and consistent theory in his phenomenal book “Mastering Elliott Wave”.
Elliott Wave Theory
In the last unit, we learned the origin of Elliott Wave Theory. Now, we will discuss in further detail and understand the concept of Elliott Wave Theory.
What is Elliott Wave Theory?
Elliott Wave theory measures investor psychology. Changing investor psychology is recorded in the form of price movements. If we can identify repeating patterns in prices and figure out where we are in those repeating patterns today, we can predict where we are going.
Elliott Wave Theory enables one to identify the market’s structure and anticipate the most likely next move based on one's positions within those structures. By using the Elliott Wave Theory, we can identify the highest probable moves with the least risk.
The Elliott Wave Theory works by identifying patterns in market prices. So, we start by analyzing waves on the chart. All price actions occur in the form of waves. That is because:
- Human nature and expressions are repetitive and have predictive value.
- The path of prices is not a product of news
- The market's progression unfolds in waves
Fibonacci Ratio
Elliott Wave Theory is based on Fibonacci Ratios. We have thoroughly learned Fibonacci ratios and their importance in technical analysis in one of our modules from ELM School, known as "The World of Fibonacci." In this section, we will quickly revisit the Fibonacci ratios and understand their relationship with Elliott Wave Theory. So, let us start.
What is a Fibonacci Series?
Leonardo Fibonacci da Pisa is a thirteenth-century mathematician. He was one of the most illustrious scientists of his time. Among his great achievements was the introduction of Arabic numerals to supersede the Roman numerals. He developed the Fibonacci Summation series: This series takes 0 and adds 1 as the first two numbers. The follow-up numbers in the series add the previous two numbers, and thus we have 0, 1, 1, 2, 3, 5, 8, 13, 21, 34, 55, 89, to infinity.
0,1,1,2,3,5,8,13,21,34,55,89,144 …….
The beauty of the series is that the ratio of any two consecutive numbers in the sequence approximates 1.618, or its inverse, 0.618, after the first few numbers.
The Golden Ratio (1.618) is derived by dividing a Fibonacci number by the previous Fibonacci number in the series. As an example, 144 divided by 89 would result in 1.618.
Another important fact is that the square of any Fibonacci number is equal to the number in the series before it, multiplied by the number after it, plus or minus 1.
52 = (3 x 8) +1
82 =(5 x 13) -1
132 =(8 x 21)+1
This is an implicit part of the Elliott Wave Principle called the Rule of alternation. It states that Complex corrective waves alternate with simple ones, strong impulse waves with weak impulse waves, and so on. The Rule of alteration can be with respect to time, price, or pattern.
Fibonacci Retracement and Extension
Fibonacci Retracement in technical analysis and Elliott Wave Theory refers to a market correction (counter trend) which is expected to end at the areas of support or resistance denoted by key Fibonacci levels. The market is then expected to turn and resume the trend in the primary direction.
Fibonacci Extension refers to the market moving with the primary trend into an area of support and resistance at key Fibonacci levels, where the target profit is measured. Traders use the Fibonacci Extension to determine their target profit.
Some Important Fibonacci Levels are given below:
The image below shows an example of both Fibonacci Retracement and Fibonacci Extension.

Here we can see the example of Axis Bank on the daily time frame, how prices are taking support at the 61.8% retracement levels, and how prices are showing resistance at the 141.40% extension levels
What is the relation between the Fibonacci Ratio and Elliott Wave Theory?
Fibonacci Ratio is useful to measure the target of a wave’s move within an Elliott Wave structure. Different waves in an Elliott Wave structure relate to one another with the Fibonacci Ratio. For example, in an impulse wave.
- Wave 2 is typically 50%, 61.8%, 78.6%, or 88.2% of wave 1
- Wave 3 is typically 161.8% of wave 1
- Wave 4 is typically 14.6%, 23.6%, or 38.2% of wave 3
- Wave 5 is typically inverse 1.236 – 1.618% of wave 4, equal to wave 1 or 61.8% of wave 1+3
Traders can thus use the information above to determine the point of entry and profit target when entering into a trade.

Below is the image of the default Fibonacci Retracement and Fibonacci Extension levels for the financial market that can be found in any charting tool for the financial market:


Waves
As we have learned earlier, the Elliott Wave Theory is completely based on the different types of wave formation on the price chart. Broadly, these waves can be Mono waves or Poly waves.
Mono Waves: A mono wave is the single direction movement wave. Mono waves are building blocks of all wave patterns. It only provides a limited perspective of the market. A greater understanding of market possibilities can be derived by grouping mono waves into poly waves.

Poly waves: Poly waves are a combination of mono waves taken together.

Waves combine to form patterns:
1. Impulse Pattern
2. Corrective Pattern

Patterns
1. 5 mono waves together form an impulse pattern

2. 3 Mono waves together form a corrective pattern

We will learn more about these patterns in our upcoming units.
Impulse pattern
As discussed earlier, the Impulse pattern consists of 5 waves.
- These waves are labelled as 1, 3, & 5.
- Waves 1,3, and 5 move in the same direction as the trend of the next larger degree
- Waves 2 and 4 move in the opposite direction
Waves are not of uniform length or duration
The Five-Wave Pattern

The image below shows the impulse pattern formation in the Nifty 50 weekly time frame:

Let us understand the individual waves of an impulse pattern
Wave 1
Wave 1 is rarely obvious when it starts. When the first wave of a new bull market begins, the fundamental news is almost universally negative. The previous trend is considered still strongly in force.
Fundamental analysts continue to revise their earnings estimates lower; the economy probably does not look strong. Sentiment surveys are decidedly bearish, and put options are in vogue. Volume might increase a bit as prices rise, but not by enough to alert many technical analysts.
Wave 2
Wave 2 corrects wave 1 but can never extend beyond the starting point of wave one. Typically, the news is still bad. As prices retest the prior low, bearish sentiment quickly builds, and "the crowd" haughtily reminds all that the bear market is still deeply ensconced.
Some positive signs appear for those who are tracking closely. Volume should be lower during wave 2 than during wave 1, prices usually do not retrace more than 61.8% of the wave one gains, and prices should fall in a three-wave pattern.
Wave 3
Wave 3 is usually the largest and most powerful wave in an impulse pattern. The news is now positive, and fundamental analysts start to raise earnings estimates. Prices rise quickly, corrections are short-lived and shallow.
Anyone looking to "get in on a pullback" will likely miss the boat. As wave three starts, the news is probably still bearish, and most market players remain negative; but by wave three's midpoint, "the crowd" will often join the new bullish trend.
Wave 4
Wave 4 corrects Wave 3. Prices may meander sideways for an extended period, and wave four typically retraces less than 38.2% of wave 3.
Volume is well below that of wave 3. This is a good place to buy a pullback if you understand the potential ahead for wave 5. Still, fourth waves are often frustrating because of their lack of progress in the larger trend.
Wave 5
Wave 5 is the final leg in the direction of the dominant trend. The news is almost universally positive, and everyone is bullish. Unfortunately, this is when many average investors finally buy in, right before the top.
Volume is often lower in wave 5 than in wave 3, and many momentum indicators start to show divergences (prices reach a new high, but the indicators do not reach a new peak). At the end of a major bull market, bears may very well be ridiculed (recall how forecasts for a top in the stock market during 2000 were received).
The image below shows the impulse pattern formation in Bajaj Finance's weekly time frame:

Corrective Pattern
"An action is always followed by a reaction"
An Impulse pattern is always followed by a Corrective Pattern. As we saw earlier, a corrective pattern has 3 waves. In this section, let us understand more about corrective patterns and when they form.
Corrective Pattern
Waves counter to the main trend are corrective waves.
Corrective waves are, most of the time, more complex and time-consuming than the impulse wave. Correction waves are patterns that occur between the impulse waves.
Correction patterns are normally made up of 3 monowaves. Correction only becomes “crystal clear” when they have completed or is near completion.
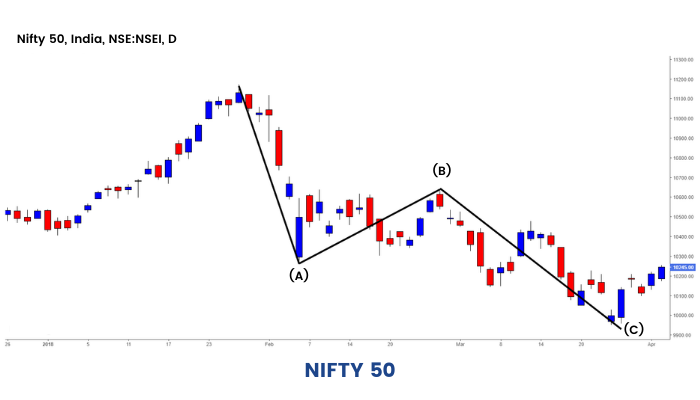
The corrective pattern consists of 3 waves with some exceptions, in that it moves against the trends of the next larger degree. Wave 2 moves in the direction of the trend, and Wave 1 moves against it. The waves are labelled as A, B, and C.
The image below shows the Corrective pattern formation in the Nifty 50 weekly time frame:
Wave A
Corrections are typically harder to identify than impulse moves. In wave A of a bear market, the fundamental news is usually still positive. Most analysts see the drop as a correction in a still-active bull market. Some technical indicators that accompany wave A include increased volume, rising implied volatility in the options markets, and possibly a turn higher in open interest in related futures markets.
Wave B
Prices reverse higher, which many see as a resumption of the now long-gone bull market. The volume during wave B should be lower than in wave A. By this point, fundamentals are probably no longer improving, but they most likely have not yet turned negative.
Wave C
Prices move impulsively lower in five waves. Volume picks up. Wave C is typically at least as large as wave A and often extends to 1.618 times wave A or beyond.
What are the various types of corrective patterns?
Corrective patterns are mainly of 3 types:
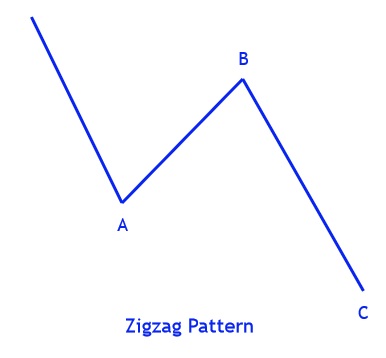
1. Zigzag correction: It is made up of 3 waves, which are named A, B, and C. Zigzags move sharply or strongly up or down. Zigzag patterns are sharp declines in a bull rally or advances in a bear rally that substantially correct the price level of the previous Impulse patterns.

The above image shows a ZigZag correction in Bharti Airtel daily time frame
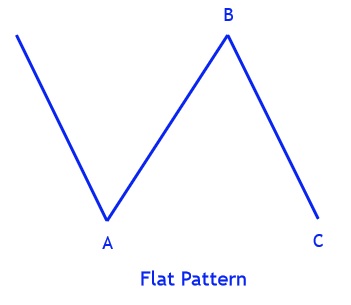
2. Flat Correction: It differs from Zigzag in that it tends to move sideways rather than strongly up or down. hence the name “Flat”. Flat tend to move the market sideways pattern. It is made up of 3 waves which are named as A, B, and C. These three waves also tend to be equivalent in the length. In the flat pattern, wave B will often undo the work of wave A and frequently reach the top of the previous impulse wave. Due to this action Wave B tends to fool traders who think that correction is over. Wave C then undoes the work of Wave B.
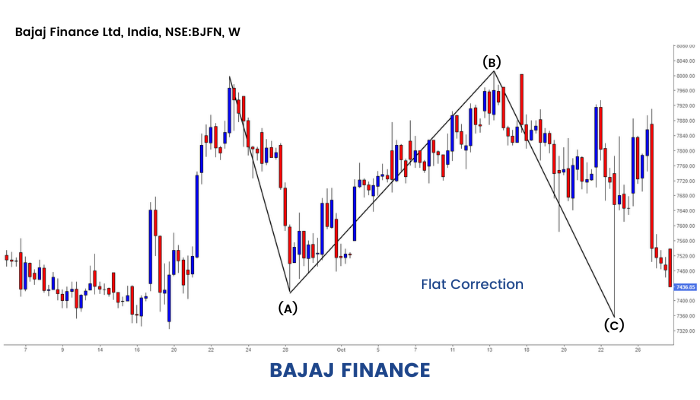
The above image shows a Flat correction in Bajaj Finance in the weekly time frame
3. Triangle Correction: It is made up of 5 waves, which are named A, B, C, D, and E. It is a sideways pattern like Flat. All the waves are range-bound. It is one of the most common types of patterns.
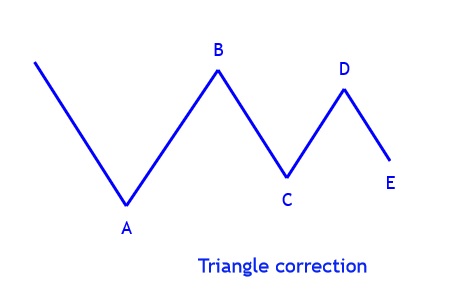
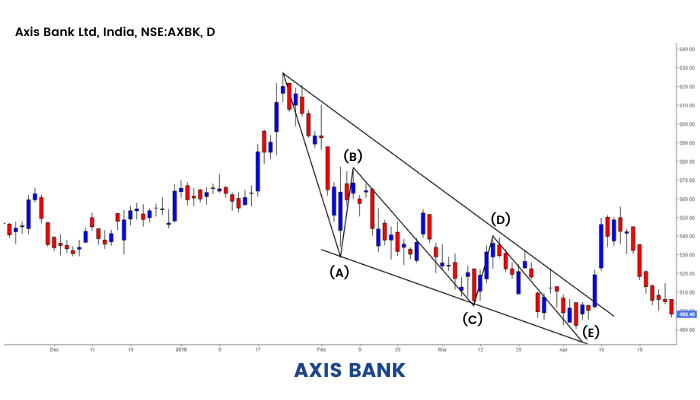
The above image shows a Triangle correction in Axis Bank in the daily time frame.
Fractal Nature of Elliott Waves
In this section, we will discuss how the concept of fractals applies to Elliott Wave Theory.
What are fractals?
Fractals are easily found in nature. These objects display self-similar structure over an extended, but finite, scale range.
Examples include clouds, snowflakes, mountains, river networks, cauliflower or broccoli, and systems of blood vessels.
Let us understand with the example of a tree.

There are branches within branches.
Trees are fractal in nature. A branch from a tree is a miniature replica of the main tree. It is not identical but similar in nature.
This concept can be very well applied to Elliott waves.
There are waves within waves
One of the basic tenets of Elliott Wave theory is that market structure is fractal in character. Elliott Wave patterns that show up on the long-term chart are seen as composed of a pattern of waves, but when the same wave is seen on a short-term chart, it is seen as composed of a pattern of waves, with sometimes more complex structures.
Now, for example, the internal structure of waves 1, 3, and 5 in an impulse pattern is 5 Waves as seen in a lower time frame chart.
Waves 2 and 4 have an internal structure of 3 waves, as seen in a lower time frame chart, i.e., they are corrective in nature.

Similarly, in the Zigzag correction, waves A and C have a 5-wave internal structure. Wave B has a 3-wave internal structure

A Flat correction shows Waves A and B having a 3-wave internal structure, and Wave C is a 5-wave internal structure

In a triangle correction, waves A to E all show a 3 Wave structure

So the challenging part of Elliott wave theory is figuring out the wave structure. Thus, the key to Elliot waves is the ability to identify the wave context with larger degree waves.
Note: There are some set rules & guidelines to identify each type of wave pattern. We will go through each of them in our upcoming units.
Rules for Impulse Waves
Firstly, let us start with the Rules of Impulse Waves.
What are the various rules and guidelines to identify Impulse Patterns?
Impulse Pattern
An Impulse Pattern is composed of 5 waves. It has 3 impulse waves which are labelled as 1, 3 & 5 and two corrective waves which are labelled as 2 & 4.
Rules of Impulse Pattern
An impulse pattern must obey all the rules given below. If any of the rules given below are not obeyed, then the pattern is by default corrective.
Rule 1: Wave 2 should never retrace all of Wave 1

Rule 2: Wave 3 will always go above the high of Wave 1

Rule 3: Wave 3 is never the shortest wave out of Wave 1, Wave 3, and Wave 5.

Rule 4: Wave 4 should not come into the territory of Wave 1

Rule 5: Wave 5 should be at least 38.2% of Wave 4

Rule 6: One wave must be extended out of Wave 1, Wave 3, and Wave 5. (An extension is the longest wave in an impulse wave)

Rule 7: Rule of alteration. This rule applies to wave 2 and wave 4 of an impulse pattern.
The alteration can be with respect to Price, Time, Subdivision, or Type of pattern.
Let us understand the rule of alteration.
Price: Wave 2 and Wave 4 should alternate with respect to the percentage retracement of the preceding wave. In the diagram below, we see Wave 2 showing more retracement than Wave 4

Time: Wave 2 and Wave 4 should alternate with respect to the time taken for their formation, i.e the distance covered in the horizontal units. In the diagram below we see Wave 4 taking more time than Wave 2

Subdivisions: Wave 2 and Wave 4 should alternate with respect to the presence of subdivision. In the diagram below, we see a subdivided Wave 2. Wave 4 is not subdivided.

Type of pattern: Wave 2 and Wave 4 should alternate with respect to the corrective pattern. In the diagram below, we see Wave 2 showing a zig-zag corrective pattern and Wave 4 showing a triangle corrective pattern.


The image shows the Impulse pattern formation in the daily time frame charts of Nifty 50
Here we can see the pattern adhering to all the rules of impulse patterns
- Rule 1: Wave 2 is not retracing the whole Wave 1
- Rule 2: Wave 3 is above wave 1
- Rule 3: Wave 1 is the shortest wave of all the major waves
- Rule 4: Wave 4 is not coming into the territory of Wave 1
- Rule 5: wave 5 is more than 38.2%
- Rule 6: Wave 5 is the extended wave of all the impulse waves
- Rule 7: Wave 2 and Wave 4 are obeying the rule of alteration (price, time, and pattern alteration)
Rules for Corrective Patterns
Secondly, let us discuss the 'Rules of Corrective Patterns'
What are the various rules and guidelines for identifying Zigzag Patterns?
Zigzags are corrective patterns.
1. Zigzag Pattern: In a zigzag pattern, Wave A and Wave C will have an internal structure of a 5-wave pattern, and Wave B will have an internal structure of 3 waves.
Rules for Zigzag Pattern
Rule 1: Wave A should be a 5-wave structure and should be less than 61.8% of the entire previous Impulse wave

Rule2: Wave B should retrace at least 1% of Wave A. However, Wave B should not retrace more than 61.80% of Wave A

Rule 3: Wave C should end beyond Wave A

Rule 4: Rule of alteration: it states that “adjacent or alternate waves of the same degree should be different and non-matching in as many ways as possible.” The rule of alteration in Zigzag correction applies to Wave A and Wave B.
Wave A and Wave B will alternate with respect to the following:
Price: Wave B will be less than 61.8% of Wave A
Time: If wave A is “n” units of time then
1. Wave B will be less than or equal to 61.8% of “n” OR
2. Wave B will be greater than or equal to 161.8% of “n”
Subdivision: The number of subdivisions will show an alteration in Wave A and Wave B
Pattern: The type of pattern will show alteration in Wave A and Wave B. Wave A is an impulse, and Wave B is a correction.

The image above shows the Zigzag pattern formation on the daily charts of Nifty 50.
Here we can see the pattern adhering to all the rules of the Zigzag patterns
- Rule 1: Wave A is showing a 5-wave structure
- Rule 2: Wave B is not retracing more than 61.8% of A
- Rule 3: Wave C is ending beyond Wave A
- Rule 4: Wave A and Wave B are obeying the rule of alteration (price, time, and pattern alteration)
Rules for Flat Correction - ABC Wave Correction
Next, we will learn what the various rules and guidelines are to identify Flat Correction.
Flat correction:
In flat correction, Wave A and Wave B will have an internal structure of 3 waves. Wave C will have an internal structure of 5 waves.
Rules for Flat correction
Rule 1: Wave A should be a 3-wave structure.

Rule 2: Wave B should be greater than 61.8%of Wave A.

Rule 3: Wave C is greater than 38.2% of Wave A

Rule 4: Rule of alteration: it states that “adjacent or alternate waves of the same degree should be different and non-matching in as many ways as possible”. In flat correction, Wave A and Wave B will alternate with respect to the following:
Price: Alteration will not be seen in price as the Waves A and B are similar in price.
Time: If wave A is “n” units of time then:
1. Wave B will be less than or equal to 61.8% of “n” OR
2. Wave B will be greater than or equal to 161.8% of “n”
Subdivision: The number of subdivisions will show an alteration in Wave A and Wave B
Pattern: The type of pattern will show alteration in Wave A and Wave B. Wave A is an impulse, and Wave B is a correction.

The image above shows the Flat pattern formation in Bajaj Finance on a daily time frame.
Here we can see the pattern adhering to all the rules of the Flat pattern.
- Rule 1: Wave A is a 3-wave structure
- Rule 2: Wave B is greater than 61.8% of Wave A
- Rule 3: Wave C is greater than 38.2% of Wave A
- Rule 4: Wave A and Wave B are obeying the rule of alteration (price, time, and pattern alteration)
Rules for Triangle Correction
Lastly, we will discuss what are the various rules and guidelines for identifying Triangle Correction.
Triangle Correction:
In triangle correction, all the waves from Wave A to Wave E have an internal structure of 3 waves.
Rules for triangle correction
Rule1: Wave B should be between 38.2% and 261.8% of Wave A, and Wave B should not be equal to Wave A.

Rule 2: Out of Wave B to Wave E, 3 waves should retrace at least 50% of the previous wave

Rule 3: Wave A can be or will not be the largest wave.
Rule 4: False Breach of the 0-B trend line indicated the possibility of a triangle in progress.


The image above shows the Triangle pattern formation in Tata Motors.
Here we can see the pattern adhering to all the rules of the Flat pattern:
- Rule 1: Wave B is between 38.2% and 261.8% of Wave A, and Wave B is not equal to Wave A.
- Rule 2: Out of Wave B to Wave E, 3 waves are retracing a minimum of 50% of the previous wave.
- Rule 3: Wave A is the largest wave.
- Rule 4: There is a False Breach of the 0-B trend line, indicating the possibility of a triangle in progress.
These are just the basics of Elliott wave theory. Elliott Wave theory is more subjective. Different chartists may have different views on plotting the waves, but the larger trend will remain the same for everyone. As we study further, we can find more complex corrections, more types of zigzag, flat, and Triangle corrections.
References
- R.N Elliott's Masterworks by Robert R. Prechter, Jr
- The Magic and Logic of Elliott Waves by Hemant Kale and Dr Shriang Joshi
- Mastering Elliott Wave: Presenting the Neely Method: The First Scientific, Objective Approach to Market Forecasting with Elliott Wave Theory by Glenn Neely
- Mastering Elliott Wave Principle by Constance Brown
- Fibonacci Applications and Strategies for Traders by Robert Fischer

Rejo Panicker
This document is curated by Mr Rejo Panicker. He is a passionate student of the market since 2017, pursuing a full-time trading career. He has a keen interest and understanding of the Elliott Wave Theory. Through his learning and experience he aims to create newer highs in the markets and aims to break Mr Dan Zanger's record.


