Debt Markets
Introduction
Have you ever heard from your friends that the US’s Bond Yield is going up, because of which there is a correction going on in the Bond Markets?
Have you ever heard that there are some issues with the Templeton’s Fixed Income funds because of which people are withdrawing their funds from various bond schemes?
The answer is Yes. Most of us have heard them, but rarely do we understand their actual significance. If we understand the debt markets and its working, we would be able to comprehend the above questions better.
What are Debt Markets?
A debt market is a market where fixed income or debt instruments can be traded. Here, capital can be transferred from one party to another. Lenders who have excess capital can lend their capital to businesses who need the capital to finance projects, investments, etc.
Debt instruments are assets that give a fixed payment to their holder, usually with interest.
Let’s try and understand this with an example:
Suppose you have a Fixed Deposit (F.D.) Of ₹100 in SBI at an interest rate of 6% p.a. for 3 years. So, you will get ₹6 at the end of year 1, ₹6 at the end of year 2 and ₹106 (6+100) at the end of year 3. (assuming its simple interest)
If you buy a bond, its mechanism is the same as a Fixed Deposit, however there are some key differences.
The interest which you receive in a bond is called the Coupon, and the interest rate is called the Coupon Rate.
In this case, ₹6 will be the Coupon, and 6% is the Coupon Rate.
Apart from this, Fixed Deposits do not trade in the market whereas most of the other debt securities like bonds, Commercial Papers, etc., are tradable securities.
Debt Market Terminologies
Before we move forward with this module, we should know about some of the basic terminologies in Debt Markets, as these terms will appear frequently throughout the module.
Coupon:
A coupon payment on a bond is the periodic interest payment that a bondholder will receive periodically until the bond matures.
For example, if the coupon rate of a 5-year, ₹100 bond is 5%, its coupon payment will be ₹5, each year for the next 5 years.
Coupon Rate:
The coupon rate on a bond is the percentage of its par value that is paid to its bondholders periodically.
For example, if the annual coupon of a bond is ₹5, and the par value of that bond is ₹100, then its coupon rate is 5/100 = 5%.
Note: The coupon rate of a bond is calculated on its par value and not on its current or issue price.
Yield To Maturity (YTM):
The YTM or Yield To Maturity of a bond is the total return a bond will generate if it’s held until maturity. It is also called the Redemption Yield. A bond’s YTM is different from its coupon rate. YTM is important because it enables investors to draw comparisons between different bonds of different maturities. Many investors make buying or selling decisions based on the YTM rates.
The formula for calculating YTM is as follows:
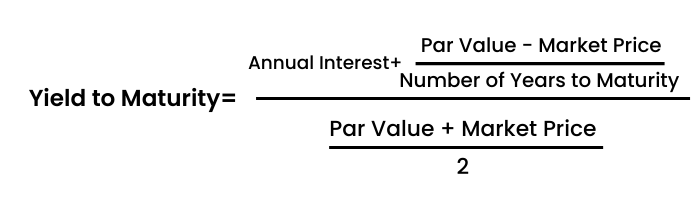
Let’s try and understand with an example:
Let’s assume that the Par Value of the bond is ₹1000, and the current market price of that bond is ₹920 with a coupon rate of 10%. The bond has a maturity of 10 years.
Now if we calculate the YTM of this bond, it will be:
₹100 + [(₹1,000- ₹920)/10]/(₹1,000+ ₹920)/2.
After solving the above equation, the YTM of this bond will be 11.25%.
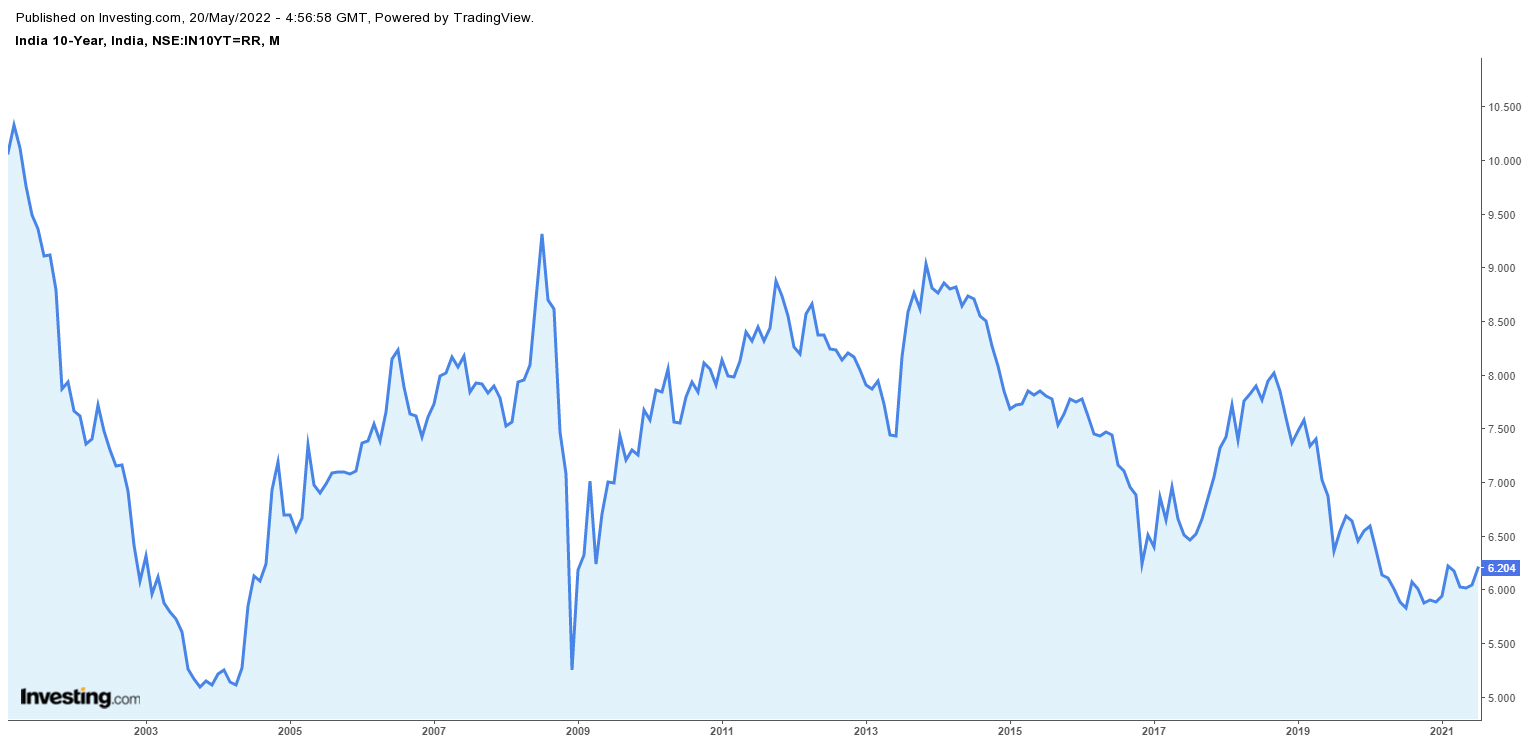
In the above image, we can see the yield rates of a 10-year Government bond in India has been declining gradually.
Repo Rates:
A Repurchase Agreement (Repo), is an agreement between two parties in which one party agrees to sell a security to a counter-party and commits to buying that security at a later date at a specified (higher) price.
RBI uses the repo rate as a tool to control inflation and maintain the money supply in the Indian economy.
For example, if RBI lends a security for ₹100 and buys it back for ₹101.5, then 1.50% is the Repo Rate. Another important term while referring to repo rates is Haircut or Repo Margin.
The haircut is the percentage difference between the market value of security and the amount loaned.
Suppose, the market value of the security loaned by RBI in the previous example is ₹128. Then, the Haircut will be 28% (₹128-₹100).
A Reverse Repo Rate agreement refers to taking the opposite side in a Repo transaction.
In other words, when commercial banks lend to RBI, it is known as Reverse Repo.
India’s last 10-year Repo Rates:
India’s last 10-year Reverse Repo Rates:
Maturity:
The term maturity signifies the maturity of a bond or any other Debt instrument.
Different debt instruments have different maturity dates. For example, Coca-Cola initially issued a 100-year bond in 1993, meaning that the bond will mature in 2093. This is one of the longest tenure bonds ever issued. Argentina’s government also once issued a 100-year bond. Some bonds are perpetual in nature meaning that they don't have a maturity date. These are usually issued by banks for e.g. SBI
According to their maturity, bonds can be classified as:
A.Short-term bonds: These bonds have a maturity between 1 to 5 years.
B.Medium-term bonds: These bonds have a maturity between 5 to 10 years.
C.Long-Term Bonds: Long- term bonds have a maturity of more than 10 years.
Types Of Debt Market And Debt Market Securities
As discussed, Debt is the money borrowed by one party from another to serve a financial need that otherwise cannot be met outright. Many organizations use debt to procure goods & services that they don't wish to pay for using their own funds and also do not wish to dilute equity holdings/voting rights by issuing new shares.
There are 2 types of debt markets - Money Markets, and Long-Term Fixed Income Markets. We will now discuss each market and the securities that are categorised under these markets:
1. Money Market:
Money Market is a market where short-term debt securities, i.e., securities which will mature in or less than 1 year are traded.
An important thing to note is that the money market is not made up of a single instrument. Instead, it is a collection of several instruments. Some of the instruments are Treasury Bills, Commercial Papers and Certificates of Deposits (CDs).
There are many participants in the Money Market. Reserve Bank of India (RBI), Mutual Fund Houses, Banks, Non-Banking Finance Companies (NBFCs), State Governments, Provident Funds (PFs), Primary Dealers, Retail Investors, etc., all participate in the Money Markets.
The Central Bank of India, i.e., RBI, participates in the money market to influence the money supply and the general level of interest rates in the economy. The average daily turnover data for the Money Market of India is reported at ₹735006 Crores in 2020. This implies that money markets in India have a sizable size. Let's discuss some of the most commonly traded securities in the money markets:
A. Treasury Bills (T-Bills):
Treasury Bills or T-bills are short-term instruments that are issued by the Treasury department of various countries. For example, T-Bills in India are issued by the Government of India. T-Bills in India can be issued in 3 different maturities, i.e., 91 days, 182 days, and 364 days.
T-Bills are zero-coupon securities, i.e., they do not pay any interest. Instead, they are issued at a discount to their Face Value and are redeemable at Face Value. For example, a treasury bill with a face value of ₹100 is currently selling at ₹95. This means that you can buy that T-bill today by paying ₹95 and at maturity you will get ₹100. In total, you will generate an income of ₹5 from that bill.
T-Bills are considered to be one of the safest investments. They have zero risks associated with them simply because they are issued by the Government of India.
How can I buy it?
Over the last few years, RBI has encouraged retail investors to buy G-secs like T-Bills. T-bills can be purchased with the help of a demat account. Some banking firms also have this feature.
The minimum ticket size to invest in T-Bills is ₹25,000.
Past Performance:
In the above image, we can see the historical rate of T-bills in India, which have been decreasing over time.
B. Commercial Paper:
Commercial Papers are short-term debt securities that can reduce the funding costs for the company that issues them. Commercial Papers are generally issued by large and creditworthy companies.
The advantage of issuing a Commercial Paper is that the interest cost of a commercial paper is less than the interest on a bank loan. Several firms also use Commercial Papers as a temporary source of funding before issuing a longer-term debt. This is also known as Bridge Financing.
Commercial Papers are often rolled over or reissued. The risk that a company will not be able to reissue a commercial paper is called the Rollover Risk. Rollover Risk is related to the refinancing of debt. Most of the companies primarily run on Debt. Over time, a company’s credit quality might decline and it might not be able to refinance its maturing debt. This risk is called the Rollover Risk.
This was experienced by many companies in the 2008 financial crisis. Many companies became bankrupt during this period. The biggest company that was the victim of this event was the Lehman Brothers, which went bankrupt. Before filing for bankruptcy in 2008, Lehman Brothers was the 4th largest Investment Bank in the U.S.
Commercial Paper is an unsecured form of debt, i.e., it is not protected by a collateral.
In the image below, we can see the top companies which have issued a Commercial Paper:

Who can Invest?
Banks, Individuals, Non-Residents, Companies and Foreign Institutional Investors (FII) can invest in a Commercial Paper. The minimum amount required to invest is ₹5 lakhs.
Commercial Papers are available both in physical as well as dematerialised form.
Another option to invest in a commercial paper is to buy Exchange Traded Funds which invest in Commercial Papers. ETFs are very similar to mutual funds but their management fees are low.
You can also visit NSE India’s website to check all the commercial papers which are currently listed:
As on 9th April 2021:

C. Certificate of Deposits:
Certificate of Deposits or CDs are interest-bearing securities that mature on specific dates. CDs are offered in a range of short-term maturities, ranging from 7 days to a year.
There are 2 types of CDs:
1.Negotiable CDs:
Negotiable CDs can be sold and are an important source of funding for many banks. They typically have maturities of 1 year or less and trade in the domestic bond markets.
2. Non-Negotiable CDs:
Non-Negotiable CDs cannot be sold and one is fined if funds are withdrawn before maturity. Just like Commercial Papers, CDs can also be purchased in dematerialised form.
The minimum issue size of a CD is ₹1 lakh and issues are made only in multiples of ₹1 lakh.
Who can Invest?
According to the NDSL’s website, if one wishes to buy a Certificate of Deposit, one has to negotiate a price with the seller. The price is determined by the buyer and seller through physical negotiation, and, if an agreement is reached, NDSL will then act as a Depository Participant(DP) and transfer the securities to the buyer’s de-mat account. The seller authorizes its DP through a delivery instruction slip. Only after the authorization is confirmed, the Certificate is transferred to the buyer.
The trades in CDs are held only through the official Clearing Houses which are National Securities Clearing Corporation Limited (NSCCL), Indian Clearing Corporation Limited (ICCL) and MCX Stock Exchange Clearing Corporation Limited.
Historical Performance of CDs in India:

D. Call Money:
The Call Money Market is an overnight market where surplus funds of banks are traded. It is a highly liquid market.
Here, banks borrow from one another to source large payments, remittances, and to maintain cash or liquidity with the RBI.
The call money market is used in India extensively for the purpose of maintaining the reserve limits set by RBI.
The rate of interest on these loans is known as the Call Rate. Call rates vary daily, sometimes even on an hourly basis.
Historical Rates

E. Collateralized Borrowing and Lending Obligation (CBLO):
Collateralized Borrowing and Lending Obligation or CBLO, is a money market instrument where financial institutions can avail a short-term loan by providing the prescribed securities as collateral.
Generally, institutions that are not allowed to lend from the inter-bank lending markets participate in the CBLO market where they lend and borrow money.
“Any retail investor can become a member of CBLO trading segment, provided he holds a current account with a bank, approved by CCIL for credit and debit of money.”
“The normal market session for retail investors is open from 9.00 A.M. to 4.00 P.M. for T+0 and 9.00 A.M. to 5.30 P.M. for T+1 settlement on weekdays, and from 9.00 A.M. to 2.00 P.M for both settlements on Saturday.” Securities are traded in the CBLO Auction Market.
The minimum lot size of the CBLO Market is ₹50 lakhs.
All of the above instruments have almost the same characteristics but have different issuers.
2. Long-Term Fixed Income Market:
A.G-Sec & SDLs:
G-Sec are tradable instruments that are issued by the Central Government or State Governments of India. G-Sec can be short or long-term, depending on their maturities.
Short term G-Secs are called Treasury Bills and Longer-term G-Secs are called Government Bonds. State Governments can issue Government Bonds only whilst the Central Government can issue both.
Since we have discussed T-Bills, we will only discuss Government Bonds in this section.
Government Bonds provide good safety of capital because they are risk-free.
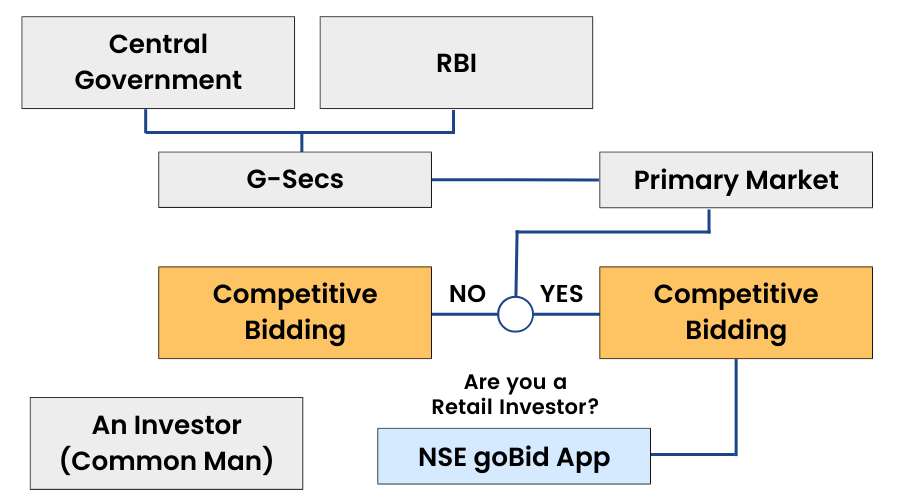
Where can I buy it?
Retail Investors can buy Government Bonds by registering themselves on stock exchanges or by investing in Gilt Funds. Gilt funds are just like mutual funds which invest in various Government securities.
If a retail investor wants to invest in Government securities, he can only do that through a non-competitive bidding process on the NSE goBid App or its website.
According to the official website of RBI, “The Government of India issues securities in order to borrow money from the market. One way in which the securities are offered to investors is through auctions. The government notifies the date on which it will borrow a notified amount through an auction.
The investors bid either in terms of the rate of interest (coupon) for a new security or the price for an existing security being reissued. Since the process of bidding is somewhat technical, only the large and informed investors, such as, banks, primary dealers, financial institutions, mutual funds, insurance companies, etc generally participate in the auctions. This leaves out a large section of medium and small investors from the primary market for government securities which is not only safe and secure but also gives market related rates of return. The Reserve Bank of India has announced a facility of non-competitive bidding in dated government securities on December 7th 2001 for small investors.”
In short, Competitive bidding is a process by which large institutions like banks, mutual funds, etc., can bid for Government securities, whereas Non- Competitive is also an auction for small investors.

Where can you purchase or sell Fixed Income Securities?
The market for Debt Securities is way bigger than equity markets. Unlike equities, Fixed Income securities expire after a period of time. Also, these securities can be very illiquid, because once new securities are issued, there’s no active market where these securities are traded regularly.
There are 2 ways through which we can buy debt securities, let's discuss each point in detail:
A.Through OTC Markets:
Securities like bonds don’t trade on a formal exchange. Various institutions like RBI, State Government, private institutions can issue these securities.
The market for Bonds, etc., is known as Over-The-Counter (OTC) markets. Here, securities trade without the supervision of a regulator.
OTC markets are also called Dealer Markets because anyone who wishes to buy or sell a bond has to go to a dealer and buy from them at a quoted price.
We can see the data of bonds that are currently trading over the OTC markets on NSE.Since OTC markets are illiquid, it becomes very difficult to sell a security in the future.

The primary advantage of OTC markets is that the contracts here are customisable because there is no exchange present to standardize a contract.
The ticket size for buying these securities is huge, and everyone can’t buy them.
B.Through Mutual Funds:
A mutual fund is a vehicle where large sums of money is collected from a pool of investors and invested in various types of asset classes.
Debt Mutual Funds are mutual funds which invest in various debt securities.
First of all, there are 16 types of debt mutual funds from which an investor can choose. A brief description has been given below:
1. Overnight Fund:
Overnight funds are funds which invest in assets that mature in 1 day, or on an overnight basis. This category of debt funds was introduced as part of SEBI's mutual fund reclassification exercise in 2018.
2. Liquid Fund:
Liquid funds are funds which invest in fixed income instruments such as, Treasury Bills, Commercial Papers, etc., instruments that mature on or within 91 days.
3. Ultra-Short Duration Fund:
Ultra-short-term funds are funds which invest in fixed-income securities that have a maturity up to six months. The average duration of the fund is between 3-6 months.
4. Low Duration Fund:
Low duration funds invest in a range of money market and debt securities in such a way that the portfolio duration of that fund ranges between 6 to 12 months. These funds have high interest rates and credit risk when compared to liquid and overnight funds, but they are among the lowest risk funds within the family of duration funds.
5. Money Market Fund:
Money Market Funds are debt funds that invest in debt securities which have a maturity of 1 year or less.
6. Short Duration Fund:
Short duration funds are debt funds which invest in debt and money market securities and duration of the fund is between 1 and 3 years. These funds earn through interest income and capital gains on their debt holdings.
7. Medium Duration Fund:
Medium Duration Funds are funds which invest in debt securities and money market instruments in such a way that the Macaulay Duration of the fund’s portfolio is between 3-4 years. These funds are recommended to investors who have an investment horizon of at least 4 years.
8. Medium To Long Duration Fund:
Medium To Long Duration Funds are funds that invest in Long-term debt securities and have a portfolio duration between 4-7 years.
9. Long Duration Fund:
As the name suggests, Long Duration Funds are funds that invest in debt securities and have a portfolio duration of more than 7 years.
10. Dynamic Bond:
Dynamic Bond funds invest in bonds which have various duration . The main objective of this fund is to provide sustainable returns during both rising and falling markets.
11. Corporate Bond Fund:
80% of Funds are invested in the highest-rated corporate bonds in a Corporate Bond Fund.
12. Credit Risk Fund:
65% of funds are invested in Corporate Bond which has a rating below AA+ in a Credit Risk fund.
13. Banking & PSU Fund:
80% of funds are allocated to PSUs in a Banking & PSU Fund.
14. Gilt Funds:
In a Gilt Fund, 80% of funds are allocated to Government Securities.
15. Gilt Funds with 10 years constant duration:
The total portfolio duration of this fund is equal to 10 years.
16. Floater Fund:
65% of the funds are allocated in floating-rate bonds in a Floater Fund.
As you can see, different schemes have different characteristics, and an investor should choose a mutual fund scheme according to his/her risks and preferences. So, in the next unit, we will learn the steps to select the best debt funds.
How To Select The Best Debt Funds?
There are 4 steps to select Debt Funds:
1. Select the tenure of your Investment:
The first step in selecting debt funds is knowing what is the tenure of your investment. If you want to invest for a short period, then investing in a bond which has a low duration or a low duration fund makes sense. If you want to invest for a longer time, selecting a long duration bond/fund is sensible. We will discuss the concept of duration in our later sections in the module.
Let’s suppose you selected the low duration fund.
The next question is that more than 100 funds are operating in this category, which one should we choose?
2. Check Credit Ratings:
To choose the appropriate fund, we need to check every fund’s credit rating under this scheme.
Suppose you want to check the Credit Rating of Kotak Low Duration Fund,
If we go to valueresearchonline.com and type the fund’s name, we will be able to see this fund’s credit rating.
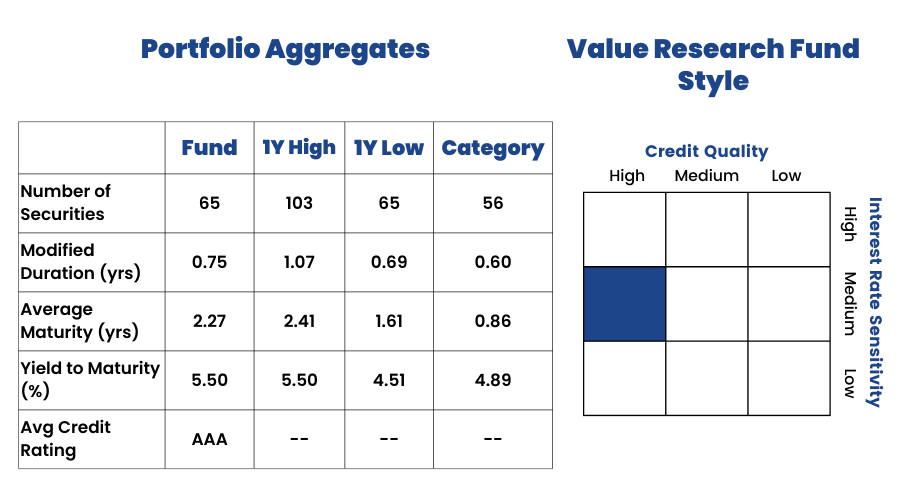
Credit Rating vis-a-vis Category:
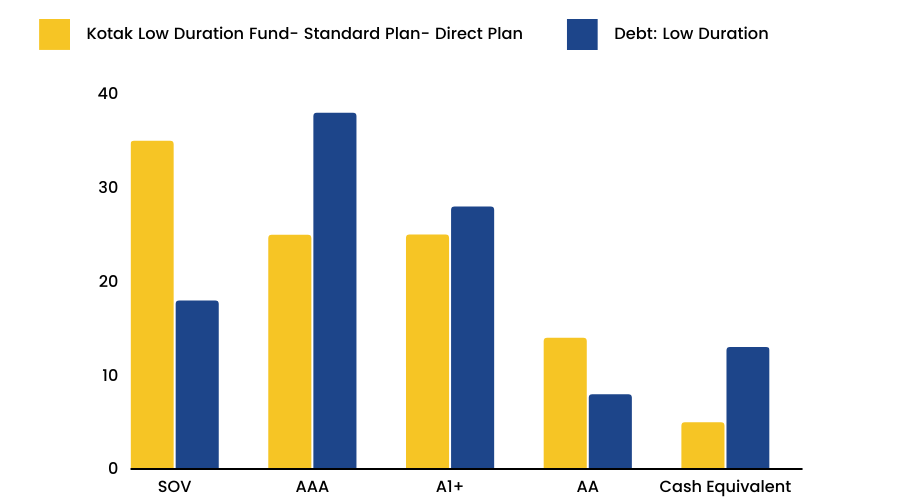
In the above image, we can see the Average Credit rating of this portfolio. As we know SOV & AAA is the best credit rating, and this fund has invested its majority of funds in AAA or A1+ rated securities, which is why this fund might not be the best one to invest in. We will get into the details of the Credit Ratings in our later sections.
3. Concentration Risk:
Now, the next question is what is concentration Risk?
Concentration Risk is the risk of investing in a single asset. For example, if you have ₹100 to invest, and you put ₹10 into a single bond, then your concentration risk is 10%.
There isn’t a rule which says what is optimum concentration risk for a debt fund.
How can we check concentration risk?
Simple, we can go to Stockedge, click on Mutual Funds, then click on Debt Securities, and then we can see all the 16 categories of Schemes which we talked about a little while ago.
Under the low duration fund, we will able to see all the funds that are categorised under this category, from there we can click on Holdings and we will be able to see the percentage of all the holdings that the fund has:
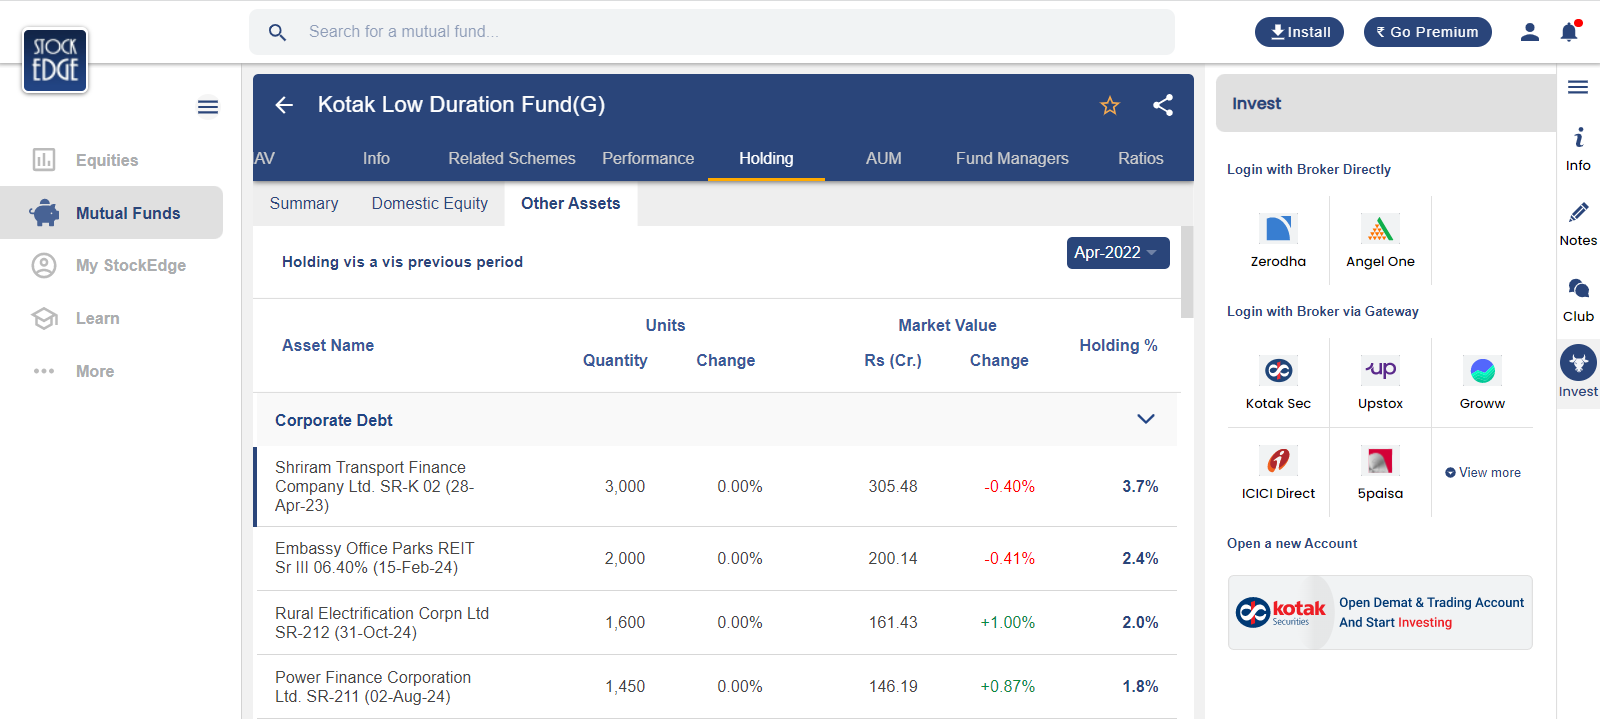
As we can see, the top holding of this fund has a concentration risk of 3.7%.
4. YTM-Expense:
As we know, The YTM or Yield To Maturity of a bond is the total return a bond will generate if it’s held until maturity. Once we select the funds, we need to check how much return they will generate. For this, we can again visit stockedge, and click on the info of the selected fund.
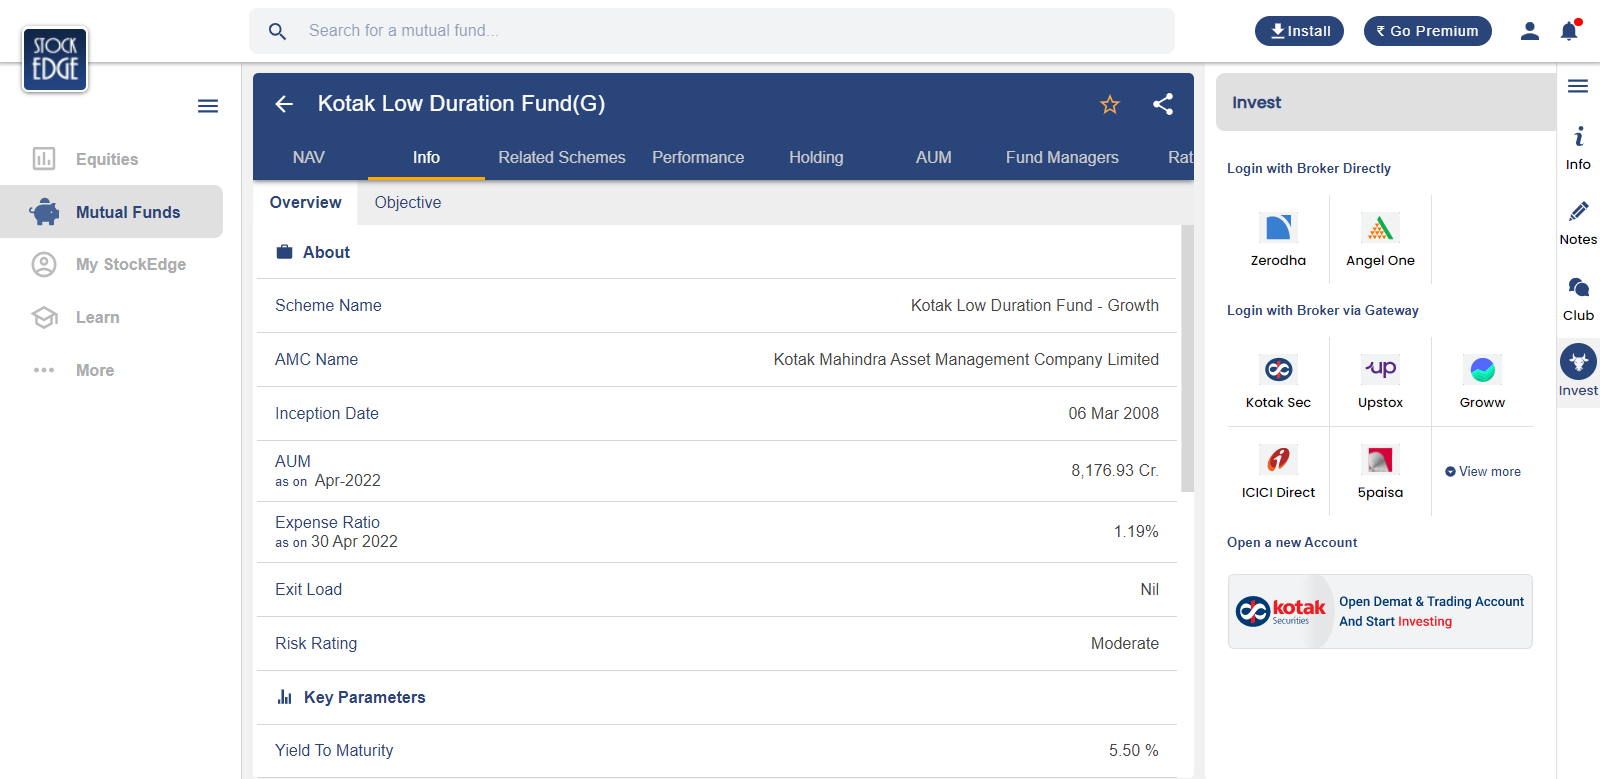
Here, we can see the YTM and Expense ratio of this fund. If we subtract the YTM from its expense ratio, we will get the total return this fund will generate. For this fund, the expected return will be 5.50% - 1.9% = 3.6%. The fund with the highest return probability is the fund we should invest in.
What Is A Credit Rating?
In the previous unit, we have learned the importance of checking the credit rating of any bond while investing. So, here in this section, we will elaborate and understand the concept of credit rating and how these bonds are rated by several credit rating agencies.
Like all the other financial instruments, debt securities carry significant risks with them. This is why it is important to evaluate the credit quality of a debt security. All in all, a bad quality of debt security should be ignored by us.
As a part of the credit rating process, bonds, or any other debt instruments are rated based on their risk of default, i.e., the ability of the issuer to repay the debt it has taken.
Credit Ratings signify the creditworthiness of a company by assigning a rating to it.
Under the credit rating process, several factors like the payment history of a company, its financials, the amount it owns, etc., are evaluated and a credit rating is assigned to that security. These ratings are carried out by different Rating Agencies who are experts in this field.
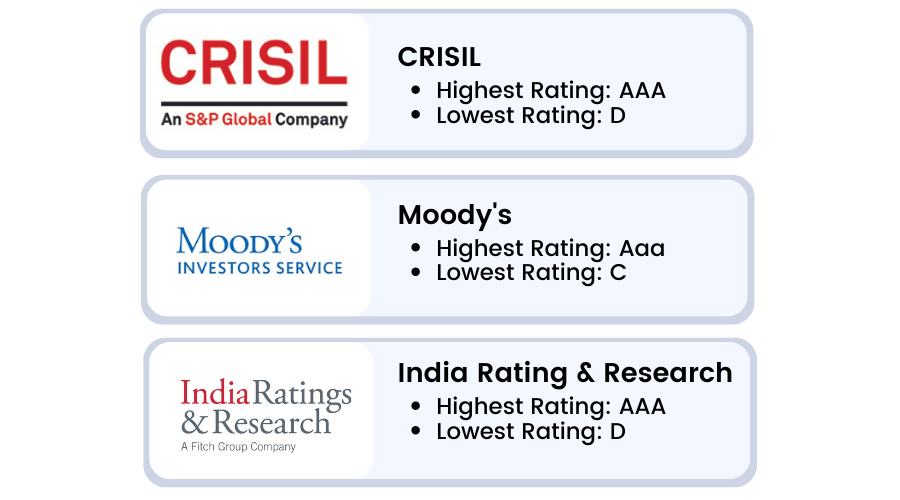
Some of the major credit rating agencies in India are:
1.CRISIL:
CRISIL is an Indian analytical company which provides ratings, research, risk and policy advisory services and is a subsidiary of S&P Global.
CRISIL is the first credit rating agency of India and was established in 1988 by the ICICI and UTI jointly. In April 2005, US based credit rating agency S&P acquired a majority stake in the company
As of December 2020, CRISIL’s revenue is ₹20,763 million (US$290 million) and a net income of ₹3,547 million (US$50 million).
2.Moody’s:
Moody's Investors Service, also referred to as Moody's is the bond credit rating business of Moody's Corporation and represents the company's traditional line of business. The company provides financial research on bonds and other debt securities which are issued by commercial and government entities. Moody's, along with S&P and Fitch Group, is considered to be one of the Big Three credit rating agencies in the world.
3.India Ratings & Research:
India Ratings and Research is India's one of the most respected credit rating agencies. The Company is built on a foundation of independent thinking, rigorous analytics. The company has grown rapidly during the past decade and has gained significant market share in India's fixed income market.
It is a 100% owned subsidiary of the Fitch Group.
The ratings do not convey other risks which can be present in a company like its liquidity position, etc.
A low-rated company has a high chance of defaulting on its payments when compared to a company whose credit rating is high.
All the agencies require to disclose the credit ratings that they have assigned on their website and other platforms.
As common investors, we can look at the ratings before making a buy decision.
One thing to remember is that credit rating agencies only evaluate the creditworthiness of a company. They do not evaluate other risks like market risk, reinvestment risk, etc.
This is why we should use credit ratings to evaluate the credit risk of a company and nothing else.
Credit Rating Agencies try to provide an independent and impartial opinion of the credit risk of a company which is seeking to raise money.
Here is a list of the Rating scale of major Rating Agencies in India:
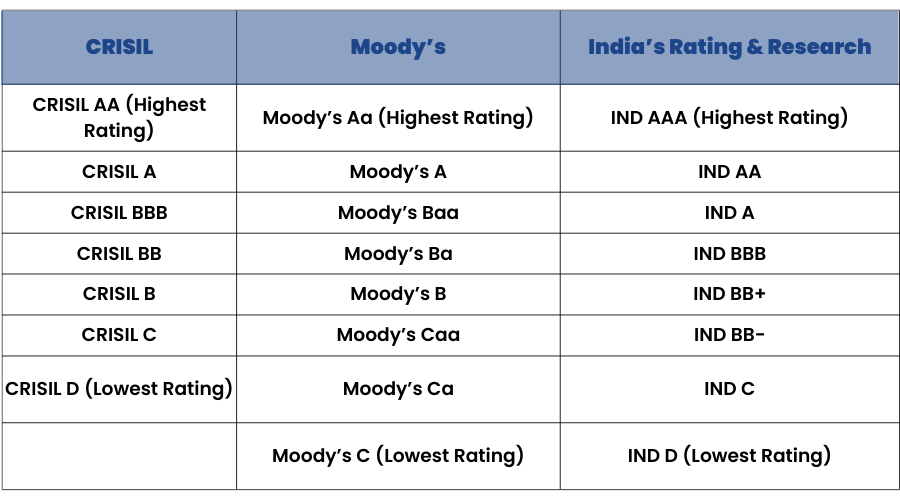
In the above table, we can see the different ratings that are assigned by the rating agencies. These ratings are for debt instruments that have a maturity of 1 year or more.
Short-term maturity instruments have different rating scales.
AAA is the highest rating, whereas D means Default, i.e., the company is about to default on its payments or has already defaulted.
Bonds with ratings on or above CRISIL BBB are considered to be Investment Grade whereas bonds with ratings below CRISIL BBB are considered to be Non-Investment or Junk Grade bonds.
Credit Rating Agencies also have some risks:
1.Credit Ratings are dynamic in nature:
A company’s default risk keeps changing over time. All in all, high rated bonds are more stable than low-rate bonds.
2. Rating Agencies are not perfect:
There is a probability that rating agencies fail to correctly measure a risk. Relying on rating agencies without doing your own research is a bad idea.
3. Event Risk is difficult to measure:
As easy as it sounds, the probability of default is very difficult to measure. Risks like natural disasters, mergers and acquisitions are hard to predict. In that case, the ratings become unreliable.
Types Of Risk Associated With A Bond
When buying a bond, we should look at the various risks it carries. Generally, there are 2 types of risks involved. Credit Risk and Interest Rate Risk.
Credit Risk:
Credit Risk is the risk which explains that a borrower may fail to make timely payments of interest or principal that he previously borrowed. Credit Risk has 2 components:
A.Default Risk:
Default risk is the probability that a bond issuer or a borrower will fail to repay principal or interest when due.
B.Loss Severity:
Loss Given Default or Loss Severity is the actual amount an investor will lose if the company defaults. For example, if the default risk is 40% and the amount that you invest was ₹100, your loss severity will be 40%*₹100 = ₹40.
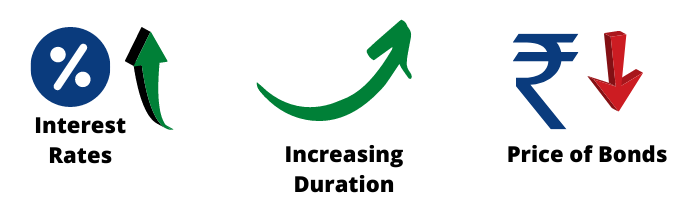
Interest Rate Risk:
When the Interest Rate of a debt instrument rises, its value decreases, which leads to a loss for its holder. Interest Rate Risk is the risk that a bondholder will face severe losses if the interest rates rise in the future. For example, if the interest rate of a bond rises then the market value of that bond will decrease, which will lead to a loss.
The Interest Rate of a Bond and its price are inversely related, i.e., when the interest rate rises, a bond’s Present Value (PV) decreases and vice-versa. This is because when the interest rates rise, all the future cash flows of that bond are discounted at a higher rate which leads to its PV being lower and vice-versa.
Diversifying our investments in bonds that have different duration can reduce interest rate risk.
We will discuss the concept of duration in the next section.
Concept Of Duration
Duration is one of the key characteristics of a fixed income security. It is used as a tool which measures the sensitivity of a bond’s price to a change in its yield.
It is important to understand Duration and Maturity are different terms and shouldn't be confused with each other.
In simple terms, a bond’s duration measures the change in its market value due to a change in its interest rates or yield, i.e., its price volatility.
The higher a bond’s duration, the more its price will fall or rise as its interest rate rises or falls.
If a bond’ duration is 6 years and if its interest rate increases by 1%, the bond’s price will drop by approximately 6% (1% X 6 years). Likewise, if its interest rate falls by 1%, the same bond’s price will increase by about 6% (1% X 6 years).
A bond’s duration can be affected by 2 factors:
1.Time to Maturity:
The longer is a bond’s maturity, the greater will be its duration, and the greater will be its interest rate risk. For example, consider 2 bonds with maturities of 5 and 7 years. The 5-year bond will pay back its principal in a shorter period of time, and hence its duration will be lower when compared to a 7-year bond.
2. Coupon Rate:
A bond’s coupon rate is also a key component in determining its duration. Consider 2 bonds that are identical in nature except for their coupon rates. The bond with the higher coupon rate will have a low duration because it will pay back the due amount faster than the lower coupon bond.
Duration And Its Types
Now that we have an understanding of a bond's duration. It is also important to learn the different types of bond's duration. So, basically there are 2 kinds of Duration which are widely used by today’s investors. They are:
- Macaulay Duration
- Modified Duration
1.Macaulay Duration:
A bond’s Macaulay duration can be calculated as the weighted average of the number of years until each of the bond’s promised cash flows are repaid, where the weights are the Present Values (PV) of the bond’s each cash flow as a percentage of the bond’s value. This concept was introduced by Frederick Macaulay and hence the name Macaulay Duration.
Let’s try and understand this concept with the help of an example:
Imagine a 3-year bond with a face value of ₹100 and a coupon rate of 5%. The bond pays its coupon on an annual basis. It also has a YTM of 6%.
To calculate the Macaulay Duration, we need to first find the Present Value (PV) of the future cash flows of this bond:
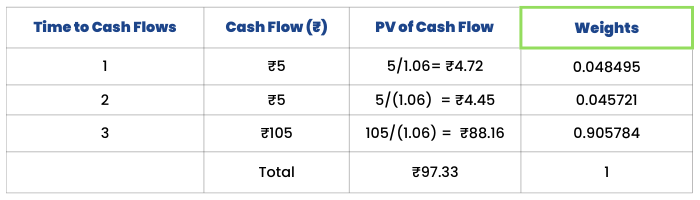
The Macaulay duration of this bond will be calculated as:
= 0.048495*1+0.45721*2+0.905784*3
= 2.587 years. This means that the bond will take 2.587 years to pay all its promised cash flows.
Macaulay Duration is one of the most important concepts in Duration.
2. Modified Duration:
Modified Duration is the modified version of Macaulay Duration, which is calculated by dividing Macaulay Duration with the bond’s YTM.
If we continue with our previous example, we will get a Modified Duration of 2.587/1.06 = 2.44.
The modified duration figure indicates the percentage change in the bond’s value given an X% change in its interest rate. Unlike the Macaulay duration, modified duration is measured in percentages.
Yield Curve
The yield Curve going up, Interest Rates are going up, therefore the debt market is going down.
Almost all of us have heard these terms recently. The problem is that many of us partially understand the Yield Curve or not understand it at all.
The first question is what exactly is the Yield Curve?
The Yield Curve is a curve which shows all the possible Interest rates of a particular debt security maturing on several dates. This curve shows a relationship between Interest Rates and Time to Maturity.
In simple terms, Yield Curve tells us what return an investor can expect from a bond if she/she invests on a particular date.
Just like we have Sensex and Nifty for stock markets in India, the Central Government Bonds, which are known as G-Sec and are 10-year bonds, also have yield curves. Those yield curves are the representation for bond markets in India.
For example, if the Government bonds have a yield of 5.8% today, it means that you will get a return of 5.8% if you invest in a 10-year Government bond today.
Generally, when the bond markets fall, yields go up and vice-versa.
Overall, if you check the 25-year yield curve, you will see that the yields are consistently falling over a period.
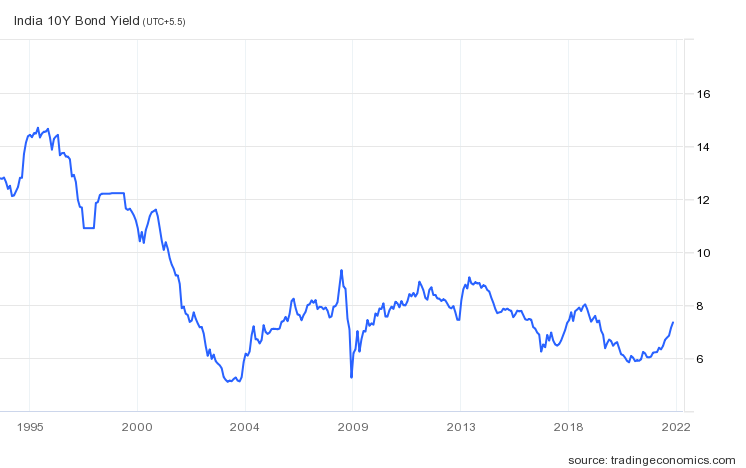
Once upon a time, the yields were close to 14.69%. Today, the yields are close to 7.3%.
An important note is that when an economy goes from a Developing Economy to a Developed Economy, the yields that country offers on its Bonds start to decrease. For example, if you see the US’s bond yields, they are just at 1.5% today. Whereas previously they were very high.
Now, let’s look at the 10-year chart:
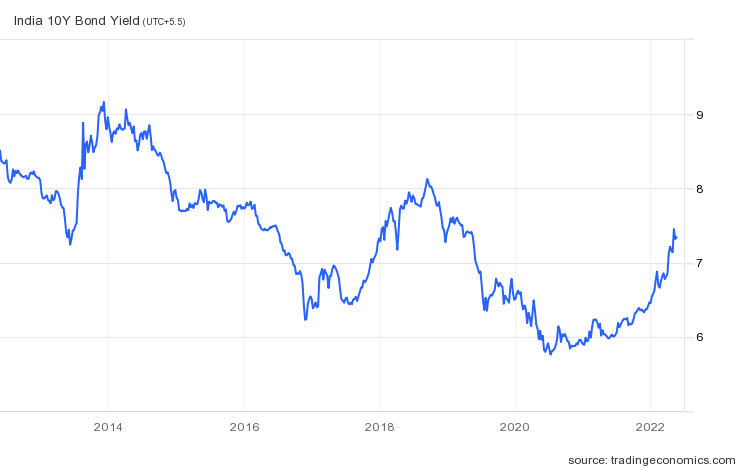
After looking at the 10-year chart, we can understand that in 2014, the yields topped out a range of 9%.
The range for the 10-year yield curve is 9%-6.5%. Near 2020, the yields bottomed out at 6-6.5%.
The latter part of 2020, and 2021 are times of the Covid pandemic, because of which the yield curve hasn’t moved naturally.
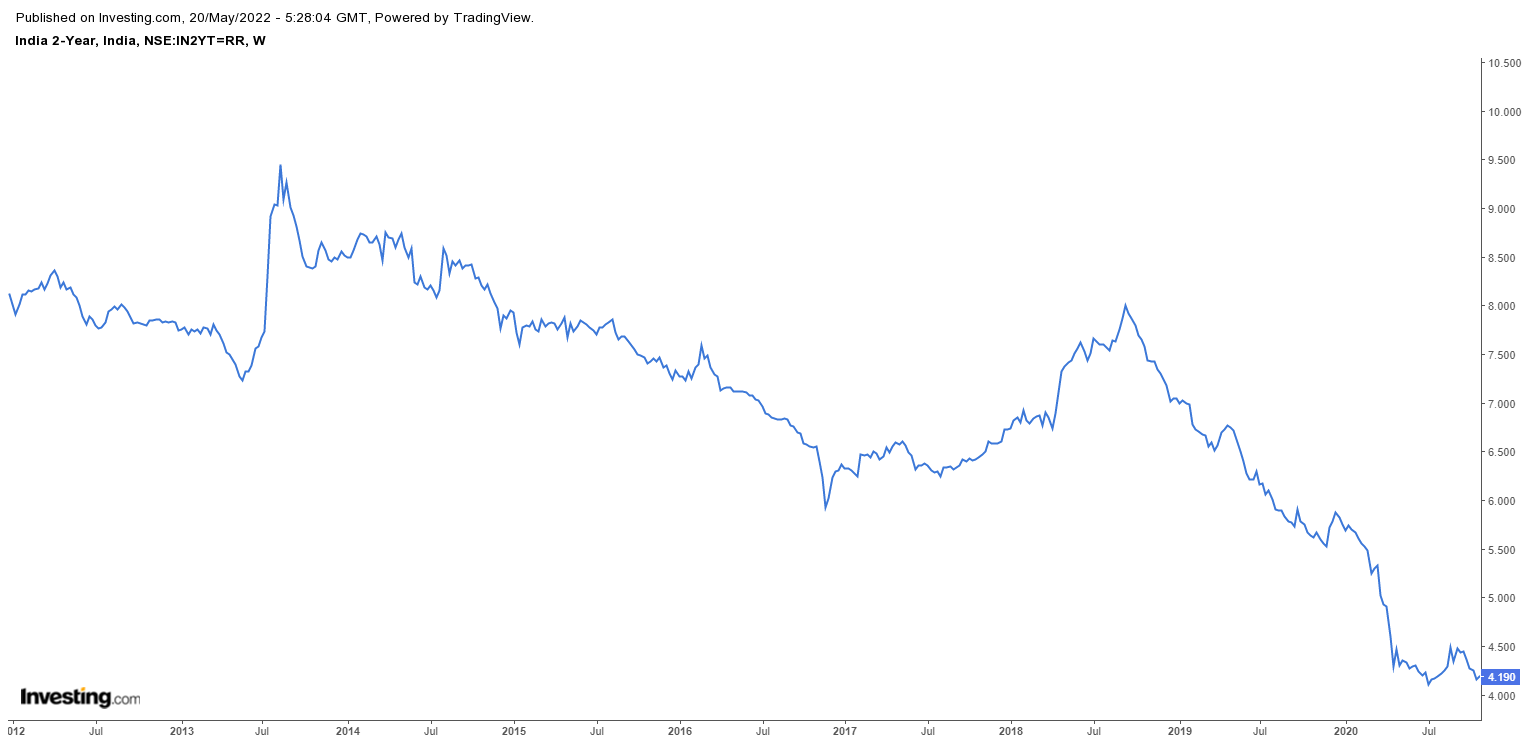
Let’s look at the 5-year data now:
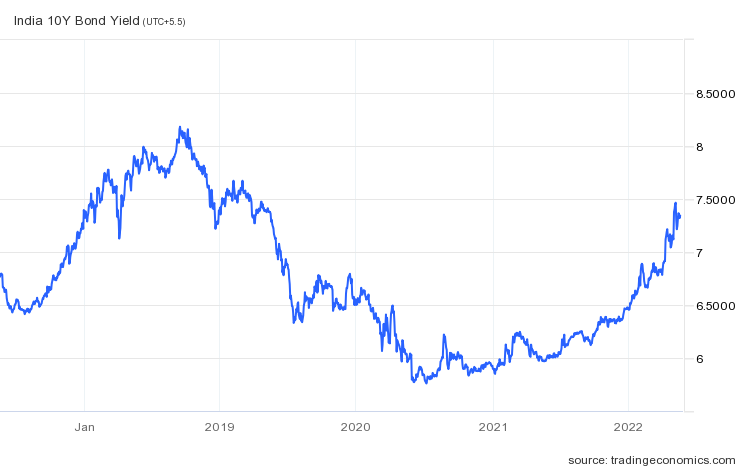
In the 5-year data, the yields have topped out at 8% and bottomed out at close to 6%.
Yields move in a range over a period of time. Each time a topping out and bottoming out process of the Yield Curve takes place, the yields keep on declining.
Now if we try to predict the yields of the next 5 years, we can never be sure.
Investing in a low duration fund when yields have bottomed out, and investing in a high duration fund when yields have topped out makes total sense because when yields go up, the bond value goes down.
This is why where yields have bottomed out, investing in a low duration fund or bond should be the best option.
Covid Pandemic Case study
In this section, we will explain what exactly has happened in the bond markets in the past 1-year, and what can we expect from the Indian Bond Markets in the near future.
Now, as soon as COVID-19 Pandemic took over the world, there was an economic crisis.
During such times, the Central Bank tries to protect people’s jobs and does everything in its power to protect the economy from entering a recession.
The first thing RBI did in India was to lower the interest rates.
Lowering of Interest rates lowers the burden for Corporates and retail, this in turn increases the amount of loans taken , which is then circulated in the economy and hence gives a push to the economy.
If we take a look at the major economic downturns from 1992 to 2008, the methodology of lowering interest rates has been used by almost every central bank and this time also the same thing happened.
As we all know The United States of America has the strongest economy in the world. The U.S. invests its money in the emerging markets across the globe.
However, as soon as COVID started affecting the U.S. economy, they started using a stimulus package.
What is a stimulus Package?
A Stimulus Package is a package through which liquidity is pumped into an economy.
1.The 1st step taken up by the US was to transfer money directly into the common people’s bank account. First $900 and then $1400 was put directly into everybody's bank account. Pumping this money did not have a major impact on the broader economic activity of the country.
2.Secondly, they gave cheaper loans to corporates and industries at almost zero, which basically means that corporations now had the power to take a loan by paying negligible interest.
3.Other banking institutions, such as NBFCs had previously purchased bonds from the Government. The U.S. Government purchased back all the bonds it had given previously to those institutions. From the past few months, the US government is purchasing back almost $120 billion worth of bonds every month.
So once the cash crunch was taken care of,people had surplus money to invest.
Since Fixed Income Securities offered low interest rates as close to 0, alternatively people started to redirect their investments in riskier asset classes like equity. This gave huge liquidity inflow to equity markets in the pandemic.
Now the question arises, what makes Indian equity markets rise so much? The answer is simple, to inject money, the U.S. Government printed a lot of fresh money. The huge supply of Dollar made it weak against Indian Rupee.
As the value of the Indian Currency was rising for the foreign investor, Foreign Institutional Investors started investing in the Indian Equity markets because now they were getting better returns on their investments, as currency was an added advantage .
The image below shows the yearly money inflow and outflow of the FIIs in the Indian equity markets.

You can visit StockEdge to check FII/DII activities on a daily, monthly, and yearly basis.

Gradually as vaccines were discovered , there was a hope of an economic revival.
Once the economy revives, jobs will come back, people’s spending levels will be back to normal and this will ultimately give rise to inflation. If inflation rises, the Central banks will gradually start increasing the interest rates on bonds again.
Important thing to note is , neither RBI nor the Fed have increased their Repo Rates. The interest rates haven’t gone up, but the equity markets have already assumed that the interest rates will go up and that is why the YTM of different bonds have also gone up.
Another reason why the yields have gone up, because various institutions have started to sell bonds in this positive expectation scenario.
As new bonds are sold in the markets, the yields start going up and vice-versa.
When yields go up, the Longer Duration Bonds will have a bigger impact than the Shorter Duration Bonds.
Currently the US Government Bond yields have gone up by 80 bps, and the Indian Government Bond yields have gone up by 40 bps.
The reason that the US bond yields have gone up more when compared to the Indian Bond yields is because everyone’s expecting the U.S. to recover faster than India because it is a stronger country . The RBI is trying to stop the Yields from going up in India by implying 3 methods:
1.Open Market Operations (OMO):
OMO is a simple tool by which RBI is buying bonds it sold previously. This is creating an artificial demand for bonds. Since, the Government bonds have a duration of 10-years and those are longer duration bonds, only the longer duration bond’s yields are getting impacted. The shorter duration bond’s yields are still rising.
2.Operations Twist:
Since the shorter duration bonds aren’t getting impacted by OMOs, RBI is doing something called the Operations Twist.
To understand this we need to take an example. The Reverse Repo Rates in India are around 3.5%, which means that RBI is taking loans from banks at a rate of 3.5%. Since, RBI is the source of printing money in India, any other company or institution in India which wants to take a loan has to pay an interest rate of more than 3.5% because the credit risk of an HDFC Bank is more than the RBI, but because there was so much money available in the markets, a company like Reliance Industries was able to borrow at a lower rate than the RBI. Reliance has issued CPs at a rate of 3% when the RBI is issuing the same CPs at 3.5%.
Due to this mismatch, RBI through a tool called Operations Twist, purchased all the 10 year bonds because of which their yields rose, but sold all the shorter duration bonds, because of which their yields fell down.
Through Operations Twist, RBI managed to neither increase nor decrease the liquidity in the markets, whereas through OMO, they were only increasing the money supply in the markets.
3.Bond Auction Cancellation:
Lastly, we saw many of the bond auctions getting canceled. For example, the Government of India wants to borrow ₹12 lakh crores. When the Government wants to borrow, several auctions take place where the Government invites institutions to bid. If the Government wants to borrow at 6.2% and the institutions started bidding at 6.5% or 7%, the Government started canceling those bids. They only accepted bids that were around 6.2%.
Through all these efforts, the RBI is trying to control the rates, but the question is for how long can they sustain this?
The answer is not very long at all.
The main reasons for this are:
1.Growth in the economy will lead to inflation.
2.Higher oil prices will lead to inflation.
3.RBI will try to manage the ₹/$ relationship and the only way to do that is by increasing the yields.
Conclusion
So, we have come to the end of this module. Hope you got a fair idea of what the debt market is and how you can invest in debt securities depending on the economic situation of the country as we studied in the case study. Do remember that the Debt market is quite different from the regular stock market. So, market dynamics work very differently. There are many debt market funds which are available in the market where one can go and normally invest like any mutual funds. Therefore, keep learning and keep investing in the market; whether it is debt or equity, both will be fruitful in the long term.


