Guide to Mutual Funds
Introduction: Mutual Funds
All of us want to grow our hard-earned money, isn’t it?
For a long time, fixed deposits were the most popular investment instrument. However, the low interest rate hardly makes our savings ‘grow’ so to say. Of course, there are other financial instruments such as shares, bonds, and gold where our money can grow faster. But not all of us have the knowledge to invest in these products.
And this is where a ‘Mutual Fund’ becomes our friend.
What is a Mutual Fund?
Let’s start at the very beginning and understand what a mutual fund is.
There are innumerable investors in the world who want to invest but lack the knowledge of different financial markets or instruments to manage their money. A mutual fund collects money from all these investors and invests in the right instruments to help the funds grow. The investment is handled by a professional fund manager who has years of experience in financial markets.

100,000 / 28.45= 351.49 units
(351.49 X 53.09) = ₹18660.60
How Does a Mutual Fund Investment Work?
As we mentioned in the last chapter, the AMC collects money from different investors and invests that fund in various financial instruments.
The fund manager, in turn, creates a portfolio of stocks, commodities, bonds, etc. keeping in mind the mutual fund’s investment philosophy, market conditions, the future performance of companies and other factors.
From time to time, the fund manager also realigns the portfolio, as per his judgement. He/she will buy some new instruments and sell some old ones to improve the profitability of the fund. Your mutual fund investment will benefit from this realignment if the market moves favourably and vice versa.
Ready to master advanced commodity and forex trading? Enroll now and unlock the secrets of successful investment strategies!
How Does an Investor Earn from a Mutual Fund?
There are two ways in which an investor can earn from a mutual fund:
1. Capital Gains: As the prices of the securities in a mutual fund investment plan goes up, the benefits are passed on to the investor. In turn, your investment will grow in value.
But that’s not all!
2. Dividend Income: When a mutual fund investment makes a profit during the year, the profit is passed onto the investors as dividends. Some mutual funds pay dividends at regular intervals, which can create a regular flow of income. However, this is an optional feature. You may choose not to receive dividends and reinvest the dividends back into the fund itself.
What are Growth and Dividend Option in Mutual Funds?
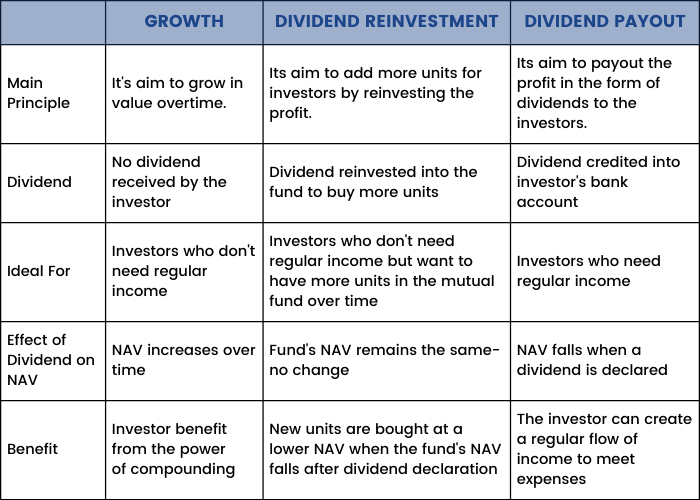
While you invest in mutual funds, you will come across three options - growth, dividend payout, and dividend reinvestment. Let’s understand this in more detail:
Growth Option
In a growth option, the profits made by the mutual fund scheme are reinvested in the scheme to generate more profit. Thus the fund grows faster since it benefits from the power of compounding. If you don’t need regular income from your investment, this is an ideal option for you.
Dividend Option
In this option, profits made by the mutual fund scheme are paid out to the investors at certain intervals. Most mutual funds pay dividends yearly. However, some may pay quarterly, monthly, and even daily. This option is ideal for people who need regular income, such as retirees.
The dividend option again comes with two sub-options:
1. Dividend Payout: This is where the dividend is paid directly to the investor’s bank account.
2. Dividend Reinvestment: In this option, the dividend is reinvested back into the mutual fund investment plan to purchase more units. Thus, your total number of units will increase over time.
Growth vs Dividend Reinvestment vs Dividend Payout
Different Types of Mutual Fund Schemes
Now that we know how does a mutual fund works let us discuss how they can be categorized on various parameters:
Based on Maturity Period
There are two types of mutual funds based on lock-in period – open ended mutual fund and closed ended mutual fund. These have been discussed in detail in chapter 4 of this module.
Based on Investment Objective
Every investor has an investment objective, so does a mutual fund. Based on investment objective, mutual funds can be divided into the following categories:
1. Equity Funds/Growth Funds
As the name suggests, these mutual fund schemes invest a majority of their money into the stock market, intending to achieve long-term capital growth. These funds invest at least 65% of their corpus into equity and equity-related instruments. As most of the investment is made into equities, the risk profile of these funds is higher.
Equity mutual funds, in turn, can be of various types based on where they invest. We have discussed this in detail in chapter 15 of this module.
2. Debt Funds/Income Funds
Debt funds have the majority of their investment (at least 65%) in debt related instruments such as bonds, debentures, government securities and money market instruments. These funds have a lower risk profile than equity mutual funds since debt products are less volatile than equity instruments. However, the returns of these mutual fund schemes are also considerably lower.
These funds are ideal for people who have a lower risk appetite.
3. Hybrid Funds
Hybrid funds invest in both equity and debt instruments and aim to seek a balance between risk and return. They generally invest around 60% in equities and 40% in debt instruments. They usually generate more returns than debt funds but have a lower risk profile than equity funds as well.
These funds are ideal for investors who want to participate in the equity market but do not want to take a lot of risk on their investment.
We have discussed these three kinds of mutual fund schemes in more detail in module 3 of this course.
4. Gilt Funds
Gilt funds invest only in government securities. These funds carry almost no default risk since the issuer of the securities is the government and hence the chances of default are almost none. However, these funds are subject to interest rate risk as the interest rate moves up or down with time.
Apart from the funds discussed above, there are a few other kinds worth mentioning:
5. Equity Linked Savings Schemes (ELSS)
These mutual fund schemes provide tax deductions under Section 80C of the Income Tax Act, 1961. These funds have a mandatory lock-in period of 3-years. However, a purchase can be made anytime. These funds primarily invest in equities with the objective of providing capital appreciation over time.
6. Sector-Specific Funds
These funds concentrate on a particular sector and aim to benefit from its growth. It can be any sector such as pharmaceuticals, infrastructure, IT, etc. Investment is made in multiple companies of the same sector. These funds have a higher risk profile since their return is directly related to the performance of that particular sector.
7. Index Funds
These funds follow a specific index such as the S&P CNX NIFTY or the BSE SENSEX. The fund’s portfolio replicates the portfolio of the index, with similar weights. Thus, the returns of these mutual fund schemes are more or less similar to that of the index.
How Can a Customer Invest in Mutual Fund
Customers can invest in Mutual Funds in two ways:
1. Open ended mutual funds
2. Close ended mutual funds
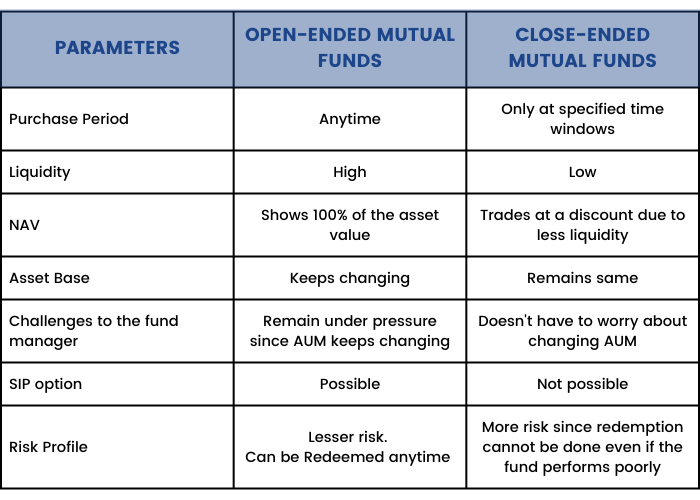
Open-ended mutual funds
As the name suggests, open-ended mutual funds are available for investment and redemption at all times. These funds offer maximum liquidity and flexibility, making them the most common choice for mutual fund investment. These funds neither have a maturity nor a lock-in period. They are open perennially. Purchase and redemption can be done at the prevailing NAV (explained in chapter 9). Since these funds remain open, investors can opt for lump-sum purchases or a Systematic Investment Plan (SIP), making it a convenient way to invest in mutual fund schemes (explained in chapter 20).
An open-ended mutual fund is highly liquid, providing an investor with the opportunity to make the most of their investment.
An open-ended mutual fund is highly liquid, providing an investor with the opportunity to make the most of their mutual fund investment. Since it can be redeemed at any time, if a fund does not perform as per an investor’s expectations, he/she can always exit and invest the money somewhere else to earn better returns.
But herein lies a disadvantage of these funds. Due to frequent purchases and redemption, the AUM keeps changing which poses a challenge to the fund manager in implementing his financial strategy.
Close-ended mutual funds
Close-ended mutual funds have a specific lock-in period during which neither purchase nor redemption is allowed. These funds open for a specific window of time for investment as a new fund offer (NFO). Then the fund closes down for a specific tenure. The money can be redeemed after this tenure gets over. Sometimes, even during the lock-in period, close-ended funds may open for a few days during which investors can purchase new units. Existing investors may also redeem and exit during these windows.
However, these kinds of liquidity windows are provided solely at the discretion of the fund manager, depending on the asset requirements of the fund.
In a close-ended mutual fund, investors can redeem only at predefined dates. Hence, the fund manager has a stable AUM to work with and sudden redemptions do not affect his decision making. This helps the fund manager to execute his strategy more efficiently.
However, this may be a disadvantage for investors. Even if the fund performs poorly, they do not have the option to exit unless the liquidity window is offered. This can result in an opportunity loss and can be detrimental in the long run.
A close-ended mutual fund may be listed in a stock exchange where it can trade at a higher or a lower price than its prevailing NAV. This provides interested investors with an option to enter or exit even though the liquidity window is not open.
Open-ended Mutual Funds vs Close-ended Mutual Funds
Fundamental Attributes of Mutual Fund Scheme
Let’s explore the fundamental attributes of a mutual fund scheme. Here, you will understand the meaning of fundamental attributes, their key elements, and the change process in fundamental attributes of a mutual fund scheme.
What are Fundamental Attributes of a Mutual Fund Scheme
Suppose when you are ready to invest in a Mutual Fund Scheme, what will you do first?
Obviously, you have to read an offer document that covers all the relevant information to help an investor make his/her investment decision. These essential elements are known as fundamental attributes of a mutual fund scheme.
In simple words, we can say that the fundamental attributes of a mutual fund scheme are its basic features that can affect one’s decision to stay invested in a mutual fund scheme or make fresh investments in a scheme. Understanding these attributes is crucial in selecting the best mutual fund scheme that aligns with your financial goals.
Key elements of Fundamental attributes are:
-
Mutual Fund Scheme Types: This refers to the category or classification of the mutual fund, such as equity, debt, hybrid, or solution-oriented schemes.
-
Investment Objective: This describes the goal or purpose of the mutual fund scheme, such as capital appreciation, income generation, or achieving specific financial targets like retirement planning or education expenses.
-
Liquidity Terms: These are the conditions related to buying and selling units of the mutual fund scheme, including the lock-in period (if any) and any associated exit loads or penalties.
-
Terms of Issuance of Units: This covers the terms and conditions regarding the issuance of units of the mutual fund scheme, such as minimum investment amount, frequency of purchases, and procedures for buying or redeeming units.
Process of Change in Fundamental Attributes
Let’s assume that the mutual fund scheme wants to change a fundamental attribute, then a written communication about the proposed change is sent to each investor and newspaper advertisements to that effect are published.
On the other hand, investors have the option to exit the fund at the net asset value, without any exit load, within 30 days. Please note that the fund house needs to ensure that communication to investors is sent either by post or by email before the 30-day period starts.
Types of Mutual Funds
Mutual funds types can be categorized based on their investment objectives, asset classes, risk profiles, and other characteristics. Here are some common types of mutual funds:
Equity Funds: This category of mutual funds types invest primarily in stocks or equities. They can further be categorized based on market capitalization (large-cap, mid-cap, small-cap), sector focus (technology, healthcare, energy), or investment style (growth, value, blend).
Debt Funds: Also known as fixed-income funds, these types of funds invest primarily in fixed-income securities such as government bonds, corporate bonds, treasury bills, etc. Debt funds vary in terms of duration, credit quality, and interest rate sensitivity.
Balanced/Hybrid Funds: These types of mutual funds invest in a mix of equities and fixed-income securities, offering investors diversification across asset classes. They can be balanced based on predefined allocation ratios or dynamically managed based on market conditions.
Money Market Funds: These mutual fund types invest in short-term, highly liquid instruments like treasury bills, commercial paper, and certificates of deposit. They aim to provide stability of principal and easy access to cash.
Index Funds: These types of funds aim to replicate the performance of a specific market index, such as the S&P 500 or the NASDAQ. They typically have lower expense ratios compared to actively managed funds because they don't involve extensive research or stock picking.
Concept of AUM
Previously we have defined what AMC is? In this chapter, we will study the concept of Asset Under Management (AUM). Mutual fund AUM is integral to the universe of mutual funds.
AUM is the total market value of assets managed by a mutual fund at any given point in time. It includes the capital as well as returns earned on the capital.
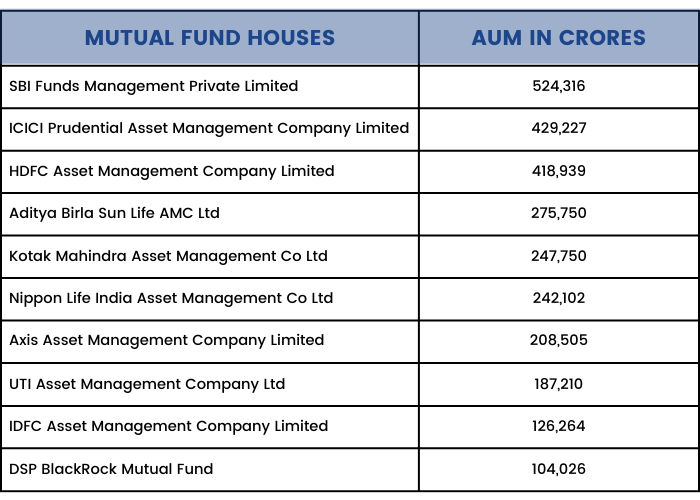
As of 31st August 2021, the average AUM of the entire mutual fund industry was ₹36,59,445 crore1. In the last 10-years (between 31st Aug 2011 to 21st Aug 2021), the AUM of the Indian mutual fund industry has grown from ₹6.97 trillion to ₹36.59 trillion – a five times increase.
AUM is a good indicator of a mutual fund’s performance. An increasing AUM indicates that the fund has been performing well and new clients are buying more units, thus injecting more capital into the AUM. A decreasing AUM means exactly the opposite – poor fund performance and redemption by investors.
Additionally, mutual fund AUM is often considered a measure of a fund’s credibility
As of June 2021, the top 10 mutual fund companies in India in terms of AUM are given below.
Should You Look at Mutual Fund AUM While Investing?
It is very common to look at the AUM of a mutual fund house and think that if so many people have already invested in it, you should do too. AUM does indicate a large client base and in general people’s trust in the found house. It also indicates that a big redemption will not affect the fund adversely.
However, AUM is not a significant factor while choosing a fund. A large AUM does not guarantee better performance. Moreover, the fact that several people have trusted a fund house doesn’t mean it will suit your requirements too.
Having said that, mutual fund AUM can be beneficial for peer to peer comparison to evaluate two or more funds in the same category. You can use AUM along with other indicators such as the fund’s historical performance, risk ratio, expense ratio, the background of the fund manager, risk management strategy, compliance, etc. for decision making.
AUM & Fund Fee:
AUM becomes important while calculating the management fee of a mutual fund, commonly known as the expense ratio. The expense ratio covers management and operational costs and is taken in proportion to the fund size.
The Securities and Exchange Board of India (SEBI) has defined the maximum expense ratio that a fund can charge and it is calculated as a percentage of the AUM. Thus, a larger AUM means more expense ratio and vice versa.
Hence, the expense ratio should also be a factor while comparing funds, since the charges you pay will affect your overall returns.
Equity Mutual Funds
We introduced various types of mutual funds in chapter 3. It is time to take a look at them in detail.
What are Equity Mutual Funds?
As the name suggests, equity mutual funds are those which primarily invest in stocks. The fund manager selects a portfolio of stocks as per the fund’s ideology. The NAV moves as per the rise and fall of the price of these shares.
Every mutual fund has an investment objective such as large-cap, small-cap, mid-cap, multi-cap, banking sector, pharma sector, etc. The asset is allocated as per this investment objective.
However, it is important to note that 100% of any mutual fund scheme is never invested in the equity market. A certain percentage is always allocated in debt and money market instruments to bring stability to the funds. However, this allocation ratio may vary from one scheme to another.
Please note: Among all the kinds of mutual funds, equity mutual funds contain the highest amount of risk. However, they also have the potential to generate the highest returns.
Who is it ideal for?
The decision to invest in equity mutual funds should be taken as per one’s risk profile, investment horizon, and other factors. For example, if you plan to stay invested for the long-term (5-years or more) and have a higher risk appetite, equity mutual funds may be the right option for you.
Different Types of Equity Funds:
Equity Funds can be categorized based on a variety of parameters:
◉ Based on investment style
1. Active Equity Funds – The fund manager actively chooses stocks based on his research, and realigns the portfolio at regular intervals for example, Axis Bluechip Fund, SBI Bluechip Fund, etc.
2. Passive Equity Funds – The fund manager creates a portfolio that mirrors a particular index (e.g.: Sensex, Nifty 50) and does not realign the portfolio unless needed. ICICI Prudential Nifty Index Growth or UTI Nifty Index Fund are examples of passive equity funds.
Active funds are more proactively managed and hence have the potential to produce higher returns. Passive funds, however, have relatively lesser risk, and ideally, the return should be similar to that of the index they are mirroring.
◉ Based on market capitalization
1. Large-cap funds – These funds invest at least 80% of their AUM in large, well-established companies and thus offer stable returns with relatively lesser risk.
2. Mid-cap funds – These funds invest at least 65% of their AUM in medium-sized companies.
3. Small-cap funds – These funds invest at least 65% of their AUM in small-sized companies.
Please note: Large-cap funds have a relatively lesser risk profile among these three types of funds and offer stable returns. However, they may offer slower growth. On the other hand, Mid-cap and small-cap funds invest in companies that have growth potential and can offer higher returns. But they contain higher risk too.
Some funds may choose to invest in more than one category so as to offer investors the option of stability and growth. For example, SBI Large & Midcap Fund, Tata Large & Midcap Fund, etc.
4. Multi-cap funds – Multi-cap funds can invest in companies of all sizes. However, they need to invest at least 25% each in large, mid, and small-cap stocks.
5. Flexi-cap funds – These funds were introduced recently and have the flexibility of investing in companies of any market capitalization, but unlike multi-cap funds, these funds do not need to invest any minimum amount mandatorily in companies of certain market capitalization.
Benefits of Equity Funds:
Debt Mutual Funds
A debt mutual fund invests in fixed income securities such as government and corporate bonds, treasury bills, commercial papers, and others.
These instruments have a predetermined maturity date and an assured interest rate. Hence, these are called fixed-income instruments. Since these instruments assure a fixed income, they have a low-risk profile.
How do they work?
The main objective of debt mutual funds is to generate returns by investing money in fixed income securities. The returns generated by debt funds are linked to the yields of these fixed-income funds.
Since debt instruments are subject to default risk, most fund managers try to focus on bonds and papers with high credit value or those issued by the government.
Please note: Although debt mutual funds invest in fixed-income instruments, there is no guaranteed return. The returns remain in the expected range.
The NAV of debt funds rises and falls as per the interest rates of debt instruments in the economy. In fact, the two are inversely proportional as in when interest rates rise, the NAV of debt instruments fall and vice versa.
Who is it Ideal For?
Debt mutual funds are ideal for investors who are risk-averse and cannot afford to lose money.
Risks in Debt Funds
Debt funds are famous for their low-risk profile. But does that mean there is no risk at all?
Absolutely not! Fund houses are exposed to three kinds of risks related to debt mutual funds:
1. Credit risk or default risk – if the issuer of the bond does not pay the interest or pay back the principal amount.
2. Liquidity risk – risks of not having enough liquidity when faced with redemption pressures.
3. Interest rate risk – arising out of changing interest rates in an economy.
As an investor investing in schemes offered by fund houses, you are exposed to the above risks as well.
Types of Debt Funds
Debt funds can be of various types:
Liquid Funds – These funds invest in money market instruments with a maximum maturity of 91 days. They offer better returns than a savings bank account and are ideal for investing those funds that you do not need in the short term (3-months or less).
Money Market Funds – These funds invest in money market instruments with a maximum maturity of 1-year. These funds invest in low-risk debt securities.
Dynamic Bond Funds – A dynamic bond fund invests in debt instruments with varying maturity depending on the interest rate forecast of the economy. The instruments can have a maturity ranging from 1 to 5-years. They have a slightly higher risk profile than liquid funds or money market funds.
Gilt Funds – These funds invest a maximum of 80% of their total assets in bonds issued by the government of India. These funds do not carry any default or credit risk. Investors looking for the best debt mutual funds with Government backing often prefer these.
Corporate Bond Funds – These funds invest up to 80% of their total assets in corporate bonds with the highest ratings. Investors who are looking to invest in corporate bonds can opt for these funds to diversify their portfolios. Some of the best debt mutual funds in this category focus on AAA-rated corporate bonds for added security.
Choosing the best debt mutual funds depends on your investment goals, risk appetite, and time horizon. Whether you seek stability, liquidity, or steady income, there is a debt fund suited to your needs.
Hybrid Mutual Fund
""
Previously we have learned what Equity and Debt mutual funds are, right? Let us now discuss what Hybrid mutual funds are? As the name suggests, it is nothing but the combination of both Equity and Debt mutual funds.
Hybrid mutual funds aim to seek a balance between risk and return and hence invest in both equity and debt investments.These mutual funds are also called Balanced funds. The ratio of debt and equity depends on the investment objective of the fund. Based on an investor’s preferences and risk profile, a variety of hybrid funds are available in the market.

How Does a Hybrid Fund work?
The main objective of a hybrid fund is to have a balanced portfolio. The fund manager invests in a variety of financial instruments in varying proportions and carries out rebalancing at regular intervals to achieve the investment objective.
Who is it Ideal For?
Hybrid funds are less risky than equity funds, yet they generate more returns than debt funds. Hence, they are quite popular among conservative investors who seek to achieve a balance between risk and return. Moreover, they are known for producing stable returns over some time.
Types of Hybrid Funds
Based on whether more funds are allocated to equity or debt, Hybrid funds can be of various types:
Equity-oriented Hybrid Funds
Equity-oriented hybrid funds invest more than 65% of their assets in equities and the rest in debt and money market instruments. The equity portion can be invested in companies of any sector and any market capitalization.
Debt-oriented Hybrid Funds
These hybrid funds invest more than 65% of their assets in different kinds of fixed-income instruments such as government bonds, corporate bonds, treasury bills, debentures, etc. In addition, somepart is also invested in cash and money-market instruments to maintain the liquidity of the fund.
Monthly Income Funds
Monthly income funds aim to generate regular income by investing 15-20% of their funds in equity instruments and the rest in debt instruments. The regular income is generated through dividends from the equity instruments.
Please note: Although they are called monthly income funds, they may not necessarily generate monthly income. Moreover, they also have a growth option where an investor can choose to grow their money rather than withdraw regular income from the investment.
Arbitrage Funds
Arbitrage funds try to benefit from arbitraging – buying in one market at a lower price and selling in another at a higher price. However, arbitraging opportunities are not easy to find. In the case they are not available, these funds invest in debt instruments or cash. Arbitrage funds have been discussed in detail in the upcoming chapter of this module.

Explore the essence of benchmarks and their crucial role. Dive into our Masterclass on Advanced Commodity & Currency: Forex Trading Course now
Things to Consider with Regards to Hybrid Funds
If you want to seek a balance between risk and return, hybrid funds may be a good idea for you. Here are a few things to consider while investing in hybrid funds:
Risk factor: Hybrid funds have varying risk profiles. Equity-oriented hybrid funds are riskier than debt-oriented funds.
Return: Different hybrid funds generate different kinds of returns. So this is an essential factor to check before investing.
Investment Horizon: Typically, hybrid funds have a medium-term investment horizon of 3 to 5 years.
Tax on Gains: It is essential to know the tax implications while investing in hybrid funds. The equity component is taxed as per equity taxation rules, while the debt component is taxed as per debt taxation rules.
Solution-Oriented Schemes
In the previous section, we looked at the different types of mutual funds in India which are Equity Mutual, Debt Mutual Fund and Hybrid Mutual Fund. Now, we will focus on the solution-oriented mutual fund scheme. As the name suggests, it provides a solution for investors to achieve specific long-term financial goals.
How Does a Solution-Oriented Scheme Work?
Solution-oriented mutual funds are mostly hybrid funds. They invest in both equity and debt. Investors can invest in these funds regularly through (Systematic Investment Plans) SIPs or in one go with lump sum investments.
Generally, these funds are managed by tracking a benchmark index instead of actively choosing which stocks or bonds to invest in. Before investing, it's important to compare these funds based on what they invest in, how consistent their returns are, and the balance between risk and potential reward they offer.
Types of Solution-Oriented Schemes
Retirement Fund: An open-ended retirement solution-oriented scheme having a lock-in of 5 years or till retirement age (whichever is earlier). This is meant for long-term planning related to acquiring a corpus for retirement.
Children's Fund: An open-ended fund for investment for children having a lock-in for at least 5 years or till the child attains the age of majority (whichever is earlier). However, This is meant to invest in building a corpus for the child and their needs in the coming years.
Who is it Ideal For?
Solution-oriented funds are suitable for those who have defined long-term financial goals and want a systematic investing approach to achieve them.
However, you should check out the average predicted returns and associated risk factors before choosing to invest in a solution-oriented scheme.
Taxation
The taxation of solution-oriented schemes depends on their nature and holding period:
Solution-oriented equity schemes: These schemes are taxed as equity funds, which means the long-term capital gains (LTCG) above gains of Rs.1 lakh are taxed at 10%, and the short-term capital gains (STCG) are taxed at 15%.
Debt solution-oriented schemes: These schemes are taxed as debt funds, which means the long-term capital gains (LTCG) are taxed at 20%, and the short-term capital gains (STCG) are taxed as per the investor's income tax slab
New Fund Offer (NFO)
What is an NFO (New Fund Offer) and how does it work?
Just like a public company offers its shares to the public via an Initial Public Offering (IPO), an Asset Management Company (AMC) offers units of the mutual fund to the public via a New Fund Offer (NFO) in the stock market.
The NFO is a process which attempts to raise capital to purchase securities for the mutual fund scheme.
The AMC prepares Offer Document (prospectus) for the NFO, and after getting permission from SEBI, decides a suitable time for launch in the market. There are three relevant dates related to NFO mutual funds-
There are three relevant dates related to NFO mutual funds-
Opening Date
It refers to the date on which the fund opens for subscription to the public.
Closing Date
It refers to the date on which the fund closes for subscription to the public.
Subscription Reopening Date
After the new fund offer is over, the scheme will be open for entry and exit as it will now be a listed fund. The date at which the fund becomes available for trading in the stock market is the subscription reopening date.
Offer Document
What is Offer Document
Previously we have learned how AMC prepares an offer document for floating NFO in the market. Now let us discuss the concept of an Offer Document and its importance. The offer document is the most important document related to a mutual fund, where all the information related to the mutual fund is published by the Asset Management Company. As the name suggests, it is the offer that the AMC makes to the public.
An offer document consists of two parts:
1. Scheme Information Document (SID): The SID consists of all the information regarding the scheme such as investment objective, investment approach, the risks involved, asset allocation, fund manager, benchmark index, fees and expenses, dividends, inter-scheme transfers, associate transactions, redemption and repurchase, valuation of the assets of the scheme, tax treatment, etc.
2.
Statement of Additional Information (SAI): SAI consists of all the
statutory information about the mutual fund house.
Both these documents are submitted to SEBI as per a prescribed format. Additionally, the mutual fund can add any disclosure it feels will be important to the investor.
Things to Check in Mutual Funds Offer Document:
For
a layman, an offer document can be confusing and lengthy. Here are
the important things that you must check in the offer document before
investing.
Date
of issue of the document: To ensure that you have received the latest
offer document.
Investment objective: Different funds have different goals such as regular income, long term capital appreciation, investing for the short term. It is advisable to check what the fund aims to achieve.
Investment policies: All fund managers follow a certain strategy to achieve the investment objective. It is advisable to check the strategy to ensure that it meets your financial goals.
Minimum investment: The minimum amount may vary depending on fund type and fund house. It is advisable to check this at the beginning itself.
Risks involved: All mutual funds carry a certain level of risk. All the risks involved (interest rate risk, default risk, credit risk, etc.) are detailed in the offer document. This is the most crucial segment which every investor should look at. Invest in the mutual fund, only if the risk profile of the fund matches your risk appetite.
Fees and expenses: Fees and expenses paid by you affect the profitability of your portfolio directly. Check the different types of fees and expenses published in the offer document.
Historical performance data: The offer document will contain all the historical data regarding the fund – historic NAV, returns, dividends, etc. These data are published as per standard formulas established by SEBI. You should always check these data before making an investment decision. However, keep in mind the common disclaimer - "past performance is not an indication of future performance".
Key personnel managing the fund: Another important factor to check. Your returns are heavily impacted by the decision taken by the fund management team, especially the fund manager. Check the background of the team, see the fund manager’s previous records before deciding whether you want to invest or not.
Tax implications: Last but not the least, the tax implications of the fund will be detailed in the offer document. You should take a look at this to avoid any surprise tax payments in the future.
Types of Risk in Mutual Fund
“Mutual fund investment is subject to market risk” –we always hear this phrase whenever we talk about mutual funds, isn’t it?
In this chapter, we will take a look at the risk in mutual fund investing.
Why is there risk in mutual fund investment?
In a mutual fund, investment is made in various financial instruments – equity, debt, corporate bonds, government bonds, commodities, etc. In the case of the equity mutual funds, the price of these products rises and falls, being affected by a lot of factors.
This price fluctuation is the reason why the NAV of every fund changes daily, and this is what imparts risk to mutual funds.
Risk in Mutual Fund involves:
There are primarily six risks associated with mutual funds:
1. Volatility Risk
Equity mutual funds invest in shares of companies that are listed in the stock exchanges. As we know, the price of securities fluctuates in the market and is affected by macro and micro-economic factors.
As the value of shares goes up and down, the NAV of mutual fund schemes also changes – which is commonly known as volatility risk.
2. Interest Rate Risk
The interest rate on fixed income instruments (bonds, fixed deposits, etc) keeps changing as per rate announcements of the Reserve Bank of India. This is another risk in mutual fund investments.
How?
Let us suppose that the interest rate of 10-year government bonds is 5% today. So, a fund manager includes these within the portfolio of a guilt mutual fund scheme and invests a substantial amount in them. So, the fund gets locked in for 10-years. But, after 6 months, the interest rate on 10-year government bonds increases to 5.5%. So, naturally , they become more lucrative than the bonds issued earlier. But since the fund invested by the fund manager is in a lock-in, the fund manager has no way of taking it out and investing in the 5.5% bonds. This is the risk.
Of course, this is an overly simplified example. The situation, in reality, is more complex since bonds are traded in the secondary bond market.
3. Concentration Risk
This is a very common risk in mutual funds where the fund manager puts most of the money in one kind of financial instrument or one sector. For example, if the banking and financial services industry performs well, a fund manager may put a large chunk into that sector. However, if tomorrow, due to some event, the banking sector starts performing poorly, the entire portfolio may go into a loss.
This risk is commonly faced by sectoral funds. One way to avoid this risk is to invest in diversified funds.
4. Credit Risk
This risk in mutual funds is very commonly faced by debt mutual funds. This happens when the issuer of a particular instrument fails to pay the promised interest or return the principal on time. This is why fund managers always concentrate on bonds with high credit ratings or those issued by the government.
5. Inflation Risk
Inflation is synonymous with purchasing power. You make money only if the return on your mutual fund investments is more than the inflation rate. On the other hand, if it fails to do so, in reality, you lose money. This is known as inflation risk. As of August 2021, the retail inflation rate of India is 5.3%. Therefore, if your portfolio is growing at a rate lower than 5.3%, then you are losing money.
6. Liquidity Risk
This risk in mutual funds arises when you face difficulty redeeming your investments at the time of need. It can come in various forms. Your portfolio may be at a loss when you need to redeem your funds. Alternatively, it may be in a lock-in fund, and cannot be redeemed no matter whether they are in profit or loss.
Net Asset Value
When you decide to purchase a mutual fund, the cost of 1 unit is shown in Net Asset Value or NAV. That we all know right! But how are they calculated and what is the importance? Let us discuss the same over here.
NAV is the market value of all the securities held by the mutual fund scheme. In other words, it is the per-unit market value of all the securities held by the scheme.
Thus, it is calculated as:
NAV = Net asset value [Assets – (Liabilities + Expenses)]/ Total number of units
It is calculated every day and hence changes daily.
Usually, during the new fund offer (NFO), the NAV of a mutual fund is fixed at ₹ 10. Subsequently, when the fund’s assets are allocated, the NAV of the mutual fund continues to go up and down.
Is the NAV important for investors?
NAV is the price at which you buy a mutual fund. However, it should not be a significant factor to look at while making a purchase decision.
Why?
NAV neither reflects the future prospect of the scheme nor its potential.
It is an innate human tendency to opt for mutual funds with cheaper NAVs. However, it is important to keep in mind that mutual funds with higher NAVs have been around for a longer period and have performed well to reach such a high NAV.
It is important to remember that in investment, the potential of a fund is not linked to its price.
Alternatively, it is also important to remember that the lower NAV of a mutual fund is not an indicator of the bad performance of the fund. It is possible that the fund has been launched recently, or it is still trying to find a footing in the market.
Let us compare the NAV and return of Kotak Bluechip Fund (Growth) and Axis Bluechip Fund (Growth). Both these funds are top-performing equity funds in India.

Data were taken on 30.9.2021
As you can see from the above table, both these funds fall under the same category. But the NAV of Kotak Bluechip Fund is more than 8 times that of Axis Bluechip Fund. However, it is clear that the return of both these funds is more or less similar. One of the main reasons why the NAV of Kotak Bluechip Fund is much higher is because it was launched 7-years before the Axis fund.
Why is NAV useful for you?
There are mainly two reasons why NAV is important for you.
1. This is the buying price. NAV determines how many units you are allotted.
2. You can book your profits when NAV goes up. Hence, it is a good idea to track NAV to decide when you want to exit. On the other hand, when the NAV dips lower, your investment may be at a loss. In that case, it will be a good idea to wait for the NAV to go up before redeeming the fund.
How do mutual funds calculate the reserve for declaring dividends?
""
In the previous section, we have seen the NAV & accounting & taxation of Mutual Funds. Now, we will explore the mutual fund dividend and distributable reserves.
What is a Dividend?
Before moving forward, let’s recap the meaning of dividend. A Dividend is a distribution of profits from a stock or a mutual fund.
Calculation of the Reserves for declaring Mutual Fund Dividends
In Mutual Fund schemes, they calculate the reserve for declaring dividends based on their net income and distributable reserves.
SEBI (Securities and Exchange Board of India) guidelines provide that dividends can be paid on distributable reserves. It is important to keep in mind that the securities need to be sold for the scheme to be sure about the capital gains, i.e., the capital gains need to be realized.
Let’s understand how to calculate the distributable reserves with an example:
-
All the profits earned and realized are treated as available for distribution.
-
Valuation gains, which are the paper gains, are ignored when calculating distributable reserves. However, valuation losses are adjusted against profits to account for potential losses.
-
The portion of the sale price for new units that is due to valuation gains is not accessible as a distributable reserve.
Let’s understand with an example

This conservative approach to calculating distributable reserves ensures that dividends are paid out of real and realized profits after providing for all possible losses.
Expenses Charged on Mutual Funds
Usually, mutual funds involve several fees and charges that investors should be aware of before making investment decisions.
Mutual fund charges can have an impact directly or indirectly on the returns earned by investors and can vary depending on the type of mutual fund and the fund house.
In this section we will discuss mutual fund expenses associated with mutual fund investments. These expenses are divided into two categories.

Important Charges Associated with Mutual Fund Investments
Transaction Charges: Transaction charges are paid when you buy and sell units with a total value above a specific limit. In India, if you buy or sell mutual fund units of ₹10,000 or more, you will be liable to pay transaction charges. As per SEBI (Securities and Exchange Board of India), this charge is levied as shown in the table below:

Entry Load: It is the fee paid by investors when they make their first investment in a mutual fund scheme. Before 2009, this charge varied for each fund house in India. However, as per SEBI Mutual Fund Regulations, no entry load can be levied for any mutual fund scheme.
Exit Load: Exit Load is a penalty for early redemptions intended to prevent investors from selling their Mutual Fund shares too soon. It is charged as a percentage and applied to the redemption amount.
Suppose the exit load is 2%. If you sell your investment before the maturity period, you'll receive 98% of your redemption amount. Let's understand with an example.
Optimize your investments with our 'Direct and Regular Mutual Fund Plans' masterclass. Enroll now for our Advanced Commodity & Currency Trading Course!

Total Expense Ratio: The expense ratio is an annual charge measured as a proportion of a fund's daily net assets. It is charged by an asset management company for managing an MF scheme. Under Regulation 52 of SEBI Mutual Fund Regulation, the TER limit has been revised as follows:

What is Dividend Distribution Tax & when it is Levied?
Dividend income from mutual funds was tax-free in the hands of the investor. However, in Budget 2020, Finance Minister Nirmala Sitharaman abolished the Dividend Distribution Tax (DDT). Now the burden of paying tax on dividends is transferred to the shareholders.
Companies are not liable to pay Dividend Distribution Tax (DDT) while distributing dividends to shareholders.
What is Dividend Distribution Tax (DDT)?
According to the Income Tax Act, a company distributing a dividend has to pay a tax on the total dividend amount. This is known as the dividend distribution tax (DDT). It is a tax on dividends distributed by equity and debt-oriented mutual fund schemes.
Who is eligible to pay Dividend Distribution Tax?
Under section 115-O of the Income Tax Act, any domestic company that declares and distributes dividends is liable to pay the Dividend Distribution Tax (DDT). The company is required to pay the DDT within 14 days of declaring, distributing, or paying the dividend, whichever is earliest.
If the company fails to pay the dividend tax within the stipulated time, it will be charged an interest of 1% every month until the DDT is paid to the government.
Dividend Distribution Tax in Mutual Funds
DDT is also applicable to mutual funds:

To determine the investment goals, you have to understand the tax implications & charges.
Debt Mutual Funds
A debt mutual fund invests in fixed income securities such as government and corporate bonds, treasury bills, commercial papers, and others.
These instruments have a predetermined maturity date and an assured interest rate. Hence, these are called fixed-income instruments. Since these instruments assure a fixed income, they have a low-risk profile.
How do they work?
The main objective of debt funds is to generate returns by investing money in fixed income securities. The returns generated by debt funds are linked to the yields of these fixed-income funds.
Since debt instruments are subject to default risk, most fund managers try to focus on bonds and papers with high credit value or those issued by the government.
Please note: Although debt mutual funds invest in fixed-income instruments, there is no guaranteed return. The returns remain in the expected range.
The NAV of debt funds rises and falls as per the interest rates of debt instruments in the economy. In fact, the two are inversely proportional as in when interest rates rise, the NAV of debt instruments fall and vice versa.
Who is it Ideal For?
Debt mutual funds are ideal for investors who are risk-averse and cannot afford to lose money.
Risks in Debt Funds
Debt funds are famous for their low-risk profile. But does that mean there is no risk at all?
Absolutely not! Fund houses are exposed to three kinds of risks related to debt funds:
1. Credit risk or default risk – if the issuer of the bond does not pay the interest or pay back the principal amount.
2. Liquidity risk – risks of not having enough liquidity when faced with redemption pressures.
3. Interest rate risk – arising out of changing interest rates in an economy.
As an investor investing in schemes offered by fund houses, you are exposed to the above risks as well.
Types of Debt Funds
Debt funds can be of various types:
Liquid Funds – These funds invest in money market instruments with a maximum maturity of 91 days. They offer better returns than a savings bank account and are ideal for investing those funds that you do not need in the short term (3-months or less).
Money Market Funds – These funds invest in money market instruments with a maximum maturity of 1-year. These funds invest in low-risk debt securities.
Dynamic Bond Funds – A dynamic bond fund invests in debt instruments with varying maturity depending on the interest rate forecast of the economy. The instruments can have a maturity ranging from 1 to 5-years. They have a slightly higher risk profile than liquid funds or money market funds.
Gilt Funds – These funds invest a maximum of 80% of their total assets in bonds issued by the government of India. These funds do not carry any default or credit risk.
Corporate Bond Funds – These funds invest up to 80% of their total assets in corporate bonds with the highest ratings. Investors who are looking to invest in corporate bonds can opt for these funds to diversify their portfolios.
What is Indexation?
Indexation is a significant factor in determining investment profit or loss. By modifying the acquisition price of the underlying asset or investment, indexation reduces your total tax burden.
In simple words, we can say indexation is the cost of acquisition adjusted upwards to reflect the impact of inflation.
Indexation rates are calculated using the Cost Inflation Index (CII). Cost Inflation Index (CII) is a figure issued by the Central Government every year that represents the year’s inflation. The government provides an index number for every financial year to facilitate this calculation. Let’s check out the cost inflation index for the last 22 years.

(Source: Income Tax India)
Explore the world of hybrid mutual funds and advance your knowledge with our Masterclass on Advanced Commodity & Currency: Forex Trading Course!
Indexation benefit is available only for capital gains realized in mutual debt funds. They are available only for long-term capital gain. Tax is payable on long-term capital gains after indexation, at 20% plus surcharge plus education cess.
Risk Return and Performance of Funds
Risk and Return go hand in hand for any investment, and the main purpose of investing is to earn returns, right?
So, an obvious question for any discussion about mutual funds is how to measure returns.
Like any other financial product, the returns on mutual funds can be measured in various ways.
Here, we have discussed some common ones.
Absolute Returns
The simplest way to calculate returns is to determine how much you invested and how much you got. This is an absolute return.
For example, on 1st April 2020, you invested ₹10,000 in a mutual fund scheme. On 31st March 2021, it was worth ₹ 14,000. Thus your absolute return is 40% [(₹ 4,000/10,000)/100]
CAGR
But then, things are not so simple in real life. You will not withdraw your funds exactly at the end of 1 year.
Hence, the Compound Average Growth Rate (CAGR) is an efficient way of measuring absolute returns. It measures the rate at which your investment is growing.

So, let’s suppose you invested ₹10,000 on 1st April 2018. After 3 years, the value of your investment is ₹25,000. So the CAGR of your investment is:
 Rolling returns, however, provide a better picture of a fund’s performance than CAGR. We will discuss this in detail in the upcoming chapter.
Alpha
As we mentioned while discussing the benchmark, each mutual fund’s performance is measured vis-à-vis a benchmark. This is a great way to understand whether the scheme has performed well or not against a given standard.
The ratio that measures a mutual fund’s performance against a benchmark is known as the alpha. Alpha reflects the return generated by a scheme. Ideally, the Alpha should be higher than the Sharpe Ratio since the Sharpe Ratio measures return vis-à-vis risk-free return of the market.
When selecting a mutual fund, consider those that have consistently generated a positive alpha over time.
Sharpe Ratio
Risk-adjusted return is the return that your portfolio generates for the risk taken during the given time. It is measured by the Sharpe Ratio, which we have discussed in detail in chapter 11 of this module.
Treynor’s Ratio
This ratio measures how much excess return was generated for each unit of risk taken by the portfolio. By excess return, we mean the return earned over and above the risk-free environment. A higher Treynor’s Ratio means that the fund has generated better returns for the amount of risk taken for each unit.
Let us now see the Alpha, Sharpe Ratio, and Treynor’s Ratio of some of the most popular bluechip mutual funds:
 Data were taken on 30.09.2021
Types of Risks in Popular Mutual Fund Schemes
"Mutual fund investments are subject to market risks" is a common phrase that appears at the end of all mutual fund advertisements. It implies that the value of your mutual fund assets might rise or fall depending on market circumstances, with no certainty of good returns.
Let’s check out the different types of risks in mutual fund schemes:
Standard Risk Factors:
Investment Risks: Investing in Mutual Fund Units involves various investment risks, such as trading volumes, settlement risk, liquidity risk, and default risk, including the possible loss of principal.
Market Fluctuations: The price, value, and interest rates of the securities in which the scheme invests may fluctuate. So, the value of your investment in the scheme may go up or down based on market conditions.
Past Performance: The past performance of the Sponsor/AMC/Mutual Fund does not guarantee the scheme's future performance.
New Scheme Risk: If the AMC has no previous experience managing a mutual fund, there may be additional risks associated with the first scheme being launched under its management.
Non-Guaranteed Returns: Except for assured return schemes, the present scheme is not a guaranteed or assured return scheme.
Scheme-Specific Risk Factors:
Equity Investment Risks: Schemes investing in equities are subject to risks associated with the stock market, including market volatility, company-specific risks, and sector-specific risks.
Bond Investment Risks: Schemes investing in bonds are exposed to risks such as credit risk (risk of default by the issuer), prepayment risk (risk of early repayment), and liquidity risk (difficulty in selling bonds without affecting prices).
Foreign Securities: If the scheme invests in foreign securities, it faces additional risks, such as currency exchange rate fluctuations, political instability, and regulatory differences.
Derivatives: Investing in derivatives involves risks such as counterparty risk, market risk, and leverage risk. These instruments can amplify both gains and losses.
Securitized Debt: If the scheme invests in securitized debt, it is exposed to risks associated with the underlying assets, such as credit risk and prepayment risk.
Short Selling and Securities Lending: Participation in short selling and securities lending can expose the scheme to additional risks, including the risk of losses exceeding the initial investment.
Which Factors Affect the Returns in a Mutual Fund Schemes
Innumerable mutual funds are available in India. Hence, understanding which one is right for you can be a daunting task.
Here are a few things to look at to know if a mutual fund is right for you:
Define the risk profile
Different people have different risk profiles. In fact, the same person can have different risk profiles for different goals. You may not want to take much risk when investing your short-term funds, while you may not mind taking a risk to earn better return in mutual fund for your long-term funds.
Hence, consider the goal for which you want to invest your funds and decide the level of risk you want to take. This will define whether you should invest in equity, debt, or balanced funds.
During this step, you should also decide on the level of risk that you want to take. Let us suppose you have decided to invest in equity funds. Now decide how much risk you are willing to take. If it is less, then you may go with large-cap or bluechip mutual funds. However, if you are ready to take more risk, you may want to invest in mid-cap or small-cap funds or a combination of all these.
Historic performance of funds
Let us assume that you have decided to invest in large-cap equity funds because you do not want to take excessive risk. Again, a vast number of large-cap equity funds are available today. In some cases, the same fund house has multiple large-cap equity funds, which can make things confusing.
This is where you need to check the historical performance of funds. To do this, we suggest you look at a 3-year or 5-year time horizon rather than 1-year or less.
Looking at long-term performance will help you understand the consistency of the fund. A lot can happen in the market in a 3-year timeframe or even more. If a fund has been able to maintain its stability over the highs and lows of the market, it may continue to do so in the future as well. Check if they have outperformed the benchmark or at least have been at par – another major indicator of a fund’s steadiness.
Check the pedigree of the fund house
By investing in a mutual fund, at the end of the day, you are trusting the fund house to manage your money on your behalf. The decisions taken by the fund manager will directly affect your returns. Hence, it is important to check the pedigree of the fund house –
How long have they been in the business?
Are they renowned?
Who are the promoters?
Do they have good customer service?
Read reviews on online forums to understand the overall perception of the fund house.
Methods Used To Evaluate The Performance Of A Mutual Fund
To evaluate a fund's performance, digging out its returns is one of the most important ways. To do that, let's understand two of the most common methods of calculating returns-
Absolute returns
It’s the simple increase or decrease in the rate of return without taking the change in time into consideration.
If you've invested Rs. 2,75,000 and now the investment is worth Rs. 5,25,000, your absolute return is 90.9%.
This method works well for investments held for less than a year. For longer periods, like over a year, you need to figure out the yearly return rate, which is called annualizing returns.
Annualised returns
The Compound Annual Growth Rate (CAGR) shows how much an investment grows on average each year as if it grew steadily every year. It smoothens out the ups and downs of growth over the investment period.
How to calculate CAGR?
CAGR = [(Current Value / Beginning Value) ^ (1/# of Years)]-1
You can also use the XIRR function in Excel to find the same.
Mutual Fund Structure and Constituents
India follows a three-tier system of mutual funds with various components in it.
In the Mutual Fund structure, there are three main groups involved: the sponsor (who starts the fund), the trustees, and the asset management company (which manages the fund).
Let’s look at these in detail:
Fundsponsor
The Fund Sponsor is the initial layer in the three-tier structure of Mutual Funds in India. According to SEBI regulations, a fund sponsor establishes the mutual fund to make money by managing funds.
To be eligible as a sponsor, SEBI has set criteria:
-
The sponsor must have at least five years of experience in financial services and maintain a positive net worth for all of those years.
-
In the most recent year, the sponsor's net worth must exceed the capital contribution of the Asset Management Company (AMC).
-
The sponsor must demonstrate profits in at least three out of the past five years, including the most recent year.
The sponsor must possess at least a 40% share in the net worth of the asset management company.
Trust and Trustees
They are the guardians of the fund and the second level of this three-tiered system.
The trustee's role is vital because they oversee the mutual fund, which holds money for many investors. They make sure that the funds are managed in the investors' best interests. Although trustees don't handle daily fund management, they establish general rules and check compliance to protect small investors. Their job includes outlining AMC's responsibilities, monitoring new schemes, and ensuring compliance with regulations.
Asset Management Companies
The day-to-day operations of a mutual fund are managed by the AMC. The AMC is appointed by the sponsor or trustees, with SEBI's approval as per the trust deed.
According to SEBI regulations, the directors of the asset management company must have sufficient professional experience in finance and related fields. They and the key personnel should not have been involved in any moral wrongdoing, convicted of economic offences, or violated securities laws.
Furthermore, key personnel of the AMC should not have worked for any asset management company, mutual fund, or intermediary during periods when their registration was suspended or cancelled by SEBI.
An AMC needs to maintain a minimum net worth of 50cr and the head is appointed by the Trustee.
Brokers
Brokers play a crucial role in attracting investors and managing funds. Asset Management Companies (AMCs) rely on brokers to trade securities in the stock market. Brokers analyze market trends and predict future movements, providing valuable research reports and recommendations to AMCs for their strategic decisions.
Custodians
The custodian is responsible for looking after the fund's assets. This includes handling the buying and selling of securities for the different schemes of the fund. So, they make sure all transactions for the mutual fund schemes are settled properly.
Key Personnel of an Asset Management Company
Key Personnel of an AMC
The key personnel of an entity are those people who have the authority to plan and direct the activities of the entity.
Apart from knowing your fund manager, it is important to understand these designations of the AMC as well -
- Chief Executive Officer (CEO)
- Chief Operating Officer (COO)
- Chief Executive Officer (CEO) Head- Sales
- Head- Fixed Income
- Fund Manager- Equity
- Fund Manager- Debt
- Head- Compliance
- Investor Relations Officer
The divisions within an AMC are made on the basis of which segment of the market the fund market handles.Under each fund manager, there are analysts and other professionals who assist the fund manager with the smooth functioning of the mutual fund schemes.
Chart your financial success! Enroll now in our Masterclass on Advanced Commodity & Currency: Forex Trading Course. Understand and achieve your financial goals
Which authorities regulate the Mutual Fund industry?
There are two regulatory bodies which oversee the functioning of the mutual fund industry-
- SEBI
- AMFI
Securities Exchange Board of India (SEBI)
SEBI regulates the mutual funds as a separate segment of the stock market. It builds the rules and regulations for all AMCs and the basic functioning of all mutual funds in the country
Association of Mutual Funds in India (AMFI)
AMFI is an industry-standard organization for all mutual funds of the country. It is a not-for-profit organization that aims to spread investor awareness about the mutual funds industry.
What are the objectives of AMFI?
In the previous section, you have learnt about AMFI (Association of Mutual Funds in India)
Now, let’s understand the objectives of AMFI.
Given below are some of the objectives that AMFI has been set up:
To outline the ethical and uniform professional standards for every mutual fund operating under the association.
To encourage its members and investors to maintain ethical business practices and regulations.
To get AMCs, agents, distributors, advisories and other bodies involved in the capital market to comply with their guidelines.
To assist investors in expressing their grievances and registering complaints against a fund manager or the fund company.
To distribute information on the Mutual Fund Sector and conduct research and workshops on various funds.
To spread awareness about the regulations regarding safe mutual fund investments throughout the country.
Must know Concepts and Terms
There are numerous myths, opinions and perceptions that surround a mutual fund. This usually confuses investors and sometimes deters them from investing in mutual funds.
Instead of following opinions given by peers and relatives, investors must know the mutual fund terms and concept before making the investment.
Only then would they be able to say, Mutual Fund Sahi Hai!
Here are a few mutual fund terms which are mandatory for you to know before signing the offer document:
Investment Clause: Read the investment terms carefully in the offer document, including the minimum investment requirement and the mutual fund's investment objective.
The clause on Risk: This is one of the most crucial aspects to be read while reading the offer document. The risk associated with the mutual fund is clearly mentioned in the offer document for the investor’s reference. On the basis of your own risk appetite, the prospective mutual fund investor may choose the scheme that would fit into their requirements.
Fee component: Always remember that mutual funds are not just to make money for you but also for themselves via the fee or commission charged in due course. The fee charged consists of annual recurring expenses, management fees, servicing costs, commission, etc., that add up to the total costs.
Tax benefits:As discussed in the previous section, mutual funds provide substantial tax savings. In addition to the returns they offer, the dividend income received is subject to tax exemptions under the Income Tax Act 1961.
Other Investor Services: This clause is found at the back of the offer document, wherein the other investor services pertaining to the dividend reinvestment scheme, systematic plan, and withdrawal plan are provided for the investors' knowledge.
Facilities and services that the investors GetS
One of the most popular instruments today for investors that can give maximum benefits with minimum efforts from the investor's side is Mutual Funds.
Let’s understand some major mutual fund services and facilities that the investors get-
Investing Regularly with an SIP(Systematic Investment Plan)
One of the smartest and most popular ways to enjoy the power of compounding is through an SIP in mutual funds. You can start off with a small amount(500,1000) on a disciplined regular basis and still achieve your financial goals. The stress of timing the market also vanishes.
Easy Switch by Systematic Transfer Plan (STP)
A Systematic Transfer Plan (STP) helps spread out your investments over time, managing risk and return balance. It involves transferring funds from one fund to another. Investors often use it when they've put a lump sum in a liquid or debt fund and want to move it systematically to a balanced or equity fund.
Fund managers also use STP internally to adjust the portfolio between debt and equities during market ups and downs.
Risk Diversification
With options of having different instruments like equity, debt, bonds and more mixed-up options(Large cap, small cap), investors can have options to invest as per their financial goals, preferences and needs. Investors get the benefit of having a diversified portfolio that is managed by a market expert manager.
Transparency
Mutual fund schemes share their Net Asset Values (NAVs) daily, letting investors know the value of their units. Monthly, they release Fund Factsheets, revealing the portfolio holdings and weights of securities for each scheme.
This gives investors insight into where fund managers have invested each month.
You also get the exact details of who your fund manager is and what kind of experience he possesses.
Tax Benefits
Under Section 80C of the Income Tax Act, you can get tax benefits if you invest in ELSS (Equity Linked Saving Schemes).
This means you can save up to Rs.1.5 lakh on taxes, which is around Rs.46,800 per year. Just keep in mind that ELSS comes with a minimum lock-in period of three years.
Mutual Fund Advisors
Mutual fund advisors are professionals who assist investors in choosing the right mutual funds. They create personalized strategies based on the investor's risk tolerance, financial goals, and investment timeline. These advisors analyze the market and select a mix of mutual fund schemes that match their client's objectives.
They stay updated on market trends and help clients with buying or selling funds when needed. Additionally, they advise on adjusting portfolios by adding, increasing, or redeeming SIPs to seize opportunities or address challenges in the market.
The source of earnings is a commission that they get from the Fund House.
How can you become one?
Becoming a mutual fund investment advisor is simple. According to the rules of the Association of Mutual Funds in India (AMFI), you need to follow these steps:
-Clear the NISM series VA Mutual Fund Distributors Certification exam.
-Obtain an ARN number.
-Once you pass the exam, apply for an ARN (AMFI Registration Number) through CAMS-KRA.
-You'll receive your AMFI number and card at your registered address shortly after passing the exam.
Roles of mutual fund advisors
Mutual fund distributors evaluate investors' needs, resources, and goals and hence fill the gap between the risk and the required reward.
Create a suitable plan for asset allocation based on this analysis, and then select mutual fund schemes that fit the investor's situation.
Suggest any change that is required in the middle of the investment journey as per the goal and changes.
Types of Commission for Mutual Fund Advisors
Mutual fund distributors don't have a fixed income like other professionals. Instead, their commission depends on three main things: the company managing the assets, the specific mutual fund, and the city where the clients are from.
Let’s understand the types of Commission for Mutual Fund Advisors-
Trail Commission
Trail commissions are designed to reward mutual fund distributors for bringing in clients from cities outside the top thirty cities in India, as identified by the Associations of Mutual Funds in India (AMFI).
There are two types of trail commissions:
T-30 cities: These include the top 30 cities in India with the most mutual fund investors, such as Mumbai, Kolkata, Bengaluru, Pune, and Chennai. They can normally have a commission rate ranging from 0.2% to 2% depending on the fund house and type of fund.
B-30 cities: These are cities outside the top 30, which typically have fewer investors. Mutual fund houses actively seek clients from these cities to diversify their client base.
For clients from B-30 cities, distributors receive additional incentives known as Master B-30 incentives. These incentives are in addition to the regular commission of 0.2% to 2% and are provided for investments made during the first year.
Upfront Commission
Upfront commissions are paid to distributors when investors buy mutual fund products. This fee is taken out from the investor's investment upfront, typically ranging from 3% to 5% of the invested amount.
Eligibility to get a commission
In India, people or businesses can earn commissions from mutual funds by registering with the Association of Mutual Funds in India (AMFI) as mutual fund distributors. To qualify, they need to meet AMFI's criteria, which usually involve finishing certification courses, having a certain level of education, and meeting registration standards.
Mutual Fund Frequently Asked Questions
Here are some mutual fund FAQ for the investors
Q1. What changes are being introduced in the above SEBI circular regarding the dividend option of mutual fund schemes?
A1. As per the abovementioned SEBI Circular, whenever distributable surplus is distributed under a Dividend Plan, the AMCs are required to clearly segregate and disclose (i) income distribution (appreciation in NAV) and (ii) capital distribution (Equalisation Reserve) in the Consolidated Account Statement (CAS) provided to the investors.
SEBI has also stipulated that all the existing and proposed Schemes of Mutual Funds shall name/rename the Dividend option(s) in the following manner:

Q2. What is the purpose of the above regulatory directive?
A2. The regulatory intent of the regulatory directive is to clearly communicate to the investors that, under the Dividend Option of a Mutual Fund Scheme, a certain portion of the capital (Equalization Reserve) can be distributed as a dividend. Accordingly, the SEBI circular requires Mutual Funds to rename Dividend option(s) as per the above table.
Q3.What is the effective date for implementation of the above change?
A3. The above provisions are effective from April 1, 2021 for income distributed under ‘Dividends Option/Plan’ of a mutual fund scheme wherein the Record Date falls on or after Apr 1, 2021.
Q4.What about the break-up of dividend distribution made in the past ?
A4. The aforesaid disclosure of break-up of dividend distribution shall be only for dividends declared on or after April 1, 2021 and not for dividends declared prior to Apr 1, 2021.
Q5. Are there any income-tax implications for the mutual fund investors due to the above regulatory provisions?
A5. Currently, dividends distributed by a mutual fund are taxable in the hands of investors as per applicable tax rates. There is no further guidance available on the impact, if any, of the revised disclosures on taxation in the hands of investors. Investors should consult with their tax advisors for any further questions related to tax.
Q6.Would there be any changes in the calculations in the capital gains statement?
A6. No. Please refer to the response to Q # 6 above.
Q7. Would there be any changes with respect to TDS on dividends?
A7. No. There will be no changes and TDS on dividends would continue to be deducted on the entire sum distributed, as done currently. Refer response to FAQ 6 above.
Q8. What should the Scheme name be on the cheque/DD for purchase transactions under the dividend option/plan?
A8. If the full name of the scheme, including the option, is written on the cheque / DD, then the new naming convention should be followed, i.e., ABC Mutual Fund—Regular—Weekly IDCW*.
*Investors are advised to refer to the instructions in this regard in the respective Scheme Information Document (SID) or Key Information Memorandum (KIM) on the website of the concerned mutual fund or contact their investment adviser / MF distributor or the concerned AMC in case of any queries.
Q9. What is the implication on the cost in case of transmission/Scheme Merger/Segregated portfolio? What is considered cost?
A9. There will be no change in cost in case of transmission/Scheme Merger/Segregated portfolio.
Q10. How will the above naming convention be reflected in the CAS and MF Account statements?
A10. Please refer to Table 1 below for details

(*) Please note: TDS will be deducted @ dividend tax rates applicable both for Income distribution and Capital distribution "#" will be suffixed to IDCW, and the expansion/full name will be provided below The revised scheme nomenclature will be applicable for all historic transactions as well
(Source: AMFI)
Ready to level up your investment game? Enroll now in 'Stock Investing Made Easy' and master mutual fund investing!
What are the KYC requirements?
KYC, or Know Your Customer, is mandatory for individuals seeking financial services like opening bank accounts, buying insurance, getting loans, or investing in mutual funds. It ensures compliance with anti-money laundering laws.
Role of KYC in Mutual Fund Investing:
- Mutual funds require KYC to confirm the legitimacy of investments and ensure compliance with regulations.
- Investors must provide documents like PAN card, address proof, proof of name, bank details, and photographs.
- KYC is also necessary for joint accounts, power of attorney holders, NRIs/PIOs, and minors.
How to Complete Mutual Fund KYC:
Offline Method:
Offline KYC with KRA: CDSL Ventures Ltd. manages the KYC process for mutual fund investors. They handle customer profiling and record-keeping.
Offline KYC with Intermediary/Platform: If you're investing through a fund house or investment platform, they'll give you a KYC form if you're not already registered. They'll be registered with a KYC Registration Agency (KRA). Fill out the form, and your PAN-based KYC will be done with the KRA.
Online Method:
Online KYC with KRA: You can complete KYC online through the mutual fund house, intermediary, or platform you choose. Just fill out the online form and upload the required documents. This saves you the hassle of visiting an office.
Aadhaar-based KYC: Though Aadhaar is no longer mandatory, many investors still prefer it. Most fund houses and platforms offer Aadhaar-based KYC. After completing KYC, you'll receive a KYC identification number. Share this with your chosen investment platform to start investing.
Documents Required:
PAN Card: Your PAN number is necessary for your mutual fund KYC.
Identity and address proof: You can use documents like your driver’s license, passport, or Aadhaar card. Alternatively, you can use your electricity bills for address proof, but you'll need another document for your ID proof.
Ready to master the A2Z of Finance? Enroll now and uncover the importance of Mutual Fund SOAs!
