Intraday Trading
Introduction
“I know where I am getting out before I get in” -Bruce Kovner, Chairman of CAM Capital and one of the most successful traders in the world.
What separates the most successful traders of all time from others? It is neither any special education nor exceptional chart reading skills. Risk management is the most important thing for a successful trader apart from discipline, strategy and skill.
Intraday trading is a topic which has intrigued market participants for many years. But did you know that out of every 100 intraday traders, only 10-15 become successful?
It requires far more dedication and discipline than other forms of trading and therefore the technique and decision making for this trade should be simple and robust. In this module, we introduce a simple yet efficient way in which you will be able to assess which stock to buy or sell, and where to exit and book profits. This module will focus not only the concept of intraday trading but also how to have a systematic approach to sentiment, trend, and momentum.
“ Money cannot be made in Intraday Trading” – A common perception of most of the common people. Yes it’s a different ball game as we are time bounding our trades apart from the direction but if a systematic approach is followed, we can do wonders by having exposure to limited risks.
Genuinely speaking, Intraday Trading is a broad term. There are thousands of strategies which one can adopt. There is no such thing as wrong and right about strategies, the important thing is it should suit one's individuality. In this module, we will discuss a few time tested practices and strategies related to Intraday Trading. There are fixed parameters to distinguish between Intraday trading and other forms of trading, but intraday trading basically means visualizing the market from a shorter-term perspective.
To begin with, let’s first discuss the different types of trading.
Types of Trading
Market participants can be broadly classified into investors and traders. Traders basically focus on generating short-term income whereas investors try to create wealth through long-term investment positions.
The difference between a trader and an investor is that a trader analyses the market from a shorter-term perspective whereas an investor analyses the market from a longer-term perspective.
The process of buying and selling stocks to generate profits in a short period, i.e., usually within a month or two is called Trading.
A noticeable difference between the two acts is that investing requires thorough qualitative and quantitative analysis of a stock. We don’t exit unless there is a major change in the dynamics of that company.
In trading, however, we don’t analyse the quantitative or qualitative factors of a company, instead, we analyse the price action of a stock by studying the charts, patterns, indicators, etc.
Trading can be of three types:
1. Intraday Trading:
In intraday trading, the securities which are purchased are squared off, on the same trading session. Intraday trading can be executed in Equity Stocks, Commodities, Currencies, Cryptocurrencies, etc.
2. Swing trading:
The market moves in cycles. A person who doesn’t square off his positions on the same day and carries them on to the next few days is known as a Swing Trader. The main objective of swing trading is to capture the price swings of a stock and generate returns. Swing Trading can be of two types:
A.Short-Term: In short-term swing trading, the asset is purchased and sold within a few days. Usually, in less than a month.
B.Medium-Term: Swing trading for a medium-term is generally marked with a holding period of up to three months.
3. News-Based Trading:
In news-based trading, a trader executes trades based on news/rumors on a stock. For example, when the Reliance-Future Group deal news floated in the markets, there were rumors about this deal several days before this deal was officially announced. A news-based trader would have acted on those rumors and squared off his position when the news became official and stock prices went up. The disadvantage of this method is that news/rumors aren’t always true, plus it is more like betting and less like trading. So trading based on the news should be accompanied by other studies to get a confirmation bias.
What is Intraday Trading?
As we have explained in the previous section, Intraday or Day Trading refers to the buying/short selling of securities or other financial instruments and squaring them off on the same trading session. The people whose daily bread and butter is earned through Intraday Trades are called Intraday Traders.
It is important to note that Intraday and Swing Trading are two different dimensions of trading and a person should focus on one of them at a time.
The psychology of a person plays a very important role in intraday trading.
Another thing to note is that the strategies and the time frames that work well in Swing Trading will probably not work as well in intraday Trading.
For example, in cricket, if a T-20 match is going on, a team will take a different approach and plan of action than the one they will have in a test match. Some players can perform better in a Test Match when compared to a T-20, which is why we don’t see them frequently in a T-20 Match. Similarly, there are players (read tools and indicators) who can perform better in an Intraday strategy when compared to a Swing Trading strategy.
Advantages and Disadvantages of Intraday Trading
Now that we understand the concept of intraday trading, let us discuss some advantages and disadvantages.
There are a few reasons why Intraday Trading is considered to be a better method of trading when compared to others:
A. No overnight Risk:
The primary advantage of intraday trading is that there are no overnight risks involved. This is because all the trades are squared off on the same day they are executed. Sudden news on a stock after the market has closed will not impact our trades. Thus, any stock market tragedy, be it global or local will not be able to affect your profits on that particular day.
B.Leverage:
Most of the brokers usually allow leverage on intraday positions to 5-10 times. Leverage gives us the ability to magnify our profits by investing small amounts of money. Leverage is a two-sided sword, it can magnify our profits, but, it can magnify our losses too.
C.Short Selling:
Many indicators give a sell signal in a market. Even if we don’t own a stock, we can still sell it with an anticipation to buy it back at a lower price. An intraday trader can short sell a stock as he will be buying and squaring off his position on that particular trading session. This helps him capitalise on any bearish speculation on the stock.
On the other side, some risks of Intraday Trading are:
1.Highly Risky:
One of the primary disadvantages of intraday trading is that it is highly risky, which is the reason why most traders lose their initial capital within 2-3 months of starting this job. Risk and trade management is the key to success in intraday trading and one must learn to incorporate them mindfully.
2.Not a part-time job:
Intraday trading requires a person to sit in front of his/her desk from 9:00 A.M - 3:30 P.M, track the markets efficiently and then have a speculative bias. It requires a full-time commitment, precision and a lot of discipline which is just not possible with a part-time job.
3.Needs extreme focus, attention to detail and mental Strength:
Some traders execute trades every 15 seconds in Intraday. In that scenario, hovering off to some other work, or looking at the smartphone can make us miss a trade. A person’s attention to small details and focus needs to be very high throughout the day in intraday trading. Intraday is mentally exhausting and isn’t for everyone.
4.Volatility:
The volatility of a 5-minute or a 30-minute chart is very high when compared to a monthly or a 6-month chart. This is why it is a little easier to trade on the long-term charts.
Traits of a Successful Intraday Traders
Getting experienced in the profession of trading takes time. We have to suffer losses, evaluate our decisions daily and grow steadily. While growth takes time, we can take advantage of the traders who have already been there and done it all. Here is a list of the common attributes that are found in successful intraday traders:
- Quality Over Quantity: A quality found in many of the successful traders is that they trade less, but they trade well. One thing we need to understand as traders is that we cannot have it all. We should have a pre-filtered list of stocks and only concentrate on them while trading. If we jump on everything, we will have nothing. We shouldn't enter a trade before we’re 100% sure about the price action which is about to occur. Do not overtrade. We as humans are likely to get carried away. Setting up prior price targets will help us follow discipline.
- Stick to Liquid Stocks: Don't trade on illiquid stocks. Stocks with a volume of less than 50,000 shares per day should be strictly avoided for intraday trading. Choose stocks having low bid-ask spreads. One can trade in these stocks with narrow margins, keep your costs low, and exit positions quickly in unfavorable situations. The Nifty 50 and the Nifty Next 50 indices contain a total of the top 100 stocks that are traded on the NSE. These are also the stocks which have the maximum liquidity. We can filter such stocks for our trading list.
- Find Stocks With High Volatility: An intraday trader should choose stocks with high volatility. He should trade the stocks which have daily volatility higher than the Average Daily Volatility. There is a good probability that these stocks will show good momentum and you will get ample opportunities for trading in those.
- Patience and consistency: Patience is the key to success. There are days where we don’t get the price at which we want to trade in any of our stocks. We need to be patient and not rush into trades. One needs to be consistent with their approach. For example, if we’re using a Moving Averages strategy, then we should keep using it for a consistent amount of time and only after that we may generate profits. Switching between different patterns just because we suffered a loss in the first few attempts is not a good idea. A great deal of consistency is required to make money out of the markets, which can be achieved only with experience.
- Stick to the strategy: When everything is going in one's favour, it is easy to overhype ourselves and get carried away, but when trades go against our plans, the morale of a trader goes for a toss. Successful traders never stop believing in themselves even when the times are rough on them. A proper trading strategy should be devised and the trader must stick to it. Hopping around different strategies with each unsuccessful trade will never give desired results.
- Accuracy of successful trades are high: Lose but win more is one of the mantras of a successful trader. We have seen that many traders try to maintain a 7:3 ratio, i.e., 7 winning trades, and 3 losing trades, giving a 70% success rate. This is why a successful trader doesn’t get into a trade unless he/she is 100% sure about it.
- No loans taken for trading purposes: A trader should never borrow money from someone else to enter the equity markets. This decision is the worst thing a trader can do to himself. It is doomed to fail.
- If a trade goes wrong, book your losses and don’t cling on to hope: Booking losses as soon as we realize that a mistake has been made by us is a key attribute of a successful trader. This attribute helps them to be ruthless and limit their losses.
We will also learn some excellent intraday trading strategies in the subsequent units to help you become a successful intraday trader.
Intraday Trading Strategies - Scalping
Intra-Day trading strategies are essential when we are looking to capitalize on frequent, small price movements. A consistent, effective strategy relies on in-depth technical analysis, utilizing charts, indicators and patterns to predict future price movements. We will discuss a few trading strategies going forward in this module. Firstly let us start with the first strategy, which is 'Scalping'.
What is Scalping?
Scalping is considered as a form of an art in Intraday Trading. It is a day trading strategy where the main aim is to generate profits by buying or selling stocks/other instruments for a very short duration. It is one of the oldest and popular intraday trading strategies.
To be a successful scalper, a trader should be able to read and interpret all the short-term charts that are within the 1-5 minute intervals. They focus on tick by tick prices.
The goal of a scalper is not to make huge profits on every trade, instead, they execute many trades and generate small profits very quickly. Liquid and volatile stocks are perfect to trade in this method.
Which Time-Frames can be used?
Successful Scalpers use time frames ranging between 10 seconds to 5-minute charts.
Execution:
The first step is to understand the current view and direction of the market. Suppose, we want to initiate a trade at 9:30 A.M. We need to check the news and other events a few minutes before that, say at 9:25 A.M and anticipate how the market will react in the next 2-3 minutes. The view of a scalper is very short-term in nature.
Another key factor to execute a position in scalping is by interpreting the Open Interest (OI) Data.
Open Interest can be used to identify the trending stocks in the market as scalping doesn’t work on range-bound markets. If the previous day’s OI was high, along with price rise, it signifies that an uptrend could be seen in that stock
Which broker to choose?
To successfully execute a strategy which can last for less than a minute sometimes, and where multiple trades take place in a single session, the choice of a broker makes a huge difference.
There are two things which need to be considered while selecting a broker:
- The brokerage/commission - Some brokers provide unlimited brokerage plans, i.e., providing their services by charging a nominal fixed monthly fee. Since, scalping involves buying and selling a lot of times during a day, going with a broker who has this plan makes perfect sense.
- The trading terminal - The trading terminal should be friendly to use and should reflect the price of a stock with little to no delays. This is the only way a scalper can execute trades efficiently.
Example:
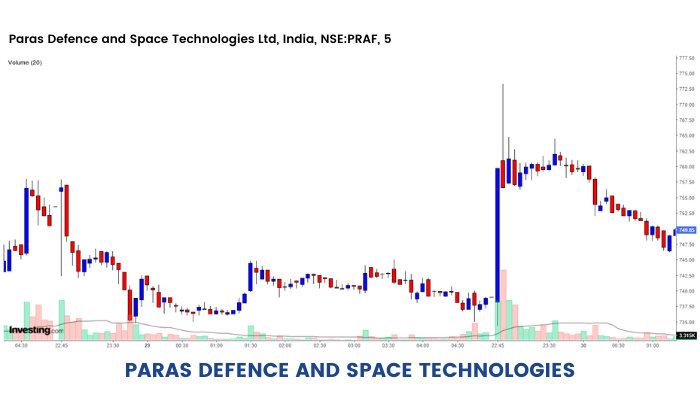
In the above image, we are looking at the 5-minute Candlestick chart of the stock: Paras Defense as of 10th Oct 2021. As we can see, the candle at 10:33 A.M, increased from ₹735.10 to ₹758.90 in just 5 minutes, making it perfect for a scalper. The trader would have ideally looked at the first few ticks of price rise, increased volumes and entered the trade to make a quick buck.
The stop loss can be few ticks below the entry level targeting a risk reward of 1:2 level. We will discuss more on Stop-loss going forward in this module.
Intraday Trading Strategy using EOD Charts
As we discussed in our last unit, Scalping is a trading strategy that can be performed for a very short period of time, like one min to five mins, but now we are going to learn another strategy that can be performed over a longer time frame.
What is this strategy?
We can initiate quality intraday trading triggers using the End of the Day charts. We filter out stocks by studying the price action of the stocks based on the daily charts, and take intraday positions on them the next day.
This strategy can be used for both Intraday and Swing Trading.
Which Indicators to use?
89 period Exponential Moving Average (EMA)
For those who are wondering, why 89, simple as it is a Fibonacci number and just seems to work a little better with the price charts. However a 100 or 50 period EMA can also be used.
The EMA primarily helps in identifying the trend of the stock. If the stock is greater than its EMA, the trend order of the stock is up and vice versa. Intraday positions should be created in line with the trend order. If the stock’s trend is bullish then try buying the stock intraday, and if the trend order is bearish, look out for selling opportunities.
Short term Relative Strength Index (RSI):
A 2-period RSI can be used to execute trades intraday. The main purpose of RSI is to identify the momentum.
How to incorporate the above 2 indicators into this Strategy?
We can go long, i.e., buy a stock when:
A.The previous day's closing price of a stock is above the 89-day EMA, (Trend order is up) on the daily chart.
B.The RSI is less than 10 and is turning upwards on the daily charts.
C.Enter on a breakout, when price crosses the previous swing high on 15 mins charts.

Stock Selection based on the Daily time frame. The stock Tata Motors is filtered out on 15th Dec 2021, based on RSI and EMA.

The trade is executed based on the 15 minutes charts on the break of the previous swing high. The blue line above depicts when the stock came under the scanner based on the daily charts and the execution is done as volume and price moves up as the swing high is broken.
The rules remain the same for a sell side trade.
A.The previous day's closing price of a stock is below the 89-day EMA, (Trend order is down) on the daily chart.
B.The RSI is greater than 90 and is turning downwards on the daily charts.
C.Enter on a breakout, when price crosses the previous swing low on 15 mins charts.

Stock Selection based on the Daily time frame. The stock Maruti is filtered out based on RSI and EMA.

The trade is executed based on the 15 minutes charts on the break of the previous swing low. The blue line above depicts when the stock came under the scanner based on the daily charts and the execution is done as volume and price moves up as swing high is broken.
The Stoploss can be kept at 1.5 % of the entry with a target of 2.5 % or 3 % move.
Pre Open Market Strategy
The next strategy that we will learn is Pre-Open Market Strategy.
What is Pre open Market?
The pre-open market is the market window which is before the normal market timings. The duration of the pre-open market session is from 9:00 AM to 9:15 AM, i.e, 15 minutes before the trading session starts and is conducted on both the major Indian stock exchanges: NSE and BSE. It helps in stabilizing heavy volatility due to some major event or announcement that comes overnight before the market actually opens for trading.
Order Entry Session: From 9:00 AM to 9:08 AM (8 Minutes)
This session enables you to place an order to buy and sell stocks. Modify or cancel orders can be made. After these initial 8 minutes, no orders are accepted.
Order Matching Session: From 9:08 AM to 9:12 AM (4 Minutes)
This 4 minutes, the exchange takes for Order confirmation and order matching.
Calculating the opening price of stocks for the normal session is done during this session. During this time, one cannot buy, sell, cancel, or modify orders.
Buffer Session: From 9:12 AM to 9:15 AM (3 Minutes)
This is known as the Buffer Session. It facilitates the transition from pre-open to regular market session.
What is this strategy?
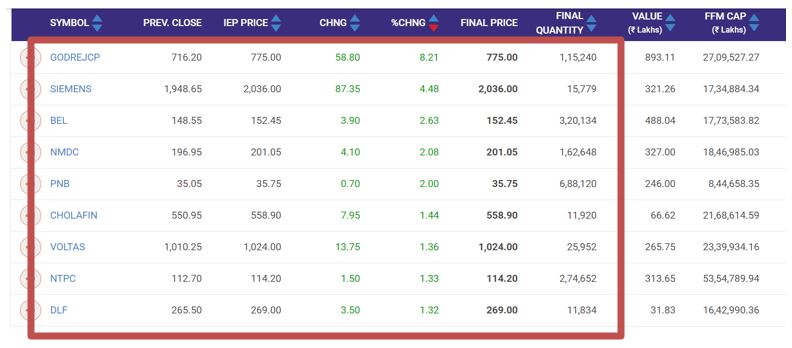
The pre-market open strategy is a strategy in which we identify stocks which have significant up or down moves during the pre-market opening session.
Stocks which have significant up or down moves, i.e., more than 1% during the pre-market opening session are filtered out for trading purposes during the normal trading session. It is assumed that the stocks which move more than 1% in either direction, will generally show momentum and trade positions can be initiated. Intraday strategy mastery for Passive Traders – transform your portfolio now!
How to identify stocks using this strategy?
There are some screeners which we should use to identify stocks in the pre-market opening session:
- Choose stock from the F&O list. This is because mostly stocks listed on the derivative segment tend to be more volatile as outstanding positions are there, hence the chances of these stocks to be in momentum is higher.
- Volume traded should be at least 10,000 in the pre-market session.
- The price range of stocks that could be selected should be between ₹100 - ₹2000. Avoid stocks whose price is lower than ₹100 or higher than ₹2000.
- VIX should be above 20.
Once we get a stock list based on the above three criteria then on market opening the first 15 minute price action needs to be closely monitored. First 15 min Price range should be more than 1.3% of Avg instrument price (average is calculated by taking the high and low prices of the 1st 15 minute candle and divide it by 2)
Trade Initiation
If all the criteria are met, buy the stock when price crosses the high of the 1st 15 minute candle. An order, 5 paise above the high price, 1% stop loss and 1% target can be entered into the system after 9.30AM.
Similarly sell 5 paisa below the first 15 minutes candle low with 1% target & 1% stop loss.
No fresh trade is to be taken after 2 pm.
Trades which neither hit stop loss or target should be squared off at 3.10 p.m.
This is a very simple intraday trading strategy based on algorithms. Once all the criteria is met, the trader can simply put basket orders for all stocks in the list.
Intraday strategy using Super trend
The next strategy that we are going to learn in this section is extremely powerful and works well in intraday trading, i.e., 'Intraday strategy using Supertrend.'
A very common problem with the intraday traders is which indicators work well for the intraday trades. There is no holy grail in the market. A trader should use technical analysis to identify trades based on different parameters. Super trend indicator is one such indicator used commonly due to its simplicity. It can give precise buy or sell signals in a trending market.
Moving average is another trend following indicator which defines the trend as well as give us precise entry and exit signals. Using both these indicators together, a successful trading strategy can be initiated.
This strategy basically comprises Super Trend and 5-20 EMA crossover. When the Super Trend turns green (i.e. Super Trend is below the price) and 5 EMA is above 20 EMA, a buy signal is generated. Similarly, when the Super Trend turns red (i.e. Super Trend is above the price) and 20 EMA is above 5 EMA, a sell signal is generated.
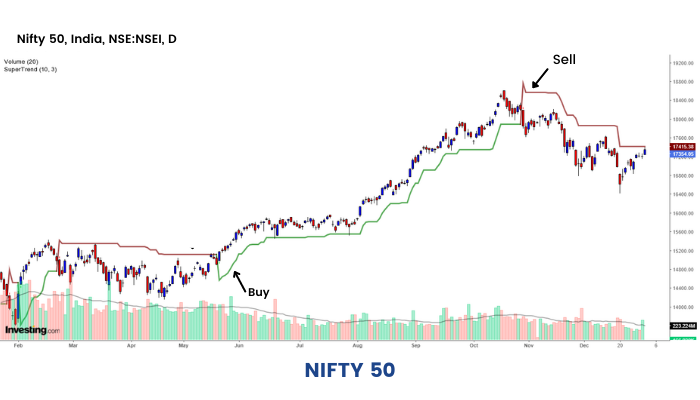
The chart above is Nifty. The buy signals are shown with the help of green arrows and the sell signal is shown with the help of red arrows. As you can see in the chart, you can really catch big moves based on this strategy and keep trailing stop loss with the help of Super Trend to protect your profits.
Stop Loss
Each intraday strategy that we discussed earlier consists of a stop loss for every trade. In this unit, we will elaborate on the topic of stop loss and its importance in intraday trading.
Stop loss in trading is a method that is used by traders to limit their losses. One should generally place a stop loss below their entry level, when they are buying the stock and above the entry level while short- selling the stock.
Support and resistance levels, Technical Indicators, Fibonacci retracement / extension levels or simple percentages are few common methods to place a proper stop loss.
The importance of putting a stop loss before entering into a trade cannot be denied by any trader.
- Helps in Cutting our losses: Stop loss in trading helps us to minimize our losses and also ensures us against a big loss. Many times, the trader suffers a big loss if he doesn’t place a stop order as the price falls steeply.
- Provides Automation: Stop loss in trading helps to automate our squaring off the position which prevents us from being present in front of our trading screens all the time. A stop-loss automatically gets triggered if the stock touches a specific price.
- Helps in maintaining ‘Risk and Reward’: One should maintain risk and reward while trading.
- Disciplined trading: It’s important to detach oneself from market emotions. Stop loss helps to stick to your strategy and also promotes disciplined trading.
Let's discuss some common mistakes which should be avoided when you place Stop Loss:
- Not determining your Stop Loss placement in advance: A trader should know where his stop loss is going to be before he takes the position. The benefit of ascertaining your stop loss before you open trade is that it removes any emotions from the decision.
- Placing your Stop Loss based on arbitrary numbers: One shouldn’t place their stop loss based on arbitrary numbers. They should determine their stop loss based on technical parameters as discussed above.
- Avoid putting stop losses on exact support or resistance levels as the chances of getting hit is higher. It could be placed a few ticks above or below the level.
Conclusion
As already mentioned, Intraday Trading is an art, a trader needs to be learning continuously to master this art. Hard work, perseverance, and determination is required to succeed in this field.
Out of all the discussed strategies, none of them are perfect because markets keep on changing. Tomorrow’s market will be different from today’s market, which is why there is no proven method of success. The key to success is trading psychology and money management. This topic will be discussed in detail in a separate module.
Since all of us are different from one another, we should keep experimenting with different strategies and develop our methods to trade. Losses are inevitable while trading, so instead of being scared of making a loss, we should learn to control our emotions and exit as quickly as we make a loss. Trade well, Trade wise!


