Magic of Moving Averages
Introduction
In this module, we are going to take a deep dive into the world of Moving averages. In technical analysis, this is one of the basic technical indicators that works at its best most of the time while analyzing the price trend of a stock or the overall market or for any other financial securities, for instance. So, moving averages are an important part of technical analysis because they help to identify the trend or direction of a stock. Not just that, it also identifies the support and resistance zone. Most traders use moving averages in different ways and try to generate buying and selling signals. It is a popular technical indicator because it can be applied to various time frames like short, medium as well as long term to analyze the trend of a stock or the overall market.
Throughout this module, we will learn the concepts, their types, uses in technical analysis and more. So without any further ado, let us start.
What is a Moving Average?
A Moving Average can be described as the average of a time series. An average comprises of data, and data with respect to stock markets signifies the market data consisting of price and volume.
Lets understand this concept in detail with the help of an example of the Indian Cricket Team. They’ve scored a certain number of runs in the last 10 games of T-20 matches. We can record the runs scored in these last 10 matches played. So in the first match, the team scored 160 runs, then 150, 210, 120, 150, 155, 140, 180, 210, 190. Now after looking at the above runs scored in the past 10 matches, Can we predict what will be the score in the 11th match approximately? Statistically, the average number of runs scored in each match is 166 runs.
So we can say most probably the approximate number of runs which can be scored in the next match would be around 166 runs.
With reference to stock prices, when we talk about prices, we divide the price into specific fields of - Open, High, Low and Close.
Normally we take the closing price of a given period while calculating Moving Averages because closing price plays a vital role in determining the psychology of people towards a stock.
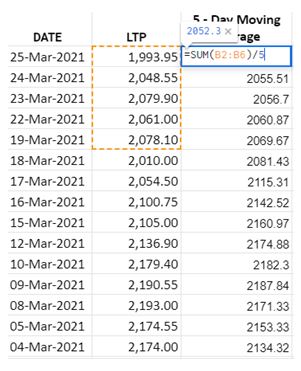
For example, we want to calculate the 5-day moving average price of Reliance Industries Ltd.
We will simply take the closing price of Reliance Industries for the last 5 days and divide it by 5.
We can plot moving averages of any time frame. We will discuss the time frame and moving averages later in this module.
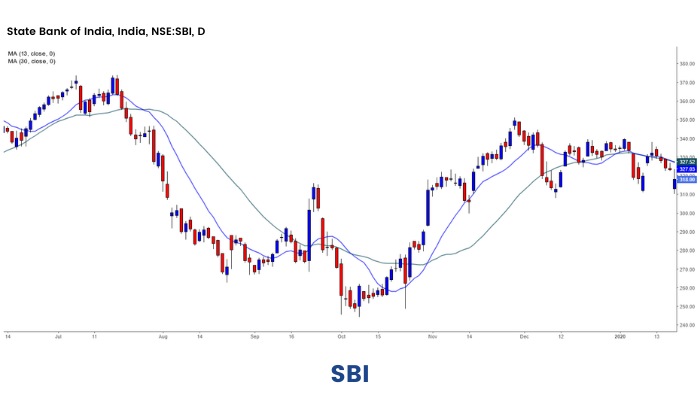
The above image shows us the daily prices of SBIN, with a 13-day Moving Average (Blue Line), and a 30-day Moving Average (Green) plotted.
We can see, the 13 day moving average of SBIN is closer to its price than the 30 day Moving Average.Hence, we can make a statement:
Smaller time frame Moving Averages are closer to the price when compared to higher time frames. Higher time frames are smoother and flatter when compared to smaller time frames.
Types of Moving Average
Now let us get back again to the cricket example and understand the different types of moving averages. If we assume that Virat Kohli didn't play the first five matches, and was there only for the last five, will it be correct to assess the probability that the 11th match average will be around 166 runs? Instead if we put up a logic, that we can give more weightage to the last five matches where Virat Kohli played, and a lesser weightage to the first five matches, then the 11th match average justifies a more logical number.
As most of us know, Technical Analysis is not just about looking at charts and patterns of a stock and coming up with a buying and selling decision. It is more about understanding the psychology of people which creates the demand and supply zone. To become a good technical analyst, we need to understand the markets and its dynamics, with the traders psychology behind the stock’s price.
We can have two broad categories of Moving Average.
- Simple Moving Average (SMA)
- Exponential Moving Average (EMA)
Simple Moving Average (SMA):
SMA is simply the mean, or average, of the stock price values over the specified period. The closing price value is usually taken for its calculation, however traders can calculate the average using the high or low prices too.
In my opinion, SMA’s are not very practical because they give equal weights to every price data point. However in real life, markets are very dynamic, the psychology of investors keeps changing every day, hence the psychology, ten days earlier in the market may not be the same as the previous day. So in order to overcome this, traders mostly use the exponential moving average.(EMA)
Exponential Moving Average (EMA):
With reference to the traders psychology and market dynamics we can say that the last day’s price of a stock should be given greater weightage than the first day. EMA uses the method of calculation where the most recent prices will have the greatest weights compared to the older prices. As the data gets older, the weights diminish. This is why the EMA gives a better picture of the average to a trader compared to the Simple Moving Average.
However it is not wrong to use a SMA, it is just that the EMA gives a clearer picture.

In the image above, 13 period EMA and SMA both have been plotted. We can see that there is a minor difference between both the averages.
Uses of Moving Averages
Let us now discuss the various uses of Moving Average.
1.Moving Average is Trend Following Indicator:
Moving Averages only work when there’s an uptrend or a downtrend in a market. They don’t work in a sideways market. Moving average is a trend identifier. One way to identify trends is by drawing trendlines. Averages are another important tool used by traders to identify the trend. If the price is moving above the moving average, it means that it’s in a positive or an uptrend. If prices are trading below the moving average it depicts that the trend is down or negative.
2.Slope:
Let's take the example of Crude Oil to understand this point. A few years ago, the price of crude oil was approximately trading at $35 per barrel. Today, the prices are around $75 per barrel. So we see that the average prices over a period of time have risen. We can say that the slope of crude oil is in bullish momentum. Since the averages themselves are rising, we can infer that the trend is upward for the asset class. If moving averages are rising, the trend is up and vice versa. We can assess an instrument's trend for short-term, medium-term and long-term through a moving average. If the price is above the 21-day period, 55-day period, 100-day period, and 200-day period, it means that the stock is in a positive trend in the short-term, medium-term, long term and very long term. This stock is positive. As long as all the four tenures are showing a positive trend, the stock is in the uptrend.
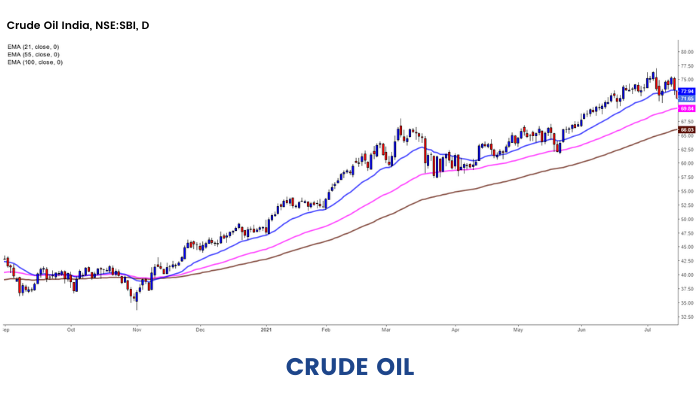
The above image shows the prices of Crude Oil, and the 21-period, 55-day period, 100-day period EMA is plotted. It clearly shows that the crude oil is in an uptrend, as the slope is up as well as prices trade above the averages.
3.Support & Resistance:
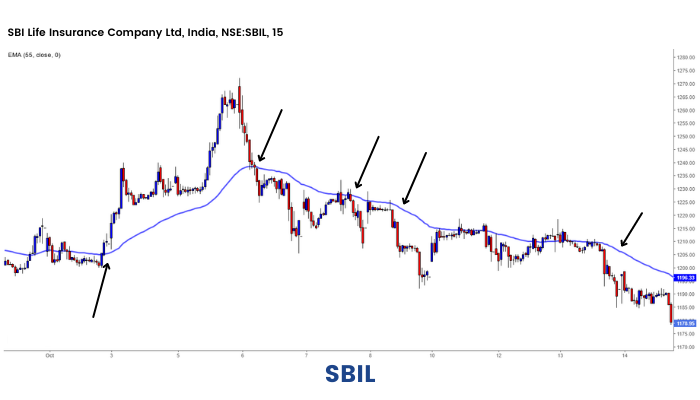
Moving averages work as dynamic support and resistance levels.It's not like the traditional horizontal support and resistance lines. They are constantly changing depending on recent price action. SImilar to the horizontal support and resistance areas, moving averages should be treated like zones or areas of interest. They depict demand and supply zones. In an uptrend, a 100 or a 200-day moving average can act as a support level. Whereas in a downtrend, it can act as a resistance level. When a trade is initiated, these averages can be used to identify the stop loss levels to the trade. It helps in managing the risk rewards. Since moving averages are dynamic in nature and they move with prices, the stop losses trail automatically with the trades.
The chart below shows how a 55 period exponential moving average works as support and resistances at different places in the 15 minute time frame for SBI LIFE.
Which Moving Average should we follow?
Previously we have covered the concept of the moving averages and their types. But it is still unclear which moving average to consider while trading? So let us understand in this section.
This is a dilemma faced by many people in the markets. Moving average is an indicator which is like the oldest priest in the temple, the more we understand the dynamics, the more we are able to comprehend prices in a better manner. We should understand that moving averages are associated with time frames.
If we are a long-term investor, we will not be worried about the 13-day average prices. The focus will be more on a longer time frame. Similarly, a short-term swing trader will look at a 5 or a 13-day moving average.
There is no definite number that tells us which moving average is the best. Some sets of moving averages work well for some people while it may not work for some. One has to access the trading style to decide which time frames to use.
The standard practice used by various traders and investors for moving averages is given in the image below.
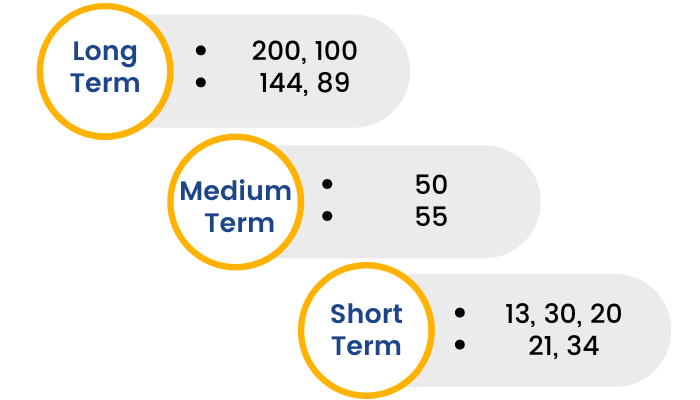
Please note that according to the Dow Theory, a 200-day moving average is considered to be a very important measure because of the simple logic that there are 200 trading sessions in a year. People also follow a 100-day moving average widely because it symbolises trading days half yearly.
As we all know, Fibonacci numbers’ importance in the study of Technical Analysis is very important. It has been observed in the past that if we alter the moving average to the closest Fibonacci number, it tends to work slightly better.
For example: There are 20 trading days in a month, and we have 21 as a fibonacci number. So we can use either a 20 or a 21 period Moving average. However, 21 periods will portray a better picture. The image shared above depicts all the corresponding closest fibonacci numbers with respect to the normal time frames. A trader can use 13, 21 and 34 periods to depict the trend in the short term and all of them are fibonacci numbers too!
Note: Don't worry if you are unaware of Fibonacci numbers. You can click on The World of Fibonacci, which we have prepared separately on Fibonacci.
Trading Signals and systems
In technical analysis, the moving averages are used to identify buying and selling trading signals. Let us learn how?
What are the different signals that a moving average can give?
1.When price crosses Moving Average:
As we have already discussed, when the price of a stock crosses its Moving Average from below to up, it is a buy signal and when the price crosses the Average from up to down, it is a sell signal. However, we must remember that trading actions are always taken with a confluence of indicators. It should not solely depend on one such signal. We should use more indicators to filter out the best possible trades in the market.

2.Crossovers:
There are triple and dual crossovers that are widely used in the markets. When a shorter-term moving average crosses a longer-term average from below, it is a buy signal.
Whereas, when a shorter-term moving average crosses a longer-term moving average from up to down, it is a sell signal.
The image below depicts the 13 - 30 day EMA crossover. It is very widely accepted and commonly used by traders in the market.

If you closely look at the above image, when the 13-Day EMA (blue line) crosses the 30-Day EMA (green line) from below to above, the price starts rising, whereas when the 30-Day EMA (green line) crosses the 13-Day EMA (blue line) from above to below, then you can see how the price started falling.
Golden and Dead Cross: These are also moving average crossover systems.
A Golden Cross takes place when a 50 day moving average (short-term average)crosses the 200 day moving average (long-term average ) from below to up. The Golden Cross signifies a potential bullish rally in the stock. It specifies the change in the momentum of the stock and the stock may rally upwards. The basic psychology is that the shorter term moving average is crossing the longer term moving average. We must also remember to check volumes at the time of the crossovers for a better confirmation and filter of trades.

The Dead Cross is exactly the opposite of a Golden Cross, where a 50 day moving average (short-term average) crosses the 200 day moving average (long-term average ) from up to down. The Dead Cross signals change in the momentum of the stock and the stock may fall down. The basic psychology is that the shorter term moving average is going below the longer term moving average - hence the change in momentum and possible trend reversal.

3.Trend Order:
Trend Order is for people who are into intraday or short-term swing trading. To identify short-term trends, we can use a Triple Moving Average System, which includes 3 moving averages. We can use a 13, 20, and 30, or a 13, 21, and 34 set of moving averages.
When the price of a stock is trading above all the three averages, it signifies that the trend order of the stock is up or the stock is in an uptrend.
On the other hand, if the prices are trading below the three averages, it signifies that the trend order is down and the stock is in a short term downtrend.
Long term traders and investors can use a combination of 30 , 50 , 100 or 34 , 55 , 89 period moving averages to understand longer term trends.
4. 6,4 offset, High Low Band:
Moving Averages are not limited to just the closing prices of a stock. They can be calculated by using the High and Low Prices also.
Let us first understand the concept of displaced moving averages to understand this trading system better.
A displaced moving average is any moving average that has all its values shifted forward or backward in time. Normally we use positive displacement or shift the average forward in time to generate some trading signals. Traders choose to displace or offset the moving averages forward in time so that it better aligns with highs or lows in price, and depict a more precise picture of market dynamics.
A displaced moving average is used in the same way as a traditional moving average. It helps to determine trend direction and order , helps forecast potential support and resistance areas and generate trading signals.
Let us discuss a trading system that generates buy and sell signals, using displaced moving averages. We 1st plot the 6-day exponential moving average by using the data points as high and low prices, and move it forward by 4 periods ( we offset the indicator by 4 periods ). So basically we will have a band of moving averages.

The 6,4 offset trading signal says that in a trending market, a buy signal is generated, when the price goes above the 6-period high (Blue line), and keep the low price (Orange line) as the stop-loss.
A sell signal is generated when the price goes below the 6-period low (Orange line), and keep the high price (blue line) as the stop-loss. One should know that the 6,4 offset theory only works in a trending market. We should avoid the use of this trading system in a sideways market.

Conclusion
Moving average is a useful indicator. The simplicity of this indicator makes it popular among most of the traders. It’s the most important tool to identify broader trends in the market. They suggest good entry and exit points while trading.
But there are no such indicators that are flawless. They all come with their own pros and cons. It's an important skill for a trader to use the moving average in conjunction with other technical indicators. One type of moving average isn’t necessarily better than others as they simply have different calculation methods for average prices. As such, our trading strategy will ultimately determine what type of Moving Average works the best.
In a highly volatile market condition, extremely short-term moving averages tend to generate false trade signals. Moreover, moving averages do not work well in choppy market conditions. They are suited to work only in trending markets. It should not be used in isolation, but if we combine other technical tools to filter our trades, high probability trade setups can come up.


