Ratio Analysis
Ratio Analysis
What is Ratio Analysis and Why is It Important?
Ratio analysis involves the method of calculating and interpreting financial ratios in order to assess the strengths and weaknesses underlying the performance of an enterprise. Ratios are expressed either as percentage, proportion or fraction. The basic rationale behind ratio analysis is that one cannot simply compare the balance sheet or income statement numbers across two companies.
As an instance, Company A’s net profit is ₹500 crores and that of Company B is ₹800 crores. Based on this statement, one cannot comment that Company B is better than Company A. It might be the case that Company B is selling goods worth more than ₹10,000 crore to earn ₹800 crores while on the other hand, Company A is just selling goods worth ₹5,000 crore to earn around ₹500 crores. As it can be seen that Company A has a Net Profit Margin (NPM) of 10% (₹500/₹5,000) whereas Company B’s NPM stands at 8% (₹800/₹10,000)
Thus, we bank on ratios to compare the income statement and balance sheet numbers across companies & industries. Similarly, it becomes difficult to track the year-on-year (YoY) performance in absence of financial ratios. Thus, ratio analysis helps to do both inter firm and intra firm comparison.
There are Two Main Types of Ratio Analysis:
- Cross-sectional Analysis: In cross sectional analysis we compare the financial ratios of the underlying firm against its competitors and also against the industry average at a single point of time rather than over a period of time.
- Time Series Analysis: In this type of analysis we compare the ratios over a period of time and observe the variations.
One of the most important facets of ratio analysis lies in the selection of an appropriate comparable. The two companies whose ratios are compared should be of similar size/business model.
It is never justified to compare the ratios of Reliance Jio with that of MTNL. Despite the fact that both are telecom operators, Reliance Jio is one of the largest telecom players in India and MTNL, on the other hand, is a small regional player. However, the ratios of Reliance Jio can be easily compared to the ratios of Bharti Airtel because of the similar size of their businesses.
Thus, the selection of the appropriate benchmark ratios is one of the keys to do successful ratio analysis.
Why Benchmark Ratios?
- Ratios by themselves do not provide answers to analysts' questions directly.
- When ratios are compared with benchmark ratios, they provide insights that help to ask the right questions.
- It may not be an exaggeration to say that the quality of ratio analysis depends largely on the analyst's ability to determine appropriate benchmark ratios.
- Selection of inappropriate benchmark ratios misleads the analysts.
Example:
For example, one cannot compare the ratios of ITC and HUL even though they both are in the FMCG business.
As a matter of fact, ITC derives more than 42% of its revenues and a startling 74% of its Net Profits from the Cigarette Division in FY21.
On the other hand, HUL is a pure-play FMCG company deriving over 75-80% revenue from its FMCG products. Since, the core business of both the similar looking companies is different thus one cannot compare the ratio of ITC with HUL.
In ratio analysis, some major types of financial ratios that analysts use are classified as:
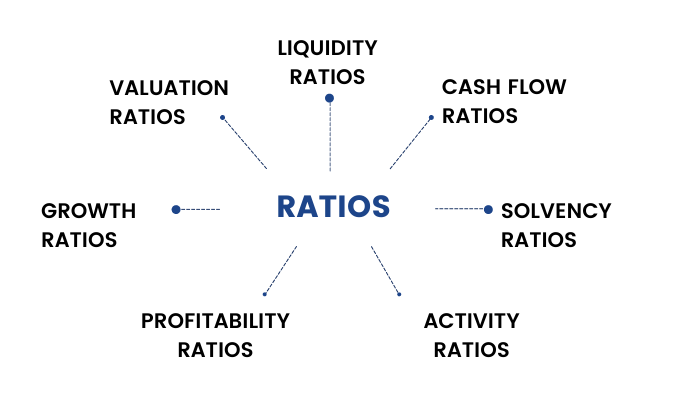
We will learn each of these ratios & their usefulness in our upcoming units of this module.
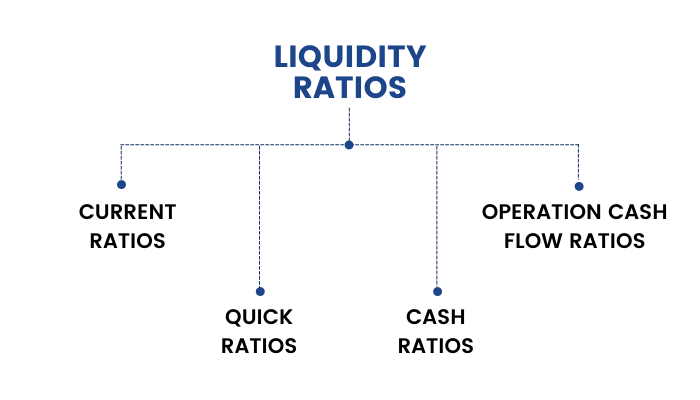
Liquidity Ratios
Firstly, let us begin with the liquidity ratios which are measures to determine the company’s ability to pay off current debt.
What are Liquidity Ratios?
Liquidity ratios measure the ease at which a company meets its short-term financial obligations from its current assets. It helps the investors and creditors to understand the company's liquidity position. It depicts how easily the company will be able to pay off its current liabilities through its current assets.
The different types of liquidity ratios include:
1. Current Ratio:
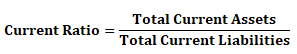
The current ratio is the ratio of current assets (cash, inventory, accounts receivable) to its current liabilities (obligations due in the next twelve months such as bills payable, share of long-term debts due for payment, etc).
In ratio analysis, a current ratio of 2:1 is considered ideal. However, this rule of the thumb varies from industry to industry. Higher the current ratio, better it is as it signifies higher liquidity (i.e., a greater ability to meet short-term obligations). However, a very high current ratio is also not good because this signifies that the company has blocked too much of its productive resources into current assets.
A lower current ratio signifies less liquidity and inability of the company to meet its short-term obligations. A current ratio of 1.0 implies that the book value of current assets is equal to book value of current liabilities.
Once again, this is not a thumb rule as there are companies like ITC and Hindustan Unilever that have a current ratio of less than one for more than the last three to five years and still they are financially stable.
This is because a very low current ratio or a current ratio of less than one signifies that the company is actually underpaying its suppliers compared to what it is receiving from its customers and thus utilizing this supplier’s money as its own equity to grow the business further.
2. Quick Ratio:

Quick ratio is a more stringent measure of liquidity than the current ratio because it does not include inventories and other assets that might not be liquid. It includes only more liquid current assets (known as ‘quick assets’) in relation to current liabilities. The higher the quick ratio, more likely it is that the company will be able to pay its short-term bills (i.e., greater liquidity).
In ratio analysis, this ratio reflects the fact that the inventory might not be easily converted into cash and the company may not be able to sell its inventory at the carrying value when needed urgently. The inclusion of accounts receivable is not a hard and fast rule. If there is evidence that it cannot be converted into cash quickly, then it can be excluded from the calculation of quick ratio.
Marketable securities are short term debt instruments, typically liquid and of good credit quality and should be considered in calculation of quick ratio.
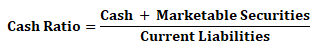
3. Cash Ratio:
The most conservative liquidity measure is cash ratio. Only highly marketable short-term investments and cash are included in the ratio. The higher the cash ratio, the more likely is that the company will be able to pay its short-term liabilities.
In ratio analysis, while creditors prefer a higher cash ratio, managers endeavor to reduce the cash ratio without impairing the operating efficiency of the company. This is because too much of resources blocked in terms of cash is a sign of inefficient capital deployment (this is because cash is a negative yielding asset whose purchasing power decreases).
Even from a creditor's perspective, increase in the other liquidity ratios may not necessarily be an encouraging sign; slow-moving and non-moving inventories may increase the current ratio but that does not signify improvement in the liquidity of the company.
4. Operating Cash Flow Ratio:

This ratio measures whether a company is able to meet its obligations from the cash flow generated out of its operations. Decrease in current assets and increase in current liabilities increases cash flow from operations.
Therefore, current ratio and cash flow from operations ratio move in opposite directions with change in current assets and current liabilities.
Let’s calculate liquidity ratios from the following information: -
Given, Cash Flow from Operations = ₹52,190

1) Current Ratio = Current Assets/ Current Liabilities
= 95390/41750
= 2.28
2) Quick Ratio = (Current Assets – Inventories)/Current Liabilities
= (95390-52940)/41750
= 1.02
3) Cash Ratio = (Cash + Marketable Securities)/Current Liabilities
= (5100+4000)/41750
= 0.22
4) Operating Cash Flow = Cash Flow from Operations/Current Liabilities
= 52190/41750
= 1.25
There are few other important liquidity ratios that can be used to determine the current debt repaying capacity of a company in case of banks-
- Credit to Deposits (%)
- CASA (%)
- Interest Expended to Total Funds (%)
- Interest Income to total Funds (%)
Cash Flow Ratios
Secondly comes the 'Cash flow' ratios that are used to determine the state of a company's finances only in terms of cash.
What are Cash Flow Ratios?
Cash flow ratios are a part of ratio analysis used to compare a company's cash flows to other elements of the financial statements. A higher level indicates a better ability to withstand declines in performance and a better ability to pay dividends to investors.

1. What is Cash Flow per Share?

Cash Flow per share is the earnings after-tax plus depreciation. This ratio acts as the measure of a company’s financial strength. Cash flow per share indicates the net cash of a company on a per share basis. Cash flow does not take into account non-cash expenses like depreciation and amortization.
The expenses related to amortization and depreciation are not actual losses paid with cash thus, re-entering them helps to keep the company’s cash flow from being artificially deflated.
This ratio is regarded as an accurate measure of the company’s financial position more than earning per share as it takes into consideration a company’s ability to generate cash. This is because cash flow is more difficult to manipulate than earning per share.
For example: - Let’s assume that during the fourth quarter, Company ABC reported cash flow of ₹40 lakhs and distributed preferred dividends worth ₹5 lakhs. During the same time frame, the company had a total of 10 lakhs shares outstanding. We calculate the company’s quarterly cash flow per share as follows:
(₹40,00,000 – ₹5,00,000) / ₹10,000,000 = 3.5
2. What is Free Cash Flow per Share?

Free cash flow simply means cash left over after accounting for operating expenses and Capital Expenditure (CAPEX). It is an important measure which shows how efficient a company is at generating cash. Investors use free cash flow to measure whether a company has enough cash after funding operations and capital expenditure to pay its investors through dividends or buyback.
Free cash flow = Operating CF – Capital Expenditure
Free cash flow per share is used to measure the company’s ability to pay back debt, buybacks, dividends and facilitate the growth of the business. This ratio analysis can also help to forecast future share prices. Increase in free cash flow and low share price indicates that the share price may rise. This is because the high cash flow per share means that earning per share should be high.
For example: - Let’s assume that during the fourth quarter, company ABC reported free cash flow of ₹40 lakhs. During the same time frame, the company had a total of 10 lakhs shares outstanding. We calculate the company’s quarterly cash flow per share as follows:
₹40,00,000 / 10,00,000 = ₹4
Click here to look at various Cash Flow scans one can use while comparing various stocks.

Solvency Ratios
Solvency / Leverage ratios are a lot similar to liquidity ratios. As we learned earlier through ratio analysis, liquidity ratios measure the company's ability to pay off short-term debts, whereas solvency ratios measure the ability to pay off long-term debt obligations of a company.
What are Solvency Ratios?
The term solvency implies the ability of the enterprise to meet future long-term obligations. Measures of long-term solvency attempt to examine a firm's capacity to meet interest and principal payments due in the forthcoming years. It provides information regarding the relative amount of debt in the company’s capital structure and the adequacy of earnings and cash flow to cover interest expenses as they come due.
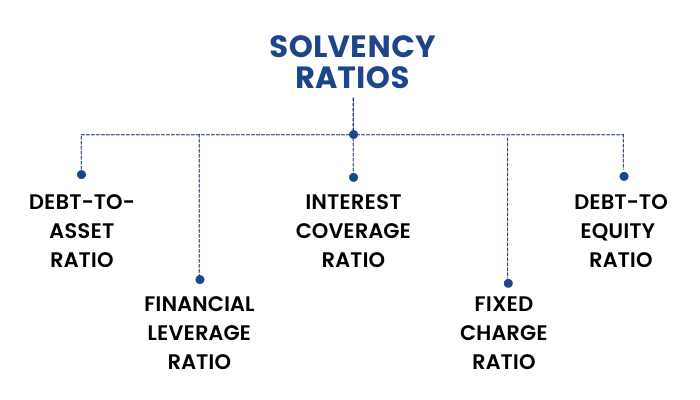
The different types of Solvency ratios are:
1. Debt-to-Equity Ratio:

This ratio analysis helps to measure the degree of indebtedness of a business enterprise.
Long-term debt along with interest-bearing short-term debt should be taken as the total debt and equity includes equity share capital, preference share capital, general reserves and surplus.
Higher the debt-to-equity ratio, higher the financial risk of leverage. However, this higher leverage also allows a successful company to increase the return to equity shareholders. It is because a company whose Return on Capital (ROC) is more than the cost of debt benefits equity holders by increasing debt in the capital structure.
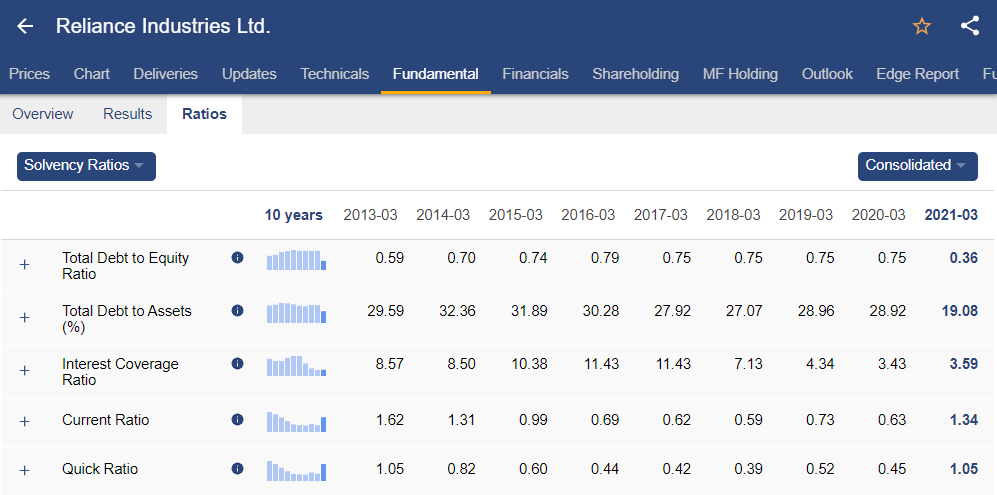
The ratio is comparatively higher for the industries that require huge capital requirement like capital goods, infrastructure and real estate and is comparatively lower for the service sector industries like IT and FMCG
Safe debt level:
There is a notion of a safe debt level of a company. Although it is difficult to establish the 'safe debt level', it is determined with reference to the operating leverage of the company. Operating leverage measures the proportion of fixed costs in the operating costs structure and is often assessed during ratio analysis.
A company with high variability in earnings or operating cash flow should have relatively low debt in its capital structure or else the company could go bankrupt.
A company which has a debt level lower than that of the safe level determined for the company is said to be underutilizing its debt capacity. Companies prefer to have debt lower than the safe level so that it does not face difficulties in obtaining additional debt financing when needed.
2. Debt-to-Asset Ratio:
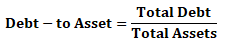
This ratio measures the percentage of the total assets that is financed by the debt levels of the company rather than equity.
For example, a debt-to-asset ratio of 0.35 or 35% indicates that 35% of the company’s total assets are financed by debt.
In ratio analysis, a higher debt to asset ratio signifies higher financial risk of the company and lower ratio indicates lower financial risk of the company.Generally, higher debt to asset ratio signifies higher financial risk of the company and lower ratio indicates lower financial risk of the company.
3. Financial Leverage Ratio:
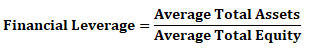
In this ratio analysis, we can measure the amount of total assets that is supported by each one money unit of equity.
For example, a value of 3 for this ratio means that each ₹1 of equity supports ₹3 of total assets.
The higher the financial leverage ratio, the more leveraged the company is in the sense of using debt and other liabilities to finance assets and vice versa.
4. Interest Coverage Ratio:
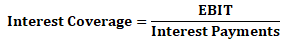
This ratio shows whether or not a firm is in a position to meet its present obligations of long-term debt. It measures the number of times a company’s EBIT could cover its interest payments. The higher the ratio, the better off will be the firm's creditors.
As part of ratio analysis, the interest coverage ratio directly measures the ability of the company to meet its fixed commitment and continue its operations. A higher ratio indicates stronger solvency, offering greater assurance that the company can service its debt from operating earnings.
Analysts usually consider interest coverage ratio of 3 as adequate however, it varies from industry to industry.
5. Fixed Charge Coverage:

This ratio relates fixed charges, or obligations, to the cash flow generated by the company. It measures the number of times a company’s earnings (before interest, taxes, and lease payments) can cover the company’s interest and lease payments.
In ratio analysis, lease payments which a company has a commitment to make are added back to EBIT in the numerator and also to the denominator.
Significant lease obligations will reduce this ratio compared to the interest coverage ratio. A fixed charge coverage ratio is a more meaningful measure for companies that take on lease a large portion of their assets, such as some airlines or oil exploration companies that take on lease oil rigs for their exploration processes.
Fixed charge coverage ratio is a more comprehensive coverage ratio. A higher fixed charge coverage ratio implies stronger solvency, offering greater assurance that the company can service its debt (i.e., bank debt, bonds, notes, and leases) from normal earnings. In ratio analysis, the fixed charge coverage ratio is sometimes used as an indication of the quality of the preferred dividend with a higher ratio indicating a more secure preferred dividend. Usually, a fixed charge coverage ratio of less than 1 is considered to be inadequate. Analysts consider that earnings of a company with a fixed charge coverage ratio of less than one are insufficient to cover fixed charges.
Let’s calculate solvency ratio with the given information:
- Debt= ₹10,65,000
- Shareholder's equity= ₹10,31,300
- Total Assets= ₹2,412,200
- EBIT (Earnings Before Interest and Taxes)= ₹4,24,900
- Interest Payments= ₹46,900
1) Debt-to-Equity ratio =Total Debt/Total Shareholders’ Equity
= 10,65,000/10,31,300 = 1.03
2) Debt-to-Asset ratio = Total Debt/Total Assets
= 10,65,000/24,12,200 = 0.44
3) Financial Leverage = Average Total Assets/Average Total Equity
= 24,12,200/10,31,300 = 2.34
4) Interest Coverage ratio = EBIT/Interest Payments
= 4,24,900/46,900 = 9.06
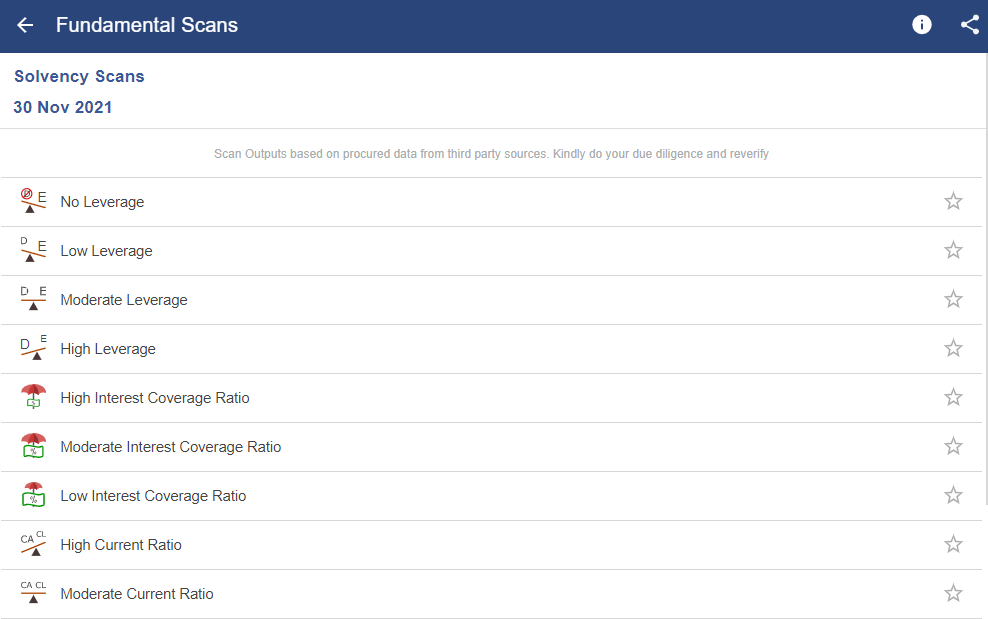
You can use solvency scans in our StockEdge app:
Activity Ratios
Activity ratios are quite different from the types of ratio analysis that we have learned earlier. Liquidity, Solvency ratios measure the financial stability of a company, whereas activity ratios measure the firm's efficiency in terms of its daily business operations. So, let us learn activity ratios in detail.
What are Activity Ratios?
These ratios measure the operation ease of the management in working capital and asset management. These ratios intend to measure how efficiently the company manages its various assets. Some examples of activity ratios include Turnover ratios, Efficiency ratios and Asset utilization ratios.

Different types of turnover ratios are discussed below:
1. Receivables Turnover Ratio:
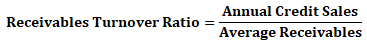
This ratio measures with ease which company is collecting its payments from the clients to whom the goods/services are provided on credit.
In this type of ratio analysis, a very low ratio means that customers are paying too slowly which means too much capital is tied up in current assets. It also implies that the company should re-assess its credit policies for timely collection of impaired credit which is not earning interest for the firm. However, a very high ratio might indicate that the firm's credit policy is too rigorous which might be hampering its sales and it also implies that a company is operating on a cash basis.
2. Days Sales Outstanding (DSO):
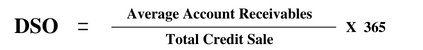
DSO reflects the elapsed time between a sale and cash collection, reflecting how fast the company collects cash from customers to whom it offers credit. With the high importance of cash running in business, it will be in the best interests of a company to convert the outstanding receivables as soon as possible. By quickly turning the outstanding sales into cash, the company has the option to put the cash into use again to be more precise, to reinvest and make more money. The DSO can be used to measure the average number of days a company takes to collect revenue after sales. A low DSO means it takes fewer days to collect its accounts receivables and vice-versa.
3. Payables Turnover Ratio:
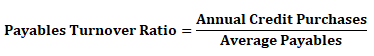
A short-term liquidity measure used to quantify the rate at which a company pays off its suppliers is known as the payables turnover ratio. In ratio analysis, if the turnover ratio is falling from one period to another, this is a sign that the company is taking longer to pay off its suppliers than it was before. The opposite is true when the turnover ratio is increasing which means that the company is paying off suppliers at a faster rate.
A payables turnover ratio that is high relative to the industry could indicate that the company is not making full use of available credit facilities, alternatively it could result from a company taking advantage of early payment discounts. An excessively low turnover ratio could indicate troublemaking payments on time or alternatively, exploitation of lenient supplier terms.
4. Days Payable Outstanding (DPO):

DPO is calculated to see how long a company will take to pay back its trade creditors. It reflects the average number of days the company takes to pay its suppliers. A higher ratio implies that the company takes longer time to pay their bills to the suppliers. This means they can retain the funds for longer duration and utilise those funds in the most efficient manner. However, a higher ratio would also hurt the company’s reputation and would imply inability to pay bills on time. Suppliers and creditors may also refuse to extend trade credit in future to the company. Additionally, the company may also lose on any discount on timely or early payments and may end up paying more.
5. Inventory Turnover Ratio:

It is the measure of a firm's efficiency with respect to its processing and inventory management. In ratio analysis, this ratio shows how many times a company's inventory is sold and replaced over a period. It indicates the resources tied up in inventory.
A low turnover relative to industry norms implies poor sales and therefore, excess inventory. It is an indicator of slow-moving inventory perhaps due to technological obsolescence or a change in demand. A high ratio relative to industry norms imply either strong sales or ineffective buying. It can indicate highly effective inventory management. Alternatively, it can also indicate inadequate inventory so that the shortage could potentially hurt revenue.
This ratio should be compared against industry benchmarks and is very important for the retail industry where inventory management is one of the key tasks of the management. Ratio analysis helps businesses identify such inventory performance trends and make informed operational decisions.
6. Days Inventory Outstanding (DI0):

It is a financial measure of a company's performance that gives investors an idea of how long it takes a company to convert its inventory into sales. The lower the DIO, the better it is. A low DIO implies that cash is tied up in inventory for a shorter period and lower the risk of obsolescence. A high DIO implies that the company’s cash is tied up in inventory for a longer period, meaning it cannot be deployed for other purposes. A high DIO may also be associated with overstocking, leading to higher than necessary storage costs and a high level of obsolete stock that may never be sold. It is important to note that the average DIO differs from industry to industry.
7. Cash Conversion Cycle (CCC):
CCC = DIO + DSO – DPO
The Cash Conversion Cycle measures the time each net input is tied up in the production and sales process before it is converted into cash through sales to customers. It measures the length of the time required by a company to go from cash paid to cash received. The cycle looks at the amount of time needed to sell inventory, the amount of time needed to collect receivables and the length of time the company is affordable to pay its bills without incurring penalties.
8. Working Capital Turnover Ratio:
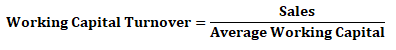
The working capital turnover ratio is used to analyze the relationship between the money used to fund operations and the sales generated from these operations.
Some firms may have very low working capital if outstanding payables equals to or exceeds inventory and receivables.
In a general sense the higher the working capital turnover, the better because it means that the company is generating a lot of sales compared to the money it uses to fund the sales, indicating greater efficiency. Companies like HUL and ITC have been known to create shareholder wealth because of a very high working capital turnover ratio. They block very little or zero capital in working capital and generate very high turnover.
9. Asset Turnover Ratio:

This ratio measures the effectiveness with which a firm uses its total assets to generate revenue.
Different businesses have different turnover ratios. A manufacturing business that is capital intensive might have an asset turnover ratio close to one while a retailer might have a turnover ratio close to ten.
It is desirable that a firm's asset turnover is close to industry norm. A low ratio indicates that a company has too much capital tied up in its asset base and a ratio too high might imply that the firm has too few assets for potential sales or that the asset base is outdated.

Let’s calculate turnover ratios from the information given above: -
1) Receivables Turnover Ratio = Sales/Average Receivables = 50,000/2,900 = 17.24
[Average Receivables = (3,200+2,600)/2 = 2,900]
2) Days Sales Outstanding = 365/Receivables Turnover Ratio = 365/17.24 = 21.17
3) Payables Turnover Ratio = Purchases/Average Payables = 30,000/2,100 = 14.29
[Purchases = COGS + Opening Inventory – Closing Inventory = 30,000 + 3,000 – 3,000 = 30,0000
Average Payables = (2,200 + 2,100)/2 = 2,100]
4) Days Payable Outstanding = 365/Payables Turnover Ratio = 365/7.32 = 25.5
5) Inventory Turnover Ratio = COGS/Average Inventory = 30,000/3,000 = 10
[Average Inventory = (3,000 + 3,000)/2 = 3,000]
6) Days Inventory Outstanding = 365/Inventory Turnover Ratio = 365/10 = 36.5
7) Cash Conversion Cycle = DIO+DSO– DPO = 36.5 + 21.17 – 25.5 = 32.17
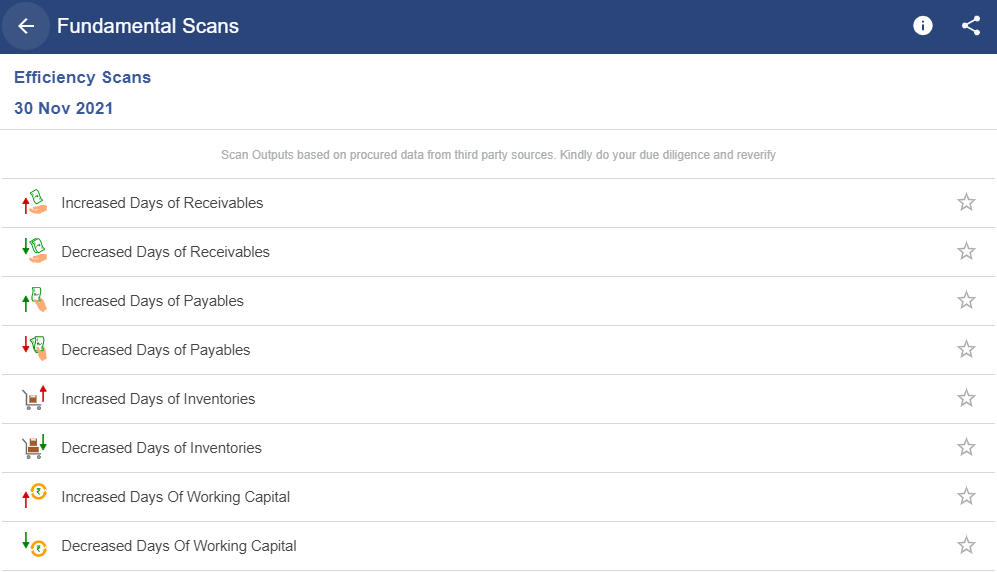
Click here to check out various efficiency scans one can use while comparing various stocks.

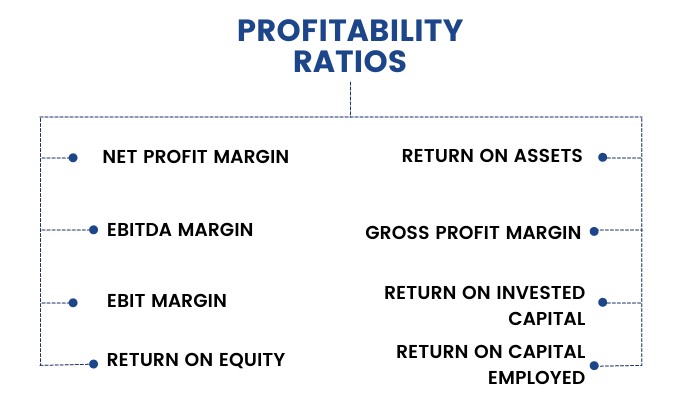
Profitability Ratios
Now comes the profitability ratios. Similar to what we have learned in the last section about activity ratios which measure the company's operational efficiency. Profitability ratios, in ratio analysis measure the efficiency of a firm to generate profits for its shareholders.
What are Profitability Ratios?
These ratios are most important from the viewpoint of an investor since they show whether the company is making profits and generating adequate returns or not.
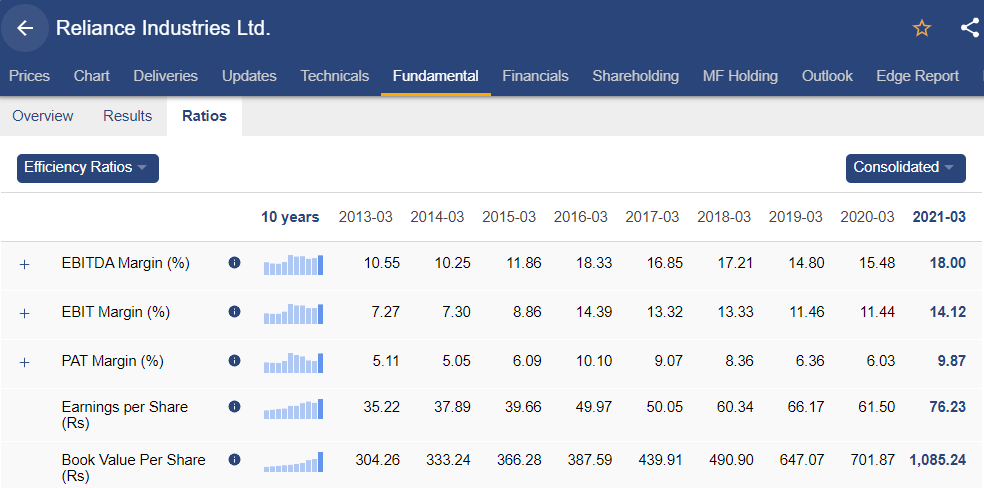
1. Gross Profit Margin:
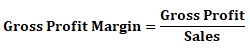
Here gross profit is the difference between sales and cost of goods sold. The gross profit ratio represents the excess of what the concern is able to charge as sale price over the cost of purchasing/manufacturing the goods. Gross profit margin indicates the percentage of revenue available to cover operating and other expenses and to generate profit.
Gross profit margin has an importance in ratio analysis especially in evaluating the operating performance of companies, particularly those which are engaged in merchandising and manufacturing business. An analyst should not draw inference by examining the gross profit margin in isolation from other operating expenses.
In general, an increase in gross profit margin signifies better performances than that in the past and higher gross profit margin than that of comparable companies signifies better performance than peer groups.
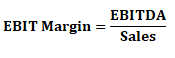
2. EBIT Margin or Operating Margin:
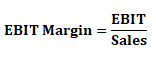
Here, EBIT is the difference between sales and COGS + SG&A + Depreciation + Amortization. Operating profit margin is the appropriate measure of a company's operating performance and higher the margin signifies better performance by the firm at the operations level.
An operating profit margin increasing faster than the gross profit margin can indicate improvements in controlling operating costs such as administrative overheads. In contrast, a declining operating profit margin could be an indicator of deteriorating control over operating costs.
The operating profit margin of a company that focuses on turnover is likely to be lower than a company that focuses on operating profit margin rather than on turnover. Therefore, in order to draw correct inferences, an analyst needs to understand the business model and corporate strategy of the company.
3. EBITDA Margin:
Here EBITDA is the difference between Sales and COGS + SG&A. We just add back depreciation and amortization to EBIT and the resultant number is EBITDA.
EBITDA is preferred to EBIT for companies operating in sectors like telecom and infrastructure sector which involve very high capital expenditure and in turn high depreciation expenses.
4. Net Profit Margin:
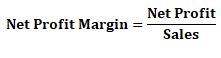
Here Net Profit is the difference between (Sales + Other Income) and COGS+ SG&A+ Depreciation and Amortization + Interest and Taxes.
The profit margin tells you how much profit a company makes for every ₹1 it generates in revenue. Profit margins vary by industry but all else being equal, the higher a company's profit margin compared to its competitors the better it is.
Net profit margin is important from shareholder's perspective. Net profit adjusted for dividend on preference shares represents the surplus that is available for distribution to equity shareholders.
Net profit margin should be based on net income from continuing operations and "below the line" items such as discontinued operations should not be included since the same will not affect the company in the future.
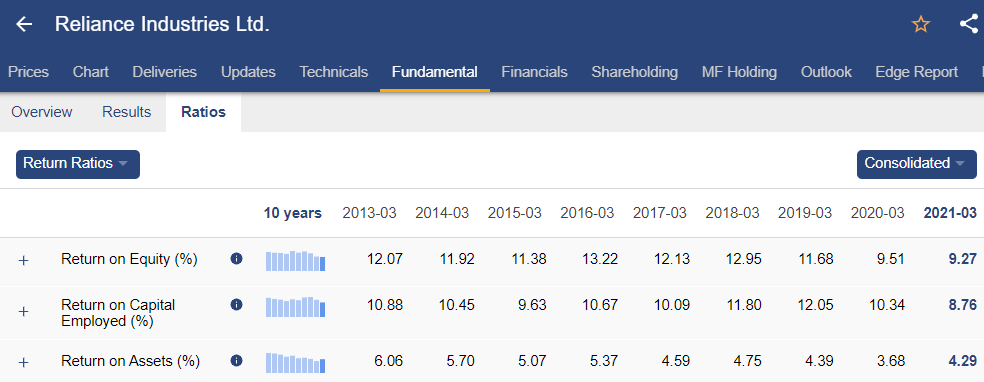
5. Return on Assets (ROA):
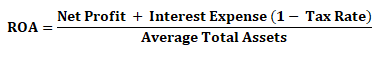
ROA measures how efficiently the management is using its assets to generate earnings.
Since total assets of a company include both debt and equity financing, adding tax adjusted interest back to the net income shows the returns to both equity and debt holders.
As part of ratio analysis, ROA tells you what earnings were generated from invested capital (assets). ROA for public companies can vary substantially from industry to industry. This is why when using ROA as a comparative measure, it is best to compare it against a company's previous ROA numbers or the ROA of its peers.
The higher the ROA, the better it is because the company is milking more profits from the asset. And when you come to think of it, the management's most important job is to make wise choices in allocating its resources.
6. Return on Equity (ROE):
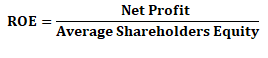
The amount of net income returned as a percentage of shareholders equity. Return on equity measures a corporation's profitability by revealing how much profit a company generates with the money shareholders have invested.
There are several variations of the above formula that investors may use.
- Analysts willing to see the return on common equity may modify the formula above by subtracting preferred dividends from net income and subtracting preferred equity from shareholders' equity giving the following:
Return on common equity = Net Profit - Preferred dividends / Average Common equity
- Investors may also calculate the change in ROE for a period by first using the shareholders' equity figure from the beginning of a period as a denominator to determine the beginning ROE. Then the end-of-period shareholders' equity can be used as the denominator to determine the ending ROE. Calculating both beginning and ending ROE allows an investor to determine the change in profitability over the period.
ROE is often more thoroughly analyzed using the DuPont analysis which is :
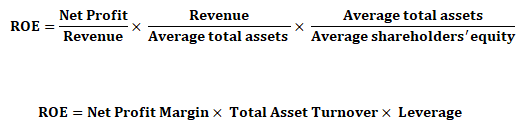
This analysis shows whether the company is increasing its ROE by generating higher profit margins or asset turnover or simply by taking more and more leverage. When a company's ROE increases as a result of the former two then it's a sign of good operating performance however, if it is because of an increase in leverage ratio then it signifies a higher financial risk to the common equity holders.
7. Return on Invested Capital (ROIC):
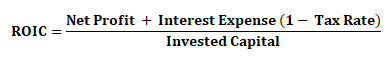
Invested Capital = Net Block+ Capital Work in Progress + Current Assets - Current Liabilities - Cash;
The return on capital measures returns generated on all debt as well as equity invested in an asset/assets. Consequently, it has to consider earnings not just to equity investors (which is net income) but also to lenders in the form of interest payments.
ROIC is one of the most important return measures to consider the operating efficiency of a company because
- A company that earns return on invested capital (ROIC) higher than its weighted average cost of capital (WACC) creates value
- On the other hand, a company that earns ROIC lower than its WACC destroys value
- In a situation of perfect competition, a company cannot earn 'economic rent' which is the return in excess of (WACC)
- A company that manages innovation and product brands well continues to earn returns significantly higher than its WACC.
- Therefore, even in a matured industry, companies which continue to create significant value for their investors exist
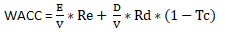
Where,
- Re = Cost of Equity;
- Rd = Cost of Debt;
- E/V = % Share of Equity;
- D/V = % Share of Debt;
- Re = Rf + Beta (Rm- Rf);
- Rf = Risk free rate of return
- Rm = Expected Market Return
- Tc = Corporate Tax Rate
8. Return on Capital Employed (ROCE):
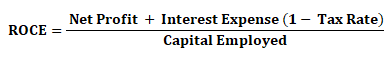
Capital Employed = Fixed Assets + Current Assets - Current Liabilities
ROCE is computed the same as ROIC, the only difference is we do not subtract cash from invested capital. ROCE should always be higher than the rate at which the company borrows otherwise any increase in borrowing will reduce shareholders' earnings.
As part of ratio analysis, a variation of this ratio is return on average capital employed (ROACE), which takes the average of opening and closing capital employed for the time.
There are few more important ratios that investors take in consideration while checking the profitability of the company. Kindly check them out–
Let’s calculate Profitability ratios with the given information: -
Company XYZ Ltd.has the following financials:
- Revenue= ₹2,105,700
- Gross Profit= ₹1,055,700
- Operating Income= ₹424,900
- Net Profit= ₹381,800
- EBIT= ₹424,900
- Depreciation= ₹186,000
- Total Shareholder’s equity= ₹1,031,300
1) Gross Profit Margin = Gross Profit/Revenue
= 1,055,700/2,105,700 = 0.50
2) Operating Margin = Operating Income/Revenue
= 424,900/2,105,700 = 0.20
3) EBITDA Margin = EBITDA/Revenue
= (EBIT + Depreciation)/Revenue
= (424,900 + 186,000)/2,105,700 = 0.29
4) Net Profit Margin = Net Profit/Revenue
= 381,800/2,105,700 = 0.18
5) Return on Equity = Net Income/Average Total Equity
= 381,800/1,031,300 = 0.37
Growth Ratios
Profit is vital for any company. We have learned several profitability ratios in our last unit. However, the growth of a company indicates how its business is growing from one period to another. Therefore, in this unit, we will discuss growth ratios.
What are Growth Ratios?
In ratio analysis, growth ratios indicate how fast a company or its business is growing. These ratios measure the rate at which the company is growing.
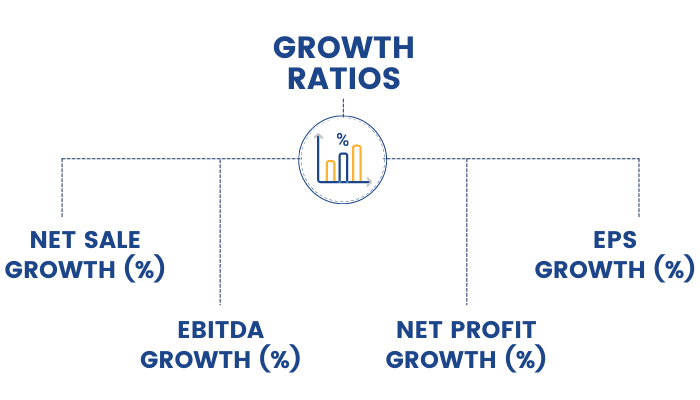
Net Sales Growth (%):

Net sales are the total sales of an organisation minus the return inwards, discounts etc. This ratio helps in checking whether the company is on a growth trajectory or not compared to the previous year. Consistent growth in sales is a measure of management’s quality and performance. Growing sales signifies a growth-oriented company.
Consistent net sales growth is a positive measure of a management’s performance. If the net sales growth over the years is consistent and there is no de-growth (apart from exceptional circumstances) it makes sense to invest in the company as a compounding story
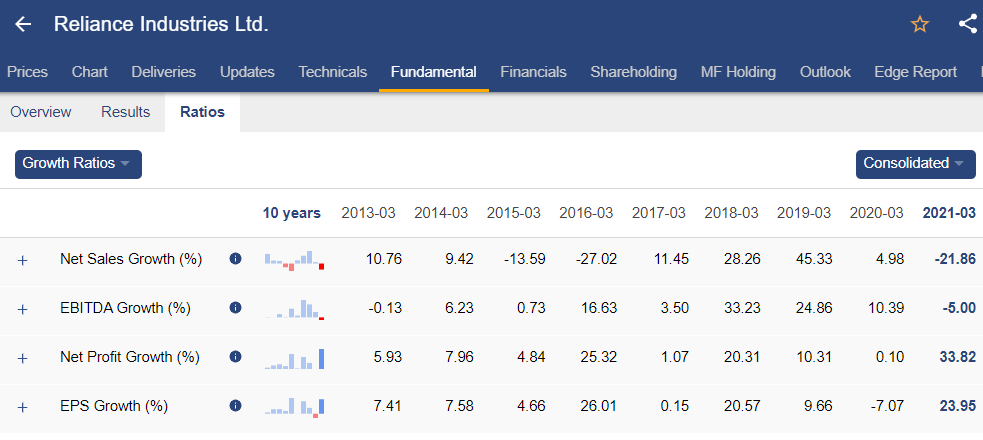
Example - In 2016-17, the net sales of a company is ₹10 crores and in 2017-18 it is ₹11 crores then net sales growth % is (11-10)/10= 10%.
EBITDA Growth (%):
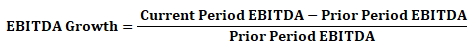
EBITDA stands for Earnings Before Interest, Tax, Depreciation and Amortisation. EBITDA is a measure of a company’s operating performance. It eliminates the effects of financing and accounting decisions. EBITDA is derived by subtracting expenses incurred from Sales and adding back interest cost + tax + depreciation and amortisation.
EBITDA growth percentage is an important barometer to measure the growth and future prospects of a company. The higher the EBITDA growth the better is the company’s growth potential.
This is a better measure compared to net sales growth percentage. In the net sales growth percentage loss making transactions could also be accounted for like say an e-commerce company. Flipkart could be selling its goods below the cost price or at break even in order to boost sales. Hence EBITDA is a better margin. Growth in EBITDA signifies an improvement in the efficiency of a company.
Example - In 2016-17, ABC Corporation reported sales of ₹50 crores and expenses excluding interest tax and depreciation or amortisation is ₹45 crores then EBITDA is ₹5 crores and similarly in 2017-18 the company sales is ₹57 crores and expenses excluding interest tax and depreciation or amortisation is ₹50 crores then EBITDA is ₹7 crores.
EBITDA Growth (%) = (7-5)/5= 40%
Net Profit Growth (%):

The net profit of the company is the profit that the company generates after accounting for all its expenses. It is a true reflection of the way the company has used its resources. Thus, consistent growth in net profit implies the financial strength of the company.
In ratio analysis, net profit growth percentage is an important tool to measure the growth and future prospects of a company. A growth in net profit enhances the dividend-paying capacity of a company and the company can use the profits to diversify its operations and expand the business.
Example - If a company made a net profit of ₹ 10 crores in first year and ₹ 13 crores in second year the net profit growth % is (13-10)/10= 30%
EPS Growth(%):
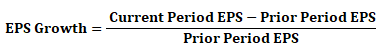
Where, EPS = Net Profit/Number of shares outstanding
EPS measures the amount of net income earned per share of stock outstanding. In other words, this is the amount of money each share of stock would receive if all of the profits were distributed to the outstanding shares at the end of the year.
Earnings per Share Growth (%) is reported after adjustment of extraordinary items (i.e. one-time income or expenses) and potential share dilution (i.e. increase in the number of potential shareholders due to an exercise of a stock option, conversion of a debenture or preference shares into equity, bonus issue, etc). Any bonus, split, conversion of debenture or preference share into equity, warrant issue, etc. must be reflected in the calculation of weighted average number of shares outstanding at the end of a period. In ratio analysis, such adjustments ensure an accurate representation of a company's earnings performance over time.
There are various kinds of EPS used under different circumstances for different kinds of calculations. Thus, we have Basic EPS, Diluted EPS and Cash EPS.
- Basic EPS: It is a rough measurement of a company’s profit that can be allocated to one share of its stock. It does not factor in the diluted effect of convertible securities. Basic EPS is calculated as follows:
Basic EPS = (Net income – Preference dividend) / Weighted average number of share outstanding
Example – ABC Corporation reported a net profit of ₹4 crores when the outstanding shares stood 40 lakh. Therefore,
EPS = (4 crores/40 lakh) = ₹10
- Diluted EPS: If a company has a complex capital structure i.e. they have issued potentially dilutive securities then diluted EPS is considered to be a more precise metric than basic EPS. It takes into account all the outstanding diluted securities that could preferably be exercised and shows how such action would affect earnings per share. It can be calculated as:
Diluted EPS = {Net income – preference dividend (which are not convertible) + Interest on debenture (if such debenture is convertible)} / (Weighted average no of share outstanding + conversion of diluted securities)
- Cash EPS: Cash EPS or more commonly operating cash flow per share measures financial performance of the company. Free from non-cash items like depreciation which is included in basic EPS calculation, cash EPS may prove to be a more reliable measure of financial and operational health of the company. Higher the company’s cash EPS, better it is considered to have performed over a period. The formula for calculating the company’s cash EPS is:
Cash EPS = Operating cash flow / Diluted shares outstanding
Valuation Ratios
Lastly, we will discuss valuation ratios that measure a company's financial strength to its market value.
What are Valuation Ratios?
In ratio analysis, valuation ratios measure the quantity of an asset or flow (e.g., earnings) associated with ownership of a specified claim (e.g., a share or ownership of the enterprise). It compares the stock price of the company with either the profitability of the company or the overall value of the company.
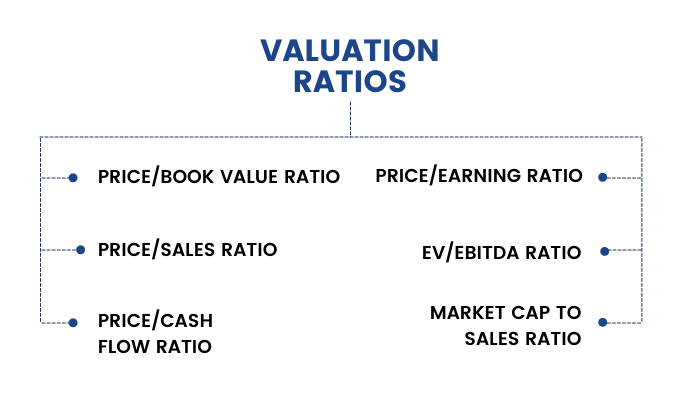
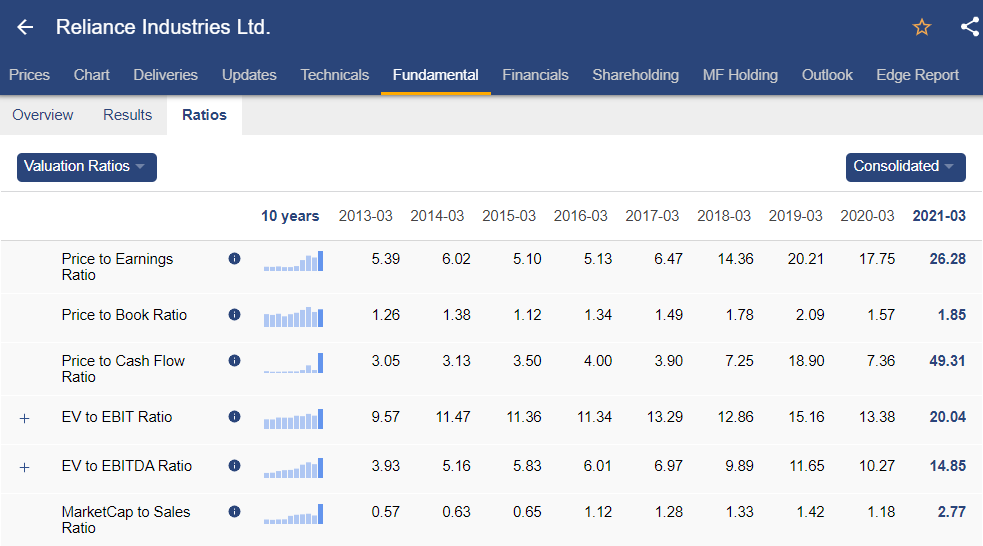
1. Price/Earnings Ratio (P/E):

The P/E ratio expresses the relationship between the price per share and the amount of earnings attributable to a single share. In other words, the P/E ratio tells us how much an investor in common stock pays per rupee of earnings. It is one of the most commonly used metrics in ratio analysis to evaluate a company's valuation.
For example, if the P/E of a certain firm is 10 then it simply means that for every unit of profit the company earns, the market participants are willing to pay 10 times. A higher P/E ratio could mean that the stock is over-valued or else could mean that investors are expecting high growth rates in future and vice-versa.
Stock of company ABC is priced at ₹ 78.78. The company’s profit for the year was ₹ 10,000 and its number of outstanding shares is 1,250.
EPS = 10,000/1,250 = ₹8
P/E ratio = 78.78/8 = 9.85
2. Price/Sales Ratio (P/S):

This ratio compares a company’s stock price to its revenue. This ratio is also known as a Sales Multiple or Revenue Multiple. In ratio analysis, a low P/S ratio implies that the stock is undervalued while a high ratio indicates that the stock is overvalued. P/S ratio is sometimes used as a comparative price metric when a company does not have positive net income.
XYZ Corporation has 10 lakhs outstanding shares with the stock currently trading at ₹10 per share. The annual sales of the company stood at ₹1 crores.
Therefore, P/S Ratio
Price/Sales ratio = ₹10/ (1 crores/10 lakh) = 1
3. Price/Cash Flow Ratio (P/CF):
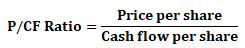
This ratio compares a company’s stock price per share to operating cash flow per share. In ratio analysis, it is usually considered a better measure than P/E ratio since cash flows cannot be manipulated as earnings (which includes depreciation, amortization and other non-cash expenditure). Hence, it works well for the companies that have large non-cash expenditures.
For example, the stock price of ABC Corporation is ₹10 and its number of outstanding shares is 100. The operating cash flow of the company is ₹ 300 in a given year.
Cash flow per share = 300/100 = ₹3
Thus, Price to Cash flow share = 10/3 = 3.33
This means that the firm’s market value covers its operating cash flow 3.33 times.
4. Price/Book Value Ratio (P/BV):

In this ratio analysis, it is often interpreted as an indicator of market judgment about the relationship between a company’s required rate of return and its actual rate of return. Assuming that book values reflect the fair values of the assets, a price to book ratio of one can be interpreted as an indicator that the company’s future returns are expected to be exactly equal to the returns required by the market. An asset's book value is equal to its carrying value on the balance sheet, and companies calculate it netting the asset against its accumulated depreciation.
A ratio greater than one would indicate that the future profitability of the company is expected to exceed the required rate of return and values of this ratio less than one indicate that the company is not expected to earn excess returns.
For example, a company has ₹150 million in assets on the balance sheet and ₹125 million in liabilities. There are 10 million shares outstanding and the price of each share is ₹5.
Book Value per share = (150-125) / 10 = 2.5
P/BV ratio = 5/2.5 = 2
This implies that the market price is valued at twice its book value.
5. Enterprise Multiple (EV/EBITDA):
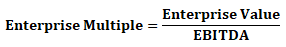
EV/ EBITDA or Enterprise Multiple is used to determine the value of a company. It looks at a firm in the way a potential acquirer would buy considering the company’s debt. It is a better valuation metric since it remains unaffected by changing capital structures and offers fairer comparisons of companies with capital structures that differ. It removes the effect of the company’s non-cash expenses on its value.
A high EV/EBITDA ratio means that the company is overvalued and a low ratio means a company is undervalued. A company with a low enterprise multiple can be considered as a good takeover candidate.
Example - The Enterprise Value of a company is ₹10 crores. (EV= Market capitalisation + Debt + Minority Interest + Preferred Shares- Total Cash and cash equivalents). The EBITDA is ₹2 crores. Then its EV/EBITDA multiple is 10/2=5.
It is extremely difficult to arrive at the correct valuation at times since the company’s enterprise value takes into consideration a lot of factors and varies from industry to industry.
6. Market Cap to Sales Ratio:

This ratio determines how much price is one willing to pay for every rupee of sales generated by the company. It is an important ratio as it combines two very important aspects namely sales and the market price of the share. It is useful for valuing a company’s actual price.
If the ratio is more than one, then it is considered to be over-valued and if it is less than one, then it is considered to be under-valued.
Market cap to sales ratio is preferred more over PE ratio because it does not take into account interest and taxes or any non-cash items thus, it can’t be manipulated. But PE ratio can be manipulated as it takes into account non-cash items too.
Example - Suppose a company ABC has a price of ₹10 and the total number of outstanding shares being 100
Therefore, market cap = ₹10 x 100 = ₹1,000
Now suppose the company generates annual sales worth ₹500
Market Cap to Sales ratio = 1,000/500 = 2
This means you will be paying ₹2 for every rupee of sales that a company makes if you wish to buy shares of the company.
Solvency and Liquidity Ratios in Banking sector
Now that we have learned all the financial ratios & their types through ratio analysis, let's see how we can apply them. In this unit, we will discuss the importance of solvency & liquidity ratio, especially in the banking sector.
What does Solvency and Liquidity Ratio Mean for a Bank?
- Solvency ratios are analysed to determine the long-term ability of the bank to meet its obligations
- Liquidity ratio are analysed to determine the short-term ability of the bank to meet its obligations
- Banks are a leveraged business and hence both liquidity & solvency must be carefully analysed. Liquidity and Solvency play an imperative role in the smooth survival of the bank.
- This position of the bank should be analysed both on a standalone basis and also in comparison to its peers to have a better understanding of the current situation as well as the market cycle.
Financial ratios are widely used to analyse a bank’s performance specifically to gauge and benchmark the bank’s level of solvency and liquidity.
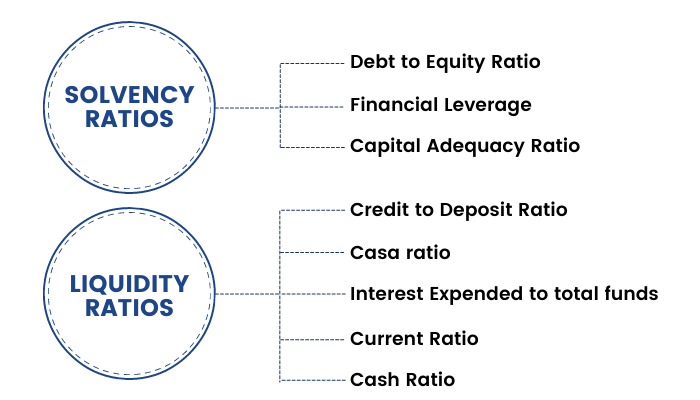
Solvency Ratio
Solvency ratio measures the long-term ability of the bank to meet its obligations. This involves understanding the capacity of the bank to meet its obligations. These include:
- Debt to Equity Ratio: Discussed earlier
- Financial leverage: Discussed earlier
- Capital Adequacy Ratio:

The higher the CAR, the better the bank is insulated from any business shocks. As per regulatory standards in India, Private Banks are required to maintain a minimum CAR of 9% whereas the number stands at 12% for Public Sector Banks and 15% for Small Finance Banks.
Liquidity Ratios
1. Credit to Deposit Ratio:
This ratio is also known as the Loans to Deposits Ratio (LDR)
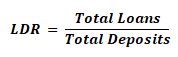
This measures the bank’s total credit in relation to its total deposits in the bank. This helps in analysing the bank’s liquidity position.
A reading greater than 100 indicates that the bank has lent more than the amount of deposits available with it.
2. CASA Ratio:
CASA stands for Current Account and Saving Account.
CASA Ratio measures the ratio of deposits in current and savings accounts as a percentage of total deposits.
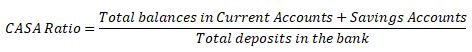
Higher the ratio, lower is the cost of funds for the bank which significantly helps the banks (since interest paid on current & savings account is lower than time & fixed deposits) in reducing operating expense.
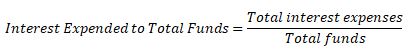
3. Interest Expended to Total Funds:
The interest expense is the amount paid on the deposits accepted by the bank. It tells us about the cost of funds with respect to deposits.
Interest expense is a non-operating expense shown in the income statement. It represents interest payable on any borrowings such as bonds, loans, convertible debt or lines of credit.
4.Current ratio : Discussed earlier
5. Cash ratio : Discussed earlier
Conclusion
Besides this, we have a bunch of other modules on ELM School for all who are willing to learn in greater detail on financial analysis and the stock market. Be sure to check them out.


