Swing Trading
Introduction
Are you someone who is very keen to learn swing trading? Does swing trading interest you? Do you want to learn about intraday trading vs swing trading and see how it fits your purpose?
If yes, then you are at the right place.
Swing trading is a trading strategy that attempts to benefit from price movements in a stock over a small to medium time frame.
Swing traders aim to “buy” a stock when they believe that the market will rise and they “sell” when they suspect that the market will fall. Hence, swing trading involves TIMING THE MARKET
Such a strategy works primarily on technical analysis to find a trending/ range-bound stock & benefit from its price movement. Thus, analyzing price movements, identifying price patterns, entering into position to benefit from that movement forms the bedrock of swing trading strategies.
Next, we will discuss some possibilities of swing trading.
How Price Swings are traded?
Swing trading can be done in two possible ways:
1. Identifying the primary trend and riding it.
For example, you analyze a stock that has been in a long-term uptrend. Swing traders can seek to enter this stock on pullbacks from the trend and then look to benefit when the primary trend resumes.

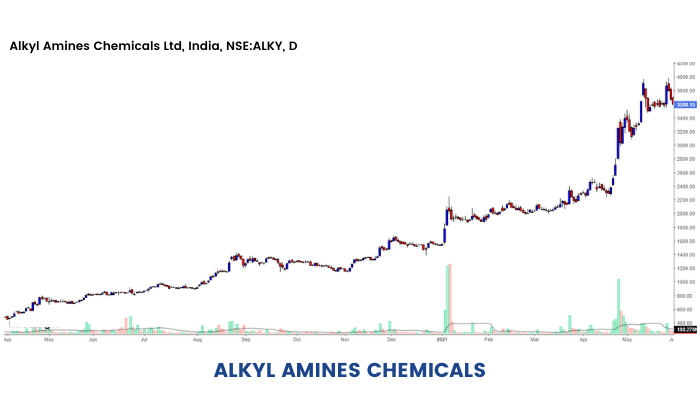
The stock of Alkyl Amines (NSE: ALKYLAMINE) has been in a strong uptrend since May 2020. In this journey from ₹408 to ₹3,775, the stock has given multiple pullbacks where traders could build positions. More specifically:

This once again proves the thesis that no stock goes up linearly. When it does go up, it is likely to give a lot of opportunities in the form of minor pullbacks. And it is on these minor pullbacks that the smart traders build their positions.
2. Trading range-bound markets
Range trading can be done by identifying support and resistances and aiming to capture swings when prices hit either support or resistance.
For example, traders can pick a fundamentally sound stock at a strong support and then sell the stock when it reaches its established resistance, thereby making a profit.
Consider a stock that has established support around ₹500 zones and has not fallen below this level for some time and has an established resistance at ₹600. Swing traders will typically wait for the stock to reach either the support or resistance to initiate a trade.
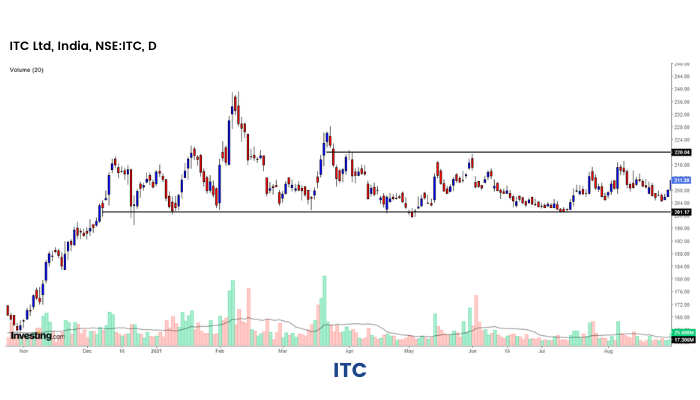
The stock of ITC Ltd (NSE: ITC) has strong support zones around ₹200 levels and the same can be inferred from the chart above. The stock has bounced back eight times in the last seven months from its support zones. Stocks like ITC are a goldmine for swing traders. Traders can go long in the stock when it reaches its established support zones and exit at resistance zones of ₹220 or thereabouts.
A note of caution while employing this tool, traders must avoid fresh positions once this range breaks on the either side with substantial volumes.

The stock of Reliance Industries (NSE: RELIANCE) spent eight years from 2009-2017 in a narrow consolidation zone. Now, if someone were to employ this strategy after the stock gave a breakout in 2017, he/she would be in for a doomsday scenario.
The stock has gone up by around 4x since then.

This implies that swing traders must be flexible enough to shift from a range bound trading strategy to a directional trade once the stock gives a breakout/breakdown.
However, traders should have a clear objective while making Swing Trades. We will discuss some common objectives of swing trading in the next section.
Objectives of Swing Trading
The goal of swing trading is to identify an overall trend and capture larger gains within it. Swing traders aim to achieve gains which are higher than day trading.
Swing trading is more susceptible to market volatility. The central goal of every swing trader is to benefit from short/medium term price movements. Generating regular income is at the heart of swing trading.
The aim should be to make small gains consistently in a disciplined way. Swing traders should aim for a minimum risk to reward ratio of 1:2 or higher.
The holding period shall depend upon the trend as analyzed by the trader but it is generally suggested that traders should look to cash out their trades within three to four days up to a month.
Day trading Vs Swing Trading
Day trading is a trading strategy which attempts to benefit from price movements in a stock within market hours. This strategy typically involves entering a trade anytime during market open hours but necessarily closing the trade at market close.
Consider the Indian stock markets that open for trading at 09:15 hours and shut at 15:30 hours.
Day traders enter into trades anytime during this window but necessarily exit their positions by 15:30 hours.
Holding trades only during the day serves two purposes:
- It ensures that the trader’s capital is not involved in a particular trade for a long period of time.
- Overnight risk of holding the stock and thereby risk of a gap up/ gap down opening is negated.
Unlike swing traders, day traders are not interested in following trends, it is pure price action that piques their interest. Therefore, smaller time frame charts – one minute, five minutes, fifteen minutes candlesticks become much more important for day traders since their attempt is to capture live price action and benefit from it.
Day Trading Involves quick entry and exit on hitting a stop loss or targets. Day traders aim for small profits, generally 1% to 2% on capital employed while maintaining a strict stop loss. Day traders can either be discretionary or systematic depending upon the style that suits them.
Scalping (trying to earn very small profits close to 0.5%-1%) can be considered as a method of day trading.
Day traders are generally full-time professionals who depend upon their market performance as their source of livelihood. Thus, day trading unlike swing trading is not suitable for novice investors or people already engaged in business/profession/ jobs.
Essential elements of swing trading
Previously, we have learned the objectives of swing trading, but before starting, it is essential to go through a basic checklist. Some of these are explained below:
1. Liquidity -
Swing trading requires that the trader can enter into or exit from trades quickly. Therefore, it is extremely important that trades are entered in only liquid stocks.
2.Time frame -
Swing traders should use multiple time frames (hourly, daily, weekly, etc.) in order to gauge market sentiments more accurately– one minute, five minutes, fifteen minutes candlesticks are too small a time-frame to judge the suitability of the trade. Ideally, such short time frames should be employed by day traders who must square off their positions at the end of the day.
3.Volume -
The number of shares traded is also an important indicator to consider in the charts. Any trend accompanied by high volumes is a good indicator of a trend continuation.
For example, a price breakout from a range bound zone with good volumes is a more potent indicator for traders to enter than a breakout accompanied by low volumes. Volumes act as a confirmation to the trade. Volume represents market interest in a stock, higher volume shows market interest in the trend that the stock trades. If a stock falls with huge volumes, it is indicative of bearish market sentiment in participants, similarly if price rises with huge volumes, it is indicative that market sentiment with regard to the stock is bullish.

In the above chart of Adani Ports & SEZ (NSE: ADANIPORTS) we can see that the price candle at ₹880 is accompanied by huge volumes and subsequently the price falls below ₹720 pointing to the bearish trend in the stock.
Thus, analyzing volumes is an important tool for swing traders.
4. Entry & exit points -
It is extremely important for swing traders to have a strategy for determining the entry point of trade. Since this strategy requires timing the market to ensure profits, it is essential that traders choose accurate entry points based on their chart analysis. Generally, swing traders enter into trades at pullbacks when they intend to follow the trend after some retracement or at the lower/upper end of the band when trading a range-bound stock.
Similarly, the exit strategy must be pre-determined. The exit strategy is usually based on important technical price levels or is determined using the risk-reward ratio as explained in the next point.

5. Risk reward ratio -
Risk to reward ratio is a fundamental requirement of any trading strategy. It represents the trader’s target and the maximum loss that the trader is willing to bear in the trade
Generally swing traders work with a 1:2 Risk Reward Ratio or higher.
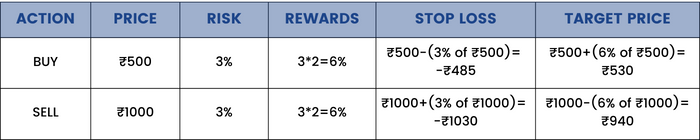
For example, a trader buys a stock at ₹500. The stop loss that he sets based on his risk-taking capacity is 3% of ₹500 = ₹15 i.e., The trader can at maximum afford to lose ₹15. Therefore, as soon as price hits ₹485 (₹500-₹15) trader exits position to prevent more possible losses.
With a 1:2 risk reward, trader targets 2x his risk i.e., 3*2=6%. Therefore, he targets 6% of ₹500=₹30. Thus, as and when the stock hits ₹530, the targets are achieved and he exits the stock
In the 2nd example, a trader short sells a stock at ₹1,000. The stop loss based on risk is 3% of ₹1,000 = ₹30. i.e., The trader can at maximum afford to lose Rs.30. Therefore, as soon as price hits ₹1,030 (₹1000+₹30), the trader exits position to prevent more possible losses.
With a 1:2 risk reward, trader targets 2x his risk i.e., 3*2=6%. Therefore, he targets 6% of ₹1,000= ₹60. Therefore, if the price hits ₹940 (₹1000-₹60) = ₹940, trader’s targets are achieved and he exits the stock.
6. Stop loss -
Trading without a stop loss is a sure-shot way to blow up your account. Swing trading involves significant overnight risk as the trades are held for more than a day. Hence without a stop loss, any runway gap ups or gap downs can lead to significant erosion of capital.
As a general piece of advice, traders must not risk more than 2% of their risk capital in a single trade.
For example, if somebody has a capital of say ₹10,00,000, their total loss should not exceed 2% of their capital i.e., ₹20,000 in a single trade.
7. Risk management-
Risk management essentially means all the steps that traders take in order to preserve their capital. This can be achieved by doing a combination of three things:
- Exit on stop loss/ target- Swing traders should exit their trade on achieving their desired target/ hitting stop loss. Greed of more price action in your favor or hope to recover losses can render the strategy useless and can lead to loss of capital beyond determined levels.
- Trailing stop loss- A winning trade should always be held with a trailing stop loss. Consider a trader who has initiated a long trade on the stock of ABC Corporation at the Current Market Price of ₹100 with a stop loss at ₹95. Suppose, the stock moves in your favor and reaches a price point of ₹115.
Ideally, he should sell the stock given the price target has been achieved. However, in case if the trader feels that the stock has more room to run, he can keep trailing his stoploss higher- 1st to the breakeven point and eventually higher so that notional profits are locked. The trader may also book partial profits as the target levels are achieved
8. Consistency -
Once a strategy has been developed & thoroughly back tested, it should be continued and not changed haphazardly based on tips/advice. Stick to the mantra to plan your trade and trade your plan!
For example, if a trader is comfortable with successfully executing trades based on moving average indicators and has chosen a few stocks in which the trend is amply clear, he must continue using that strategy.
Blindly following other strategies/indicators with no domain knowledge of its setup coupled with executional inefficiency can have disastrous results. So it is always better to learn first; hence we will discuss some swing trading strategies in our next unit.
Swing trading strategies
Broadly, swing trading can be done by the following strategies:
- Trend trading- The aim in this strategy is to take part in a larger trend and ride it.
- Breakout trading- Breakout is a stock price moving outside of a defined support and resistance level with increased volume. Once the stock trades beyond the price barrier, volatility increases and prices usually swing in the breakout’s direction.
Breakouts are perfect setups for large price swings. Swing traders enter a long position after the stock price breaks above resistance or enter a short position once the stock price breaks down below the support price.
The techniques to trade on these two strategies are almost identical since both these strategies use the same technical analysis, chart pattern understanding and trend analysis.
So as long as a trader trades within the trend, he follows the first strategy, and if he waits for trends to break, he is trading on breakout strategy.
Support & Resistance levels-
This is perhaps the easiest strategy to apply swing trading. The trader has to simply find a stock that has an established support and resistance over a long period, which will allow him to enter into trades at these levels to benefit from price action. (We will learn more about support & resistance levels & how to identify these levels using Fibonacci in our next section)
For instance, if a stock reaches its established support levels, a trader can purchase at this price as historically prices have not fallen below these levels. Thus, keeping the risk reward ratio of 1:2 or higher.
Conversely, if the price reaches an established resistance level, the trader can sell at this price with the expectation that historically share price has not breached the resistance level and will fall.

In the above chart we can clearly see that over the years a support has been firmly established at ₹250-₹260 levels. This will give the trader an opportunity to buy at such levels and benefit from an up move from the support price.
Conversely, the share has a firm resistance at ₹620 levels. Everytime, the price reaches this level, high selling takes place and stock falls down. Therefore, if the price reaches this level, the trader can short sell the stock at this level with expectation of benefiting from the fall in his favor.
Presently, the price trades at ₹538, traders wanting to enter this stock, can wait till the stock reaches its resistance of ₹620 and then sell the stock with targets of 3-5%.
Swing traders may also wait for breakouts from these levels to take advantage of further upside/downside as per their trade.
It is essential to understand that swing trading aims at consistent money-making by taking small profits out of multiple trades. Hence it is best advised that traders trade within the trend with strict stop losses to avoid huge losses.
Identifying support & resistance levels using Fibonacci
Traders can also make use of Fibonacci retracement levels to determine support and resistance prices and enter trades accordingly.

In the above price chart of Nifty 50 we notice a strong rally from ₹14500 to ₹18500 levels.
Reaching a swing high at ₹18500, prices start correcting a little and the stock goes into consolidation zone.
Consider a trader who has strong belief that the bullish trend will continue and wants to enter this share. This is where Fibonacci retracement levels can be used to determine support and resistance prices.
Fibonacci retracement levels at 23.6%, 38.2%, 50%, 61.8%, 78.6% help traders to determine support and resistance for such securities in the trend. It is generally believed that Fibonacci retracement levels will act as support prices when prices cool down after a bull run and thus will provide swing traders to enter the share at a pullback to enjoy the further rally.
We ultimately see that after retracement to 38.2% levels (₹16750) after which there was a runaway gap and the stock once again resumed its bullish trend.
Traders must trade cautiously with the knowledge that though these levels are understood as support prices, there is no guarantee that the prices will not fall below these levels. It may so happen that the stock may go towards a downtrend and price may fall further. Hence swing traders must maintain stop losses to avoid huge drawdown of capital.

In the above graph we see that the share is in a downtrend. Consider that a trader that believes that the prices will fall more, then he can enter into this share at a pullback to retracement levels.
In the above, price falls from swing high of ₹136.90 to swing low of ₹115.89 and then starts consolidating.
Traders can enter at Fibonacci levels with the belief that these levels will act as resistance prices and hope to benefit from the continuing downward trend.
Traders could have entered at 38.2% retracement at price of ₹123.4.
Traders could have entered at 50% retracement at price of ₹126.39.
Traders could have entered at 61.8% retracement at price of ₹128.87.
We ultimately see that the Fibonacci retracement holds good as the price retraces to 50% of fall and then again falls below the swing low of ₹115.89 thereby benefiting the swing trader.
However, these levels are no guarantee that prices won't rise above these levels, so traders must enter with strict stop losses.
Trading in a Channel
In this section, we will learn another technique of how swing trading can be performed using a price channel.
Seasoned traders with expertise in technical analysis can identify patterns and channels. Often prices of stocks are range bound, thus allowing traders to draw two parallel lines- one connecting the support prices and the other connecting the resistance prices. These parallel lines are known as channels.
These can be used to determine supply and demand price levels of a stock and swing traders can enter trades accordingly. Traders must keep in mind that they must trade within the channel.
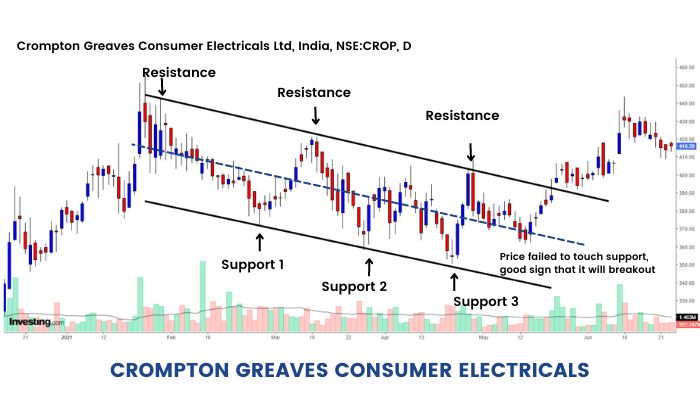
In the above graph we see the price clearly progressing in a bearish price channel. This is called a Downward sloping channel .
It is clearly seen that price is oscillating between a narrow channel and this is where swing traders can make quick profits.
Swing traders can enter into trade at R1, R2, R3 by selling shares with expectation of benefiting from fall in share price till support level of the channel.
Similarly, traders can buy shares at S1, S2, S3 aiming to sell at resistance levels of the channel.
The stop loss for either buy and sell trade should be just outside the channel.
For example, a trader could have bought shares at ₹350 (Support 3) with targetsup to the upper channel at ₹390 or else he could have waited for the price to reach upper end at ₹390 and short sell to benefit from downward fall.
Conversely breakout traders could have bought shares at R3 with the expectation that shares will break out of the channel and move upwards which it ultimately did.
Thus, trading within the channel will give a swing trader multiple opportunities to benefit from the swings within the channel. Focus should be on making small profits, multiple times. Maintaining a strict stop loss will ensure that if there is any breakout from the channel the trader’s capital will still be protected.
There are other swing trading strategies, namely:
- Moving Average Strategy
- RSI & Stochastic Strategy
- Bollinger Band & Super trend Strategy
- Price Pattern Breakout Strategy
We will discuss each of them in our subsequent units.
Moving Average Trading Strategy
Firstly, let us start with the moving average strategy. As we all know by now, moving average is a technical indicator that can be extremely helpful in performing swing trades. Let's see how?
Swing traders can use moving average crossovers as strategies to enter trades. They can calculate the average closing price of a share over 20 days, 50 days, 200 days etc. These are known as simple moving averages (SMA) and are represented as a line of the chart. Generally, traders use 20-day SMA, 50-day SMA and 200-day SMA to determine trades.
Whenever a short-term moving average crosses over (cuts from below) a long-term moving average, we call it a golden crossover and take it as a bullish sign to enter the market on the buy side.
Whenever a short-term moving average crosses under (cuts from above) a long-term moving average, we call it a death cross and take it as a bearish sign to enter the market on the sell side.
For Example, if the 20-day SMA cuts the 50-day SMA from below we read it as a sign that the near term trend is turning bullish and prices will rise. Thus, swing traders can buy shares with a view to take profit as price rises.
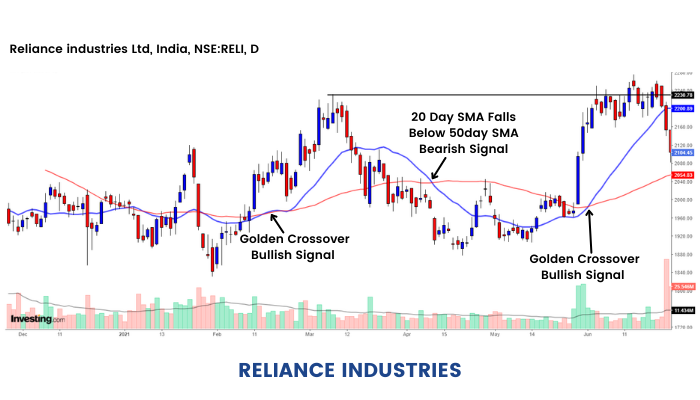
In the above price chart, we see two golden crossovers and one dead crossover.
It will be seen that as 20-day SMA crosses over 50-day SMA there is a spike from ₹1,960 levels to ₹2,225.
This happens again in June when the 20-day SMA crosses 50-day SMA and price rises from ₹1,980 levels to ₹2,300.
Traders on Golden crossover can enter with a view to make profits as the price trend is bullish.
Their view is further strengthened by the fact that the crossover is accompanied by heavy volumes suggesting that there is wider market participation in the trend.
Similarly, at dead crossover, the 20-day SMA falls below the 50-day SMA and we see that prices start falling.
Swing traders could enter at such crossover by selling shares with the expectation that the short-term trend has turned bearish and prices will fall. Ultimately the price did fall from Rs 2040 to Rs 1880 levels.
We can use different combinations of short term and longer term Moving averages too.
A typical textbook-style golden and dead cross crossover can be done by using 50 days and 200-days moving averages. Traders can use either simple or exponential moving averages, whichever suits their trading style.
Enroll Now to our expert-led trading strategy course to learn the markets and maximize your profits today!
RSI and Stochastic Strategy
The next strategy useful in performing swing trades is a combination of two technical indicators RSI and Stochastics.
We can capture price swings with the help of RSI and Stochastic Indicators. Herein, we will set the default RSI to 14 and Slow stochastics to (14,21,14)
Buy conditions –
a)Stochastics - %K (Blue Line) crosses %D line below 30 and not crisscrossed and %K above %D
b)RSI crossing 50 upwards
c)Keep a minimum Risk Reward Ratio of 1:2 – 1:4 as per market conditions
d)Book partial profits when the target is achieved and keep trailing stop losses
Sell conditions -
a)%K (Blue line) crosses %D line below 70 and not crisscrossed and %K below %D
b)RSI crossing 50 downwards
c)Keep a minimum Risk Reward Ratio of 1:2 – 1:4 as per market conditions
d)Book partial profits when the target is achieved and keep trailing stop losses

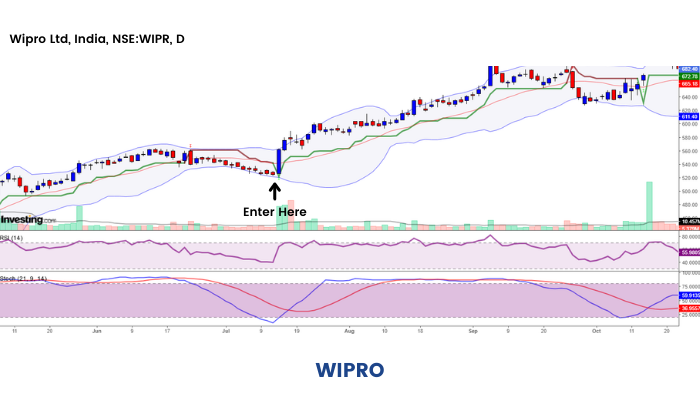
The above price chart of ICICI Bank (NSE: ICICIBANK) shows us the power of this strategy. As evident, the stochastic crossover signal was generated in advance and the RSI further confirmed the buy signal.
The stock rallied from lows of ₹557 to hit ₹650 in just a matter of a couple of months. Although swing trading strategies are held only for a couple of weeks, they can be held longer provided the trade is already profitable. This allows the profits to run and at the same partial profit booking with trailing stop losses ensures that the profits are locked as well.
Many traders adopt to capture a price swing with the combination of moving average, price action and RSI indicator.
Strategy Name: RSI Mean Reversion strategy- The RSI is set to 2 periods by default.
a)Price Close > 200 SMA
b)RSI (2) <15
c)If the condition is met, then enter at 1% limit order – i.e. if the stock is at ₹100, place a limit order 1% below CMP. In this case, place a buy limit order at ₹99
d)Scale in if the stock is more than 1% below the close, the next day- add to your positions if the stock is available at less than ₹98
(As we are catching a falling knife, it's always better to scale to smooth your equity curve)
e)Keep 1.5x ATR (Average True Range) as your stop-loss and book profits minimum 3 times the ATR or higher.

Notice the momentum on all the three occasions when the stock met our trade criteria.
Bollinger Band and Super Trend Strategy
As we all know by now that different technical indicators can be used in different combinations to establish a good swing strategy. In this section, we are listing a few of them which have proven to have a good track record on both backtesting and forward testing results.
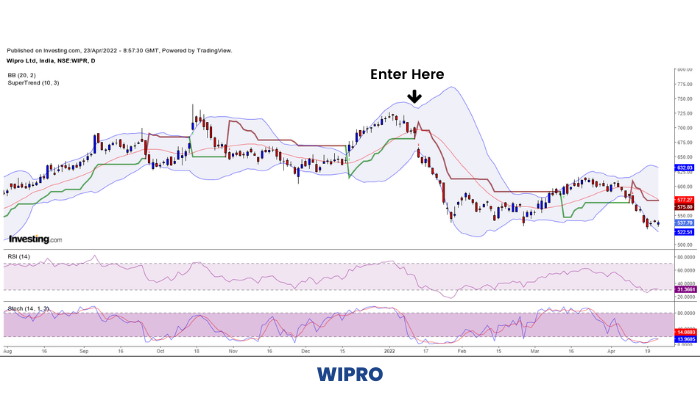
One such good strategy is by the use of RSI, Stochastics, Super trend, Bollinger Band and the ATR indicators.
Indicator parameters shall be set to RSI (14), Stochastics (55,34,21), Supertrend (10,2), Bollinger Band (10,2), ATR (5)
Long Entry- (At the close of candle)
a)RSI should be above 50
b)Prices should be above Supertrend
c)Supertrend should be below mid-bollinger
d)Stochastics should be having %K line over %D line
e)Price low should be below Supertrend
f)Buy in the last two minutes of the day with a stop of 1.1 ATR and target of 2.2 ATR of the candle.
g)Colour of Supertrend does not change
Short Entry: (At the close of candle)
a)RSI should be below 50
b)Prices should be below Supertrend
c)Supertrend should be above mid-bollinger
d)Stochastics should be having %K below %D
e)Price high should be above supertrend
f)Short in last two minutes of the day with stop of 1.1 ATR and target of 2.2 ATR of the candle
g)Color of Supertrend does not change
Price pattern breakouts
Previously we have learned several swing trading strategies with the help of indicators. But 'Price' is considered supreme in technical analysis. So let us learn a few price pattern breakout strategies helpful in swing trading.
Price patterns are actively traded by traders in all time frames, such as head & shoulders, wedges, flags, triangles, etc give excellent swing trading opportunities. You can use these patterns with other indicators as a confirmatory tool. However, be wary of not using too many indicators as it might lead to conflicting signals.
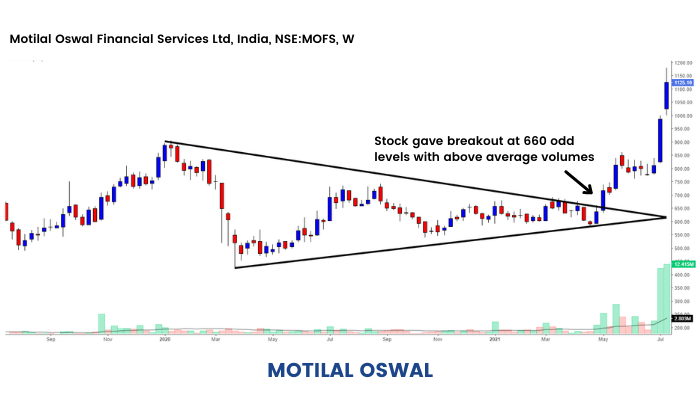
The above price chart of Motilal Oswal Financial Services (NSE: MOTILALOFS) shows a beautiful symmetrical triangle pattern breakout at around ₹650 levels. The stock has given more than 50% returns since then.
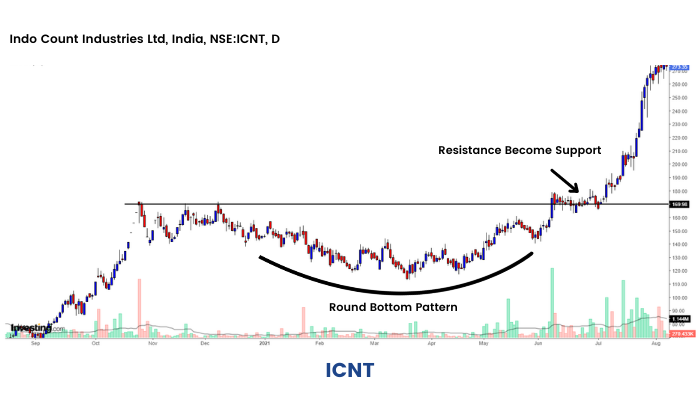
Rounding Bottom pattern visible in Indo Count Industries (NSE: ICIL)
Why swing trading strategy is the best way to make money?
The module taught us everything about Swing trading. In addition, we have noted some key points to justify why Swing trading is the best way to make money in the stock market.
1. Regular income -
It is generally said that markets function in the 80:20 rules i.e., markets trend 20% of the time and are range bound in 80% of the scenarios.
Swing traders are best suited to such range bound markets. Prices oscillating between support and resistance gives swing traders multiple opportunities to make repeated, small profits.
2.Fast results -
Swing trading involves holding positions for a small period of time lasting from a few days up to a month. Hence traders can seek to earn profits and recover their capital in a small-time frame unlike portfolio investing which involves holding a stock for a relatively longer time period.
Since swing trading involves strict stop losses, as soon as price hits stop loss the trader can exit their position and enter in another trade.
Hence in swing trading, the capital of a trader is not held up in one particular trade for a very long time and it gives fast results either way.
3.Easy to learn & execute -
Fundamental analysis requires in-depth knowledge of accounting and analyzing financial statements whereas swing trading relies on understanding of price patterns and movements which are comparatively easier and do not require formal training. Hence, common people with regular jobs can learn technical analysis and use this knowledge to trade.
Swing trading can also be started with a small capital provided strict stop losses are maintained.
4.Minimum time required -
Swing trading does not require one to be glued to their screens. Swing trading does not require traders to be full time professionals and it can easily be carried on along with regular business/profession.
Swing trading does not require multiple screens, professional set-up, multiple indicators to track price action and hence can be done by all market participants.
Since swing traders are comfortable holding their positions overnight, unlike day trading, this obviates the need for them to be physically present before the screen and exit their positions at market closing.
5.Suitable for novice traders -
Novice investors starting their journey in capital markets find swing trading easier to begin with since it does not require fundamental analysis or in-depth knowledge of financial markets.
Common mistakes in swing trading
As we have arrived at the end of this module, it is time to get started with swing trading, but before that, here are some common mistakes that should be avoided in swing trading.
1. Using too many tools
Use of too many conflicting tools may result in spurious outputs & confuse the trader. Rather technical analysis along with use of back tested indicators should be preferred.
2. Trading in the wrong time frame
Swing traders aim to find price trends over a given period and trade to benefit from the trends. Analyzing Smaller time frame candlesticks such as one minute, five minutes and fifteen minutes will not yield desired results as these time frames are too short for any trend to play out and are hence suited specifically to day traders.
Generally swing traders start with daily charts to identify primary trends and then use other time frames to validate whether their identification of trend is correct.
3. Not putting stop-loss
Swing trading works on a strict risk-reward ratio. Failure to set stop loss renders the strategy prone to heavy losses. Remember, Capital protection is more important than its growth. Thus, swing traders should put strict stop loss to prevent erosion of capital.
4. Trading on news/events
Swing traders should follow their predetermined strategy and should not make unnecessary changes to their trade setup based on market news and events.
5. No backtestin
Every strategy should be thoroughly back tested for historical validation. Not every swing trading strategy works on every stock, not every stock responds to moving average crossover in the same way. Hence it is important that traders back test their strategy with indicators on the stocks they wish to trade.
6. Allocation of capital per trade
How much capital to use per trade is a personal decision, however disproportionate allocation of capital on one trade should be avoided.
Mr. A has a capital of ₹1,50,000.
He contracts to buy one futures contract on the stock of Reliance Industries @ ₹2,000.
Total capital invested (Margin Required to enter into the trade) = ₹1,15,000
In the above case, more than 75% of Mr. A’s capital is tied up in a single trade.
This cannot be considered a good trading strategy. It is advised that traders judiciously allocate capital across trades and do not put all their eggs in one basket since if this particular trade does not work out as planned and hits the stop loss, a significant portion of the total capital will be wiped out.
Conclusion
Having an excellent buying and selling plan is one in all the most important portions of powerful swing trading. Sticking to it is the tough part. When a stock moves counter to expectations, it’s easy to think it’ll reverse its course. And whilst you keep onto a concept regardless of proof to the contrary, you could lose BIG. Every trade has some element of risk. One of the ways to reduce this risk is to trade small. If your trades aren’t working, it might be required to change something in your approach. You might need to study more regarding the stock picks or screen time. Taking losses as opportunities makes us a better trader. Reviewing one’s trades can help one find the cause of the root problem.
Happy trading!!


