The world of Fibonacci
Introduction to Fibonacci Analysis
Fibonacci analysis is the study of identifying potential support and resistance levels in the future based on past price trends and reversals. Technical traders attempt to use it to determine critical points where an asset's price momentum may reverse. It is a powerful tool when used in conjunction with other indicators or technical signals. Fibonacci relationships apply on the asset both in time and amplitude.
Let us discuss in detail what is a Fibonacci Sequence and then how it can be used effectively in the field of Technical Analysis.
What is Fibonacci Sequence?
The Fibonacci sequence was invented by Leonardo Pisano Bigollo. He was also known as Leonardo Fibonacci. The Fibonacci Sequence is a series of numbers that starts with the number 0 followed by 1. The next number is obtained by adding up the previous two numbers in the series.
0, 1, 1, 2, 3, 5, 8, 13, 21, 34, 55 89, 144, 233, 377…
Fibonacci Sequence
- Here the number 2 is obtained by adding the two numbers before it (1+1),
- The number 3 is obtained by adding the two numbers before it (1+2),
- The number 144 is obtained by adding two numbers before 144, i.e. (55+89)
What is the Golden Ratio?
An interesting property of this Fibonacci series is that if you simply divide any number in the series by the previous number, the ratio always comes to 1.618; which is considered as the Golden Ratio also referred to as ‘Phi’
377/233 = 1.618
233/144 = 1.618
144/89 = 1.618
89/55 = 1.618
55/34 = 1.618
34/21 = 1.618
And so on.
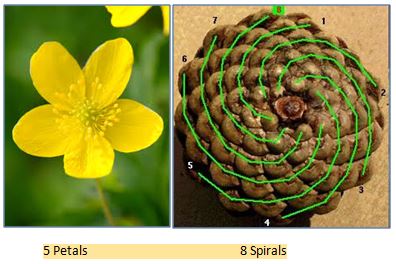
This golden ratio can be observed around most of the things in the universe, from music to ancient designs, to nature like flowers, clouds etc.
The Fibonacci sequence in nature can be observed in nature by counting the number of petals of flowers. The number of petals in most of the flowers which we see is a Fibonacci number, usually in pairs of 5,8,13 and so on. Another example can be seen in pine cones if you count the number of spirals going from the centre of the cone (where it is attached to the tree) to the outside edge. The resulting numbers are usually two consecutive Fibonacci numbers.
In the example shown, there are 8 clockwise spirals and 13 counter-clockwise spirals.
The number of petals a sunflower contains is from the Fibonacci series. It is sometimes 89 or else 144. Moreover, it has a golden spiral seed arrangement also.
So we can conclude that the Fibonacci series is all around us in nature.
Important Ratios
In our last unit, we were introduced to the concept of Fibonacci. It is all about numbers & ratios. The purpose of this unit is to discuss the importance of ratios in the study of Fibonacci analysis.
Various percentages can be derived from the Fibonacci Series. It has been seen that a unique consistency is there when a number in the Fibonacci series is divided by its immediate succeeding number in the series.
21/34 = 0.618
34/55 = 0.618
55/89 = 0.618
89/144 = 0.618
144/233 =0.618
Another uniformity can be observed when any number in the Fibonacci series is divided by a number two places higher than the given number.
13/34 = 0.382
21/55 = 0.382
34/89 = 0.382
55/144 = 0.382
89/233 = 0.382
Similarly, when we divide the number by a 3 digit higher number in the series, the consistency is still maintained.
13/55 = 0.236
21/89 = 0.236
34/144 = 0.236
55/233 = 0.236
So if we express all the above numbers in percentage terms, the value comes as 23.6%, 38.2%, 61.8% and so on. So the most commonly used ratios include 23.6%, 38.2%, 50%, 61.8%, and 78.6%.
Fibonacci and Technical Analysis
Now that we have an understanding of Fibonacci series let us now discuss the importance of Fibonacci numbers in technical analysis.
Why is Fibonacci important in Technical Analysis?
Technical analysis is a vast and diverse field of analysis. It has many tools that make it a successful method to analyze stock markets. The Fibonacci series is one such tool which has stood its test of time. We have already seen above that this series can be witnessed everywhere around us in the universe, including human beings.
To identify support and resistance levels, this sequence plays an important role in technical analysis.
The common Fibonacci numbers are 38.2%, 50%, and 61.8%. The repetitious results that have become apparent through centuries of investment habits indicate that these numbers are significant when applied to human emotions.
The Fibonacci numbers are the crucial numbers for the Elliott wave analysis. They play a major role in analyzing the way you think and how your emotions play a role in your trading decisions.
In our upcoming units, we will discuss the different Fibonacci tools used for technical analysis, such as:
- Fibonacci Retracement
- Fibonacci Extensions
- Fibonacci Fans
- Fibonacci Arcs
- Fibonacci Projections
- Fibonacci time zones
Fibonacci Retracement
Firstly, let us start with ‘Fibonacci Retracement’
What is a retracement?
Retracements are short-term price corrections during an overall upward or downward movement. These price corrections are temporary price reversals and do not indicate a change in direction of the larger trend.
Finding and trading retracements is a method of technical analysis used for short-term trades. One of the benefits of trading retracements is that they provide an opportunity to enter a trade in the direction of the main trend at a better price.
Why do retracements occur?
Technical Analysis is all about psychology and pulse of the markets. Markets and prices always move in a Zig-Zag movement. In a strong uptrend, a large number of traders enter the market and buy as they believe the market price will increase. The increased demand pushes the prices higher. As more traders notice this movement, they also start entering the market, and the increased demand further pushes the prices up. At these higher levels, traders who had entered at a lower price start to take profits, resulting in a temporary correction or retracement.
Once a retracement is seen, the trend resumes the original momentum. Most of the time we have seen that the retracement happens at one of the Fibonacci ratios of the main trend.
How to trade with the help of retracements?
Fibonacci retracement levels are often used as part of trend-trading strategies. The underlying security should be in a strong up or a down trend. Traders identify a retracement taking place within the trend – It is basically the movement of prices in the opposite direction to the main trend, and try to make low-risk entries in the direction of the initial trend using Fibonacci levels. Traders using this strategy anticipate that a price has a high probability of bouncing from the Fibonacci levels back in the direction of the initial trend.
Fibonacci levels can be useful if a trader wants to buy a particular security but has missed out on a recent uptrend. In this situation, you could wait for a pullback. By plotting Fibonacci ratios such as 61.8%, 38.2% and 23.6% on a chart, traders may identify possible retracement levels and enter potential trading positions. The same concept also holds true for a downtrend too.
How to draw a Fibonacci retracement?
In order to apply the Fibonacci retracement tool, one needs to identify the swing high and the swing low points of a trend. A swing high is identified as the highest point displayed on a given time period of a trend. It is formed when price makes a high and is followed by two consecutive lower highs. A swing low is when price makes a low and is immediately followed by two consecutive higher lows.

Using the Fibonacci retracements tool in any charting platform, the swing low and the swing high points needs to be connected. We will observe that horizontal lines are plotted as Fibonacci retracement levels. The most popular Fibonacci retracement levels are 23.6%, 38.2%, 61.8%, and 78.6% and these levels act as support or resistance depending on the type of trend.

So in an uptrend the price will retrace down to a certain percentage of the prior likewise in a downward trend the price will move opposite ie. Upward to a certain percentage of the prior swing.
Traders use these Fibonacci levels as efficient entries in the direction of the trend as many traders watch these levels and place buy, sell and stop orders on them.
How should you use Fibonacci retracement levels in an uptrend?
In an uptrend one should look to identify the area - the price finds support at important Fibonacci levels. Then we suggest one should wait for confirmation, as the price moves back into the original direction of the trend and then enter.
One important thing to note is that we must use a confluence of indicators to increase the probability of success in the trade. To support the initial analysis, should not trade solely on Fibonacci retracements, but look for other confirmatory signals too.

How should you use Fibonacci retracement levels in a downtrend?
Likewise, for a downtrend one can place the entry after the price has found resistance at one of the Fibonacci levels. Once a confirmation occurs, and when the price moves back into the original downward trend, then entry can be initiated.

How to plan your exits to the trade?
The exit strategy plays an integral part in every trade. Let us have a step by step understanding of the same.
Step 1: Deciding your stoploss.
The best place to place your stop loss is right below the Fibonacci level (in case of an uptrend) and above the Fibonacci level (in case of a downtrend) respectively.

Stop Loss level in case of an uptrend

Stop Loss in case of a downtrend
Step 2: Deciding the Target.
One can use Fibonacci extensions as reasonable profit targets.Fibonacci extensions provide good take profit levels in the direction of a trending market. Similar to the retracement levels, the common Fibonacci extension levels are 61.8%, 100%, 161.8%, 200%, and 261.8%.
The price may not always move to the desired Fibonacci extension levels, so one should not consider Fibonacci levels in insolation, but should trail the stop loss in direction of the trend so as to protect the gains.
A retracement is a short term price correction during an overall long-term up or down trend. The benefit of trading retracements is that they provide an opportunity to enter a trade in the original direction of the trend at a better price. The strategy is to buy at pull backs in an uptrend and sell rallies in a downtrend. A good way of identifying them is to use Fibonacci retracements. To set targets, one can use the Fibonacci extensions which we will learn in the next unit. As always it is recommended that one should use stop-loss that can be placed above or below the last retracements level.
Fibonacci Extensions
Previously we have learned how Fibonacci retracement levels can be used for identifying support zone that we can use as a stop loss. But what about the targets? For that, we can use another tool called Fibonacci Extensions. Let's see what it is.
What is Fibonacci Extension?
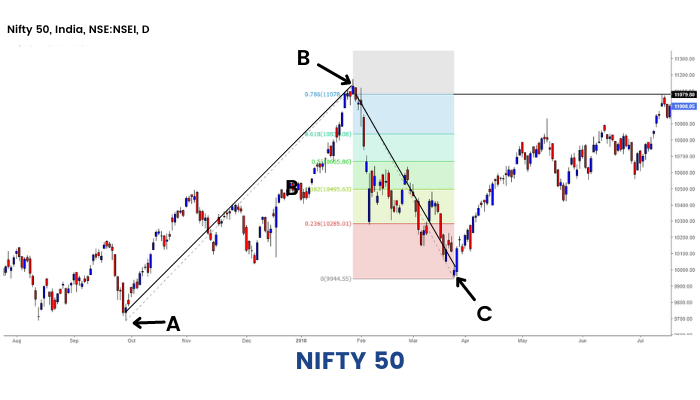
Fibonacci Extension is drawn by joining three points like Fibonacci projections. The three points as taken while drawing the Fibonacci projections- same are taken to draw the extensions.
Point A: Swing Low - that is the point from which the actual trend started.
Pont B: Swing High - the point at which price started to retrace.
Point C: Low of the ongoing price correction.
The most common Fibonacci extension levels are 161.8%, 261.8% and 423.6%. Though these are quite far off numbers, the other important resistance levels using Fibonacci extension comes at 50%, 61.8%, 78.6% and 100%.
When the stock is trading at a lifetime high area where there is no prior resistance, we may draw probable resistance levels using Fibonacci extension.
Fibonacci extension in an uptrend:
Fibonacci Fans
Next, let us discuss ‘Fibonacci Fans’
Fibonacci fans use Fibonacci ratios as the base to find potential support and resistance levels within a trend channel. It is primarily used for analyzing trends. Like other Fibonacci tools, Fibonacci Fans are drawn from the swing low to swing high. The same Fibonacci ratios of 38.2, 50 and 61.8% retracement trend lines are placed on the chart. These trend lines can be then used to find support and resistance areas depending upon the trend.
Fan lines drawn by the indicator indicate “zones” where support or resistance is likely to occur.
In order to draw a Fibonacci fan for a stock in uptrend we need to connect the swing low with the swing high. Fibonacci fans get plotted on the chart showing possible areas of support.
Fibonacci Fans for a stock in uptrend:
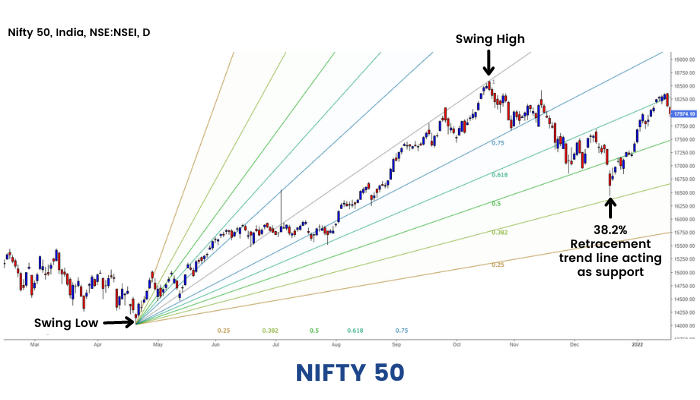
As you can see on the chart the price bounced from the fan line, taking support at 38.2% trend line.
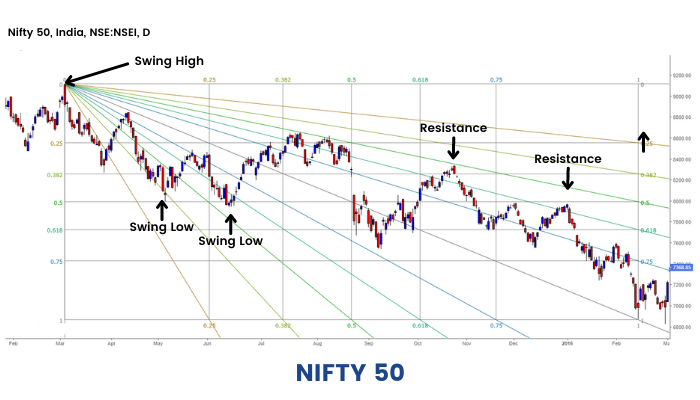
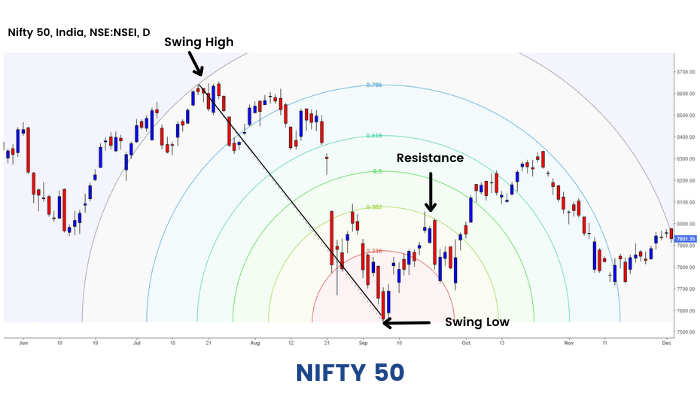
Similarly, In order to plot Fibonacci fans for a stock in downtrend, we need to connect the swing high with the swing low. The required Fibonacci fan levels get plotted on the chart showing possible areas of resistance for the price.
Fibonacci fans for a stock in downtrend:
Fibonacci Arcs
The next Fibonacci tool we will learn in this section is ‘Fibonacci Arcs’
Fibonacci Arcs add a time element to Fibonacci retracements. Fibonacci Arcs are half circles that extend out from a trend line. The arcs are based on the Fibonacci ratios - 38.2%, 50 % and 61.8% respectively.
For a stock in downtrend: Fibonacci Arcs are used to anticipate resistance or reversal zones for the counter-trend bounce. Fibonacci arcs are drawn by connecting swing high to possible swing low, and the required Fibonacci arcs get plotted on the chart which acts as potential points of resistance for the price. These Fibonacci arcs denote the possible points up to which stock can retrace before continuing its downward move.
Fibonacci Arcs for a stock in downtrend:
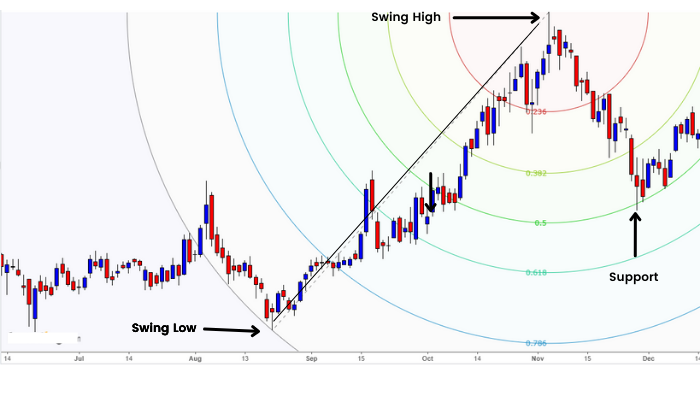
For a stock in uptrend: Fibonacci arcs are drawn by connecting swing low to possible swing high, and the required Fibonacci arcs get plotted on the chart which acts as potential points of support for the price. These Fibonacci arcs denote the possible points upto to which stock can retrace before continuing its prior up move. In the chart below the price is taking support at the 50% Fibonacci arc and then resumes its prior uptrend.
Fibonacci Arcs for a stock in uptrend:
Key points
1. For implementation of Fibonacci fans and arcs there should be a clear prior trend.
2. Fibonacci retracements, arcs and fans do not work in a sideways market.
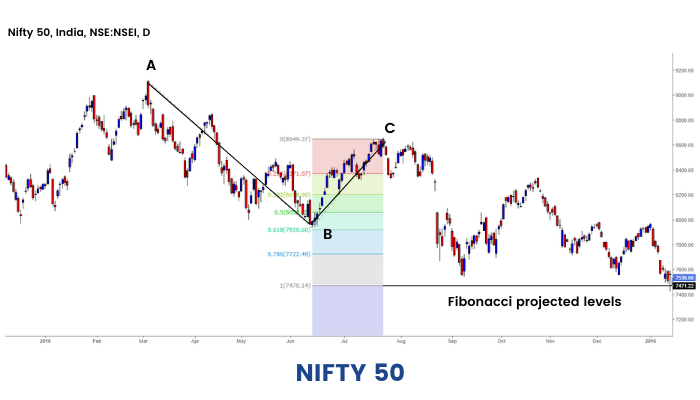
Fibonacci Projections
Here in this section, we will learn about 'Fibonacci Projections' that are somewhat similar to what we learned in our earlier unit of Fibonacci extension. Both are used to decide on a price target.
Fibonacci projections are mainly used to get the possible target levels of an ongoing uptrend or downtrend. It is drawn by joining three points unlike Fibonacci Retracement which has just two points- by joining the lowest and the highest points of a pre-defined.
In order to draw the Fibonacci projections for a stock in an uptrend, we need 3 points:
Point A: Swing Low - that is the point from which the actual trend started.
Pont B: Swing High - the point at which price started to retrace.
Point C: Low of the ongoing price correction.
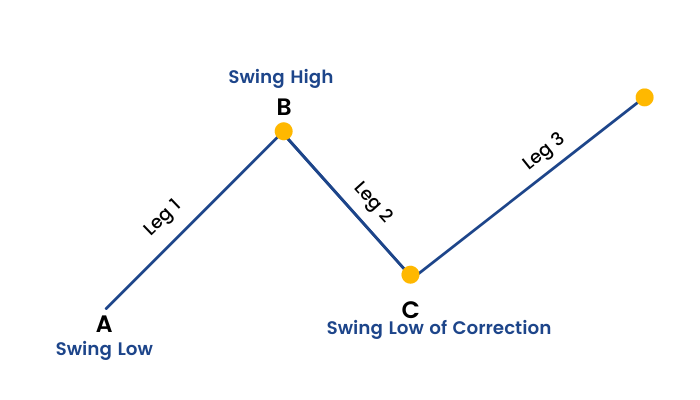
The movement of the price from swing low (point A) to swing high (point B) is known as the first leg. The retracement from point B (Swing High) to point C (low of correction) is known as the second leg. We can plot Fibonacci projections connecting these three points . This will give an indication of the third leg, and the possible area till which price can move to.
How to use Fibonacci Projections?
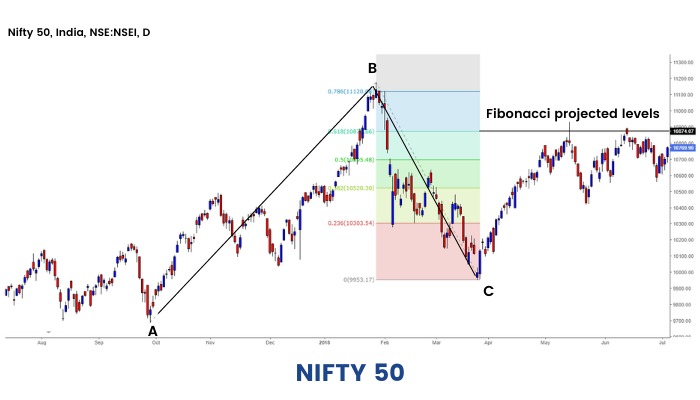
Fibonacci projections provide potential good levels to book profits. The important Fibonacci projections levels to watch out for are 61.8%, 100%, 161.8%, 200%, and 261.8%.
Fibonacci projections for uptrend:
Fibonacci projections for downtrend:
Keys points
1. The second leg of the price movement should be a corrective price movement of the ongoing movement. The trader must make sure the trend has not reversed by the use of other technical parameters.
2. The Fibonacci projections are not necessarily the levels from which the price might retrace. A price may move beyond the projected levels to the next level before it starts to correct. So, it is important to always support our analysis with other technical indicators and price action strategies.
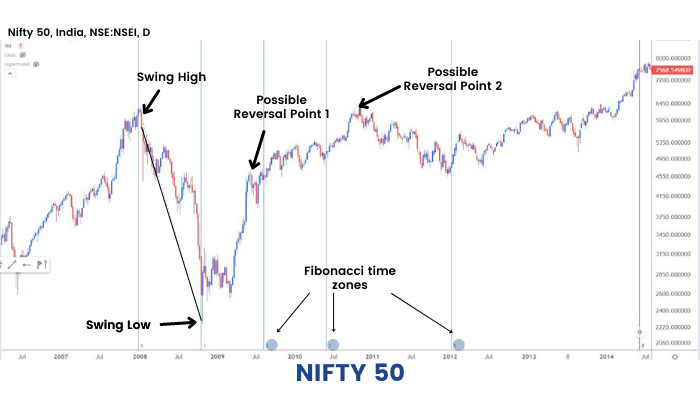
Fibonacci time zones
Lastly, in this section we will learn ‘Fibonacci Time Zones’
Fibonacci times extensions are vertical lines that represent time periods in future where the price could make its next possible high or low or the area from where the price might start to correct.
In order to plot the Fibonacci time extension numbers on our chart we need to connect the swing low to the swing high and the vertical Fibonacci extensions are plotted on the right hand side of our chart denoting the possible time in future where the price make its next swing high or swing low. It is assumed that most of the tops and bottoms are made around Fibonacci numbers. The swing low and swing high points we choose to plot Fibonacci time extensions should be of a major trend which is clearly visible.
Conclusion
So, what we have learned from this module is the concept of Fibonacci and its importance in technical analysis. The Fibonacci numbers are extremely useful to identify different support and resistance zone in a stock or any other financial securities. The application of the tools we have learned like Fibonacci retracements, extensions, Fibonacci Fans & arcs, etc., comes very handy for every trader in the market while doing technical analysis. Keep practicing these Fibonacci tools for your trading. Also, learn the other aspects of technical analysis from different modules of ELM School and enhance your trading skills.


