How I Made $2,000,000 in the Stock Market by Nicholas Darvas
Introduction
About the book
The book “How I Made $ 2,000,000 in the Stock Market” by Nicolas Darvas is about the author’s expedition of earning $2 million in the US stock market in just 18 months. The book brings light to the fact that the author who was professionally a dancer was able to earn such a huge profit. Although the period of earning that profit was just 18 months, there were 5 years of constant investing and learning behind it. It was not achieved by luck but by creating his theory about stocks through his experience and the multiple books he read.
About the Author
Nicolas Darvas was a dancer. He was a self-taught investor and an author, best known for his book, "How I Made $2,000,000 in the Stock Market."
He was Hungarian by birth but trained as an economist at the University of Budapest. Reluctant to stay in Hungary, he fled to Istanbul, Turkey in June 1943 at the age of 23, with a forged exit visa and fifty pounds sterling. Later, he met up with his half-sister Julia who also was his partner in a dancing team in United States and Europe.
Buy the book
The book is for someone who wants to learn the art of trading & earn a lifetime fortune out of it. We highly recommend you to read the entire book. (affiliate link)
The Gambler
The author, Nicolas Darvas, was a professional dancer. In 1952, he was proposed to dance in a Toronto nightclub for which the payment was to be made in the form of stocks of Brilund company in the Canadian stock market. Unable to perform, he still offered to buy 6000 shares of the company at 50 cents as a gesture. He forgot about those shares and after two months, when he checked, he was surprised to see the stock price at $1.9. He made a profit of approx $8000 unintentionally and that’s how his journey in the stock market commenced.
Impressed by this profit; he decided to invest more in the Canadian stock market. Being a novice in the stock market, he started taking advice from every second person, about which stock to invest in. But what came next was a period of absolute failure. He kept hopping in and out of 25 to 30 stocks. Even when he made profits, he incurred an overall loss because of the brokerage charges he didn’t account for.
Thereafter, he decided to seek help from financial advisors and his brokers. Many times he did get lucky but by the end of 1953, his $11000 was down to $5800. He then moved to New York and started looking over the New York stock exchange. This made him gain interest in Wall Street and he decided to sell all his stocks in the Canadian stock market.
Takeaway: Perseverance is the foremost requirement for success in the stock market. One must be determined not to quit and must be willing to spend years if required to win in trading.
Developing a system and method that matches your personality and risk tolerance is not the only part of the process. Trading the right system at the right time in the right market environment is also important.
Instead of getting emotionally attached to a particular stock, focus on trading the price action only. Making some money in a particular stock does not mean it will keep rewarding in the future as well. It is also exhausting to be emotionally moved by each trade.
A successful trader does not trade stock tips, they trade methods and systems.
To be successful in the long run, let your winners run long because profits are needed to pay for the small losses.
Subscription to any advisory service must have entries and exits for each trade along with position sizing guidance and the recommendations must match your trading method. Choose carefully because very few are useful and measure up.
The Fundamentalist
Nicolas opened an account with a brokerage firm and started with $15,800 to trade on Wall Street. Initially, the market was on a bull run and everything went well. However, it slowed down later.
He was not bothered by the occasional setbacks. However, he praised himself for a successful trade and blamed the broker for an unsuccessful one.
He realized that no matter how big or small his profits and losses were, the broker always made money. He understood that even the advisors were not giving a perfect stock to make money. He was selling a few stocks too quickly to make small profits. His profits and losses were offsetting each other.
He then entered the over-the-counter market (the market of unlisted securities) and bought stocks of around 6-7 companies. In such a market, the stock prices change according to the bid and ask prices. Whenever he wanted to sell his stocks he found it hard to find a buyer. And when he did, the deal would end up in a loss. Consequently, he returned to the listed securities.
Through his experience, he learnt the following lessons-
- It's better not to follow The tips from the advisory service as they are not perfect. The vast majority of advisory services are dangerous if they do not set risk criteria for their subscribers. Most of these are written by people who make money on the letters not trading.
- It is always better to trade a historically proven system because brokers can also be wrong. Each trade should make sense and fit inside your trading plan.
- In trading you have to let your winners run and cut your losses short. If you cut your winners short by taking $100 profits twice and let your losers run and then lose $200 two times you are down $2000 after ten trades. That is a great procedure for going broke over a long period.
- Trade in listed stocks only and keep a healthy volume of over 500,000 shares a day. Never trade in the “over-the-counter” market and penny stocks. There is very little regulation in the over-the-counter market and it is very dangerous to buy a stock that could have no possible buyer when you are ready to sell.
- Do not listen to rumours because they are false most of the time and add no value to trading. Nicolas Darvas did not trade rumours, he traded price action.
- Instead of gambling, one should study the market. Companies with innovative products and real earnings are the ones that go up in value. A few junk stocks may rise for a period based on anticipated game-changing information but they usually sink back to their original prices.
- Trading will be much better if the focus is on a limited amount of best stocks rather than holding a dozen stocks for a shorter period. Buy the good stocks when they are at their strongest and breaking out of key resistance points.
During the same period, the author developed his fundamental approach to analyzing stocks. In this approach, he considered the earnings, dividend history and other reports of the company. One of his stocks, Virginian Railway, gave him a profit of $1303. With the help of his broker, he decided to find out the reason behind its good performance. Thereupon, he realized that the company had a fine earnings record and paid a good dividend. Its monetary position was impressive. The reason behind the company's rise was its fundamentals which made him more confident about this approach. Thereafter, he started studying the company profiles and their reports but still, the stocks he chose were not enacting as per the analysis.
Takeaway: One of the most important things a trader can do is take responsibility for his trading results. There must be a plan to use and follow a methodology with discipline and focus.
The major mistake that new traders make is that they believe activity is equivalent to success.
As a Darvas-style trader, ONLY the very best stocks in the market should be bought. Buying junk stocks or trying to watch 100 stocks at one time is a waste of time.
Insider buying is not a good indicator, so trade the chart not, the insider’s sentiments.
My First Crisis
In this chapter of the book, the author tried to find out the following through fundamental analysis –
- The strongest industry
- The strongest company within that industry.
Whenever a stock started to act better than the market he immediately looked at the behaviour of the other stocks of the same industry. If those too behaved well, he looked for the leader- the stock that was acting best. He reasoned if he could not make money with the leader, he would certainly not make money with the others.
He started compiling earnings of whole industry groups like oil, steel, motor and aircraft. He compared their earnings and carefully evaluated their profit margins, the price-earnings ratios and their capitalizations.
Finally, after an enormous amount of concentration, he determined that the steel industry was the vehicle, which would make him rich.
Based on this judgement, he selected JONES & LAUGHLIN at 52.25 on margin, which was 70% at that time. On the 23rd of September 1955, he bought 1,000 shares for $52,652.30 and he had to deposit $36,856.61 in cash. To raise this amount he kept all his assets as a guarantee. According to his most scientific and detailed research, he was sure nothing could go wrong.
On October 10th, the stock dropped to $44, and he sold his stocks with a net loss of $9069.18. He was discontented because it was not a gamble but a scientifically selected stock. He continued because he had to save his property.
Based on further analyzing the stock tables he noticed Texas Gulf Producing was rising, a stock he never heard of. He knew nothing about the company’s fundamentals but still went for it only to recover more than half of the loss he made from Jones and Laughlin. This gave birth to his new theory known as “The Box Theory”. In the next chapter the author speaks about his Box Theory.
Takeaway- Trade the leader not the followers of the group. When you see a green stock in a red sea, then look for its industry and other stocks in the same industry. If the group is performing well then locate the strongest stock in that group, the best up-trending chart with the highest percentage of earnings and sales growth over the past 3 years.
Confidence is required in a trading method. However, complete confidence in any one trade can prove to be deadly. Anything can happen in the market. Some of the best traders in the world are right only 50% of the time.
Before you buy a stock, always determine the amount of money you are willing to lose and have a set stop loss point if you get wrong. You can also have a time stop to sell if it does not move by a particular time or a volatility stop if the stock starts moving much more than its average range which will inflate the anticipated risk.
The biggest reason to manage risk and position sizing is also for the sake of emotional and mental well being.
One of the most beneficial things that a trader can do is to look back at the stock’s chart over the last year with the 5-day exponential average, and also the 10, 50 and 200-day simple moving averages. Charts are maps that show where the buyers and sellers of the stock have been in the past and where they may still be waiting.
The Technician
The author realized that making a profit in the stock market isn't a matter of luck. One can be lucky once or twice but not consistently.
He then bought stocks of M&M Wood Working on the same principles as Texas Gulf Producing. He did not know much about it but assumed from its continuous rising and high volume that some people knew a lot more about it. He made a profit in the stock.
Later he bought 200 shares of Pittsburgh Metallurgical and incurred a loss of $2023. After an extensive analysis, he found that he had bought the stock at the top of an 18-point rise. It was the right stock bought at the wrong time.
He learned that stocks do not move haphazardly. Their movement is determined by an upper and lower limit. These limits act as a perimeter which the author called “boxes”. The stock price oscillates in these boxes. This was the inception of his Box Theory.
He then used his theory on 3 stocks to make a profit but suffered a significant loss in the 4th one, which took him back to where he had started. This experience taught him the following lessons–
- There are no sure things in trading. Anything can happen in the stock market. Even the best traders have about a 50% win rate in their trading.
- A trader's goal is not to be right every time. It is to lose little when wrong and win big when right. The main goal is to make money and not prove anything to anyone. Hence, there is no place for pride and ego.
- It is better not to stick to any theory. The actual price action should be traded, not the personal opinions about where the market ‘should’ be going.
- Reduce the risks as far as possible. The key to successful trading is to maximize profits and minimize risks. A big risk for little profit is dangerous and eventually tends to blow up the account.
The author started including stop loss in his orders so that just when the stock falls below the expected price, he would not own them.
He defined his goals in the market as follows:
- Right stocks
- Right timing
- Small losses
- Big profits
To realize these goals, he had the subsequent tools:
- Price and Volume
- Box theory
- Automatic buy-order
- Stop-loss sell-order
Takeaway- Trading with luck is mere gambling. Good traders are not gamblers; they have a proven method that allows them to trade with the odds in their favour.
The price action of each stock tells a story. Daily increasing prices represent increasing demand and the unwillingness of holders to turn it loose. Stagnant prices show their indifference either way up or down. A trading range of stock shows where the buyers are willing to step in and where they are waiting to sell the stock.
A stock with continuously increasing volume shows that many people are accumulating it at even higher prices because they know about its future potential. Instead of looking for the reason, it is good to get on board and see how far it takes.
The two elements for successful trading are finding the right stock with the potential to trend up in price and then buying it at the right time. Buying it too early could result in dead money and buying it after it has run too far will be the end of the trend. Buying it on the initial breakout of the Darvas price box is essential for being successful.
Studying the last year's chart of any stock is important to ascertain its support and resistance levels. These levels are meaningful because traders and investors wait to get in or out of a trade at those prices.
An exit strategy is important in every trade to lock in profits on the winners to avoid holding them as they become losers.
Darvas did not exit based on his sentiment. He continuously moved a stop loss up to the point where he would be stopped out if price boxes started turning around. This helped him to take out with profits still intact.
Cables Round The World
In this chapter, Darvas talked about the time of his life when he signed up for a 2-year tour all around the world. He was apprehensive about operating from other countries. Thus he and his broker chose to stay in touch via cables (a method of communication at that time) and used Barton’s financial journal to look for stocks.
He began giving instructions to his broker over cables. His cables from the broker had the closing price, the box which comprised the upper and lowest ranges throughout the day, and the general market trend. Whenever he suffered a loss he wrote the reason for it and decided to never repeat the mistake. After some time, he started getting sold out of all the stocks he owned because of the stop loss. He could not figure it out at first but later when it was declared a bear market.
With the help of his theory He was able to come out of the stocks without incurring a huge loss and this gave him great confidence because his theory worked. He was on his own without any news and still, he was able to get out of the market on time.
Takeaway- Nicolas Darvas was able to completely withdraw himself emotionally from the daily gyrations of the market by simply not watching it. His stop losses would take him out if there was a wild sell-off in his stock. By doing this he saved much of the emotional capital that everyday traders spend freely by watching each tick of the stock and living the wins and losses in real-time.
Not only did Darvas trade off only the end of day prices; he wanted to know the day’s complete price range. He needed to know every price that people were buying and selling the stock at, throughout the day so he could create his boxes of support and resistance.
According to Darvas, the path to failure in trading lies in confusion, watching CNBC, listening to rumours on message boards and getting opinions about the positions from every possible person. The path to success lies in the focus on where capital is flowing, reading the charts, buying the best stocks in uptrends and holding them until stopped out.
One of the simplest principles of stock market success is trading a handful of the best stocks based only on price action.
Darvas also recommends a trading journal because each trade is an opportunity to learn about the market action, ego and emotions of greed and fear.
When a trader buys a stock, he must have an exit price. The exit must be planned and honoured. The first exit is always the best.
The Darvas system is a great trading method because it follows price action and does not predict the future.
In the beginning, a trader might get lucky and make some money which will later be lost in one big trade or a string of losers. This is all part of the learning process. Traders should not get discouraged and quiet because to make money in the stock market one has to pay dues first and get a hands-on education.
The Techno-Fundamentalist
Nicholas Darvas put up with the market for what it was and realized that he could not do anything but wait for better times to come. However, during this time he constantly kept his eyes on the stocks.
He selected stocks based on his technical theory but only bought them if their fundamentals were right. This is how he reached his techno-fundamentalist theory.
He knew that he had to find companies that were coming up with something big. For example, automobile giants were once small companies and people who invested in them then made a lot of money. Hence, he decided to find small companies that had a bright future in the coming months or years. These were high velocity, expensive-but-cheap stocks, which means their prices were high but valuations were cheap.
He was now placed with 5 years of experience with lessons he got from his journey –
- The Canadian period trained him not to gamble.
- The Fundamentalist period taught him about industries, dividends, earnings, etc.
- The Technical period taught him how to analyze the price movement of the stocks.
Takeaway- The market does not care about one’s opinion. It's better not to waste our emotional and mental energy cheering on our stock.
Another thing a trader should overcome is their preference. To win in the market one has to really look at what the stock market is doing. It is not about what your opinion is; it is about what the market is doing.
The growth and expectations in earnings can indicate what to buy but the charts display when to buy it.
The Theory Starts To Work
Now, the techno- fundamentalist theory has started to work. In November 1957, Darvas noticed a stock- Lorillard. The stock fit his theory. Its volume for that week had increased sharply from an average of 10000 shares to 126700 shares. The constant rise in price and volume indicated the incredible interest in that stock.
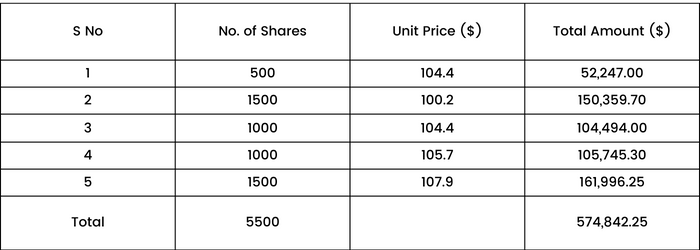
He bought the shares at the following rates –
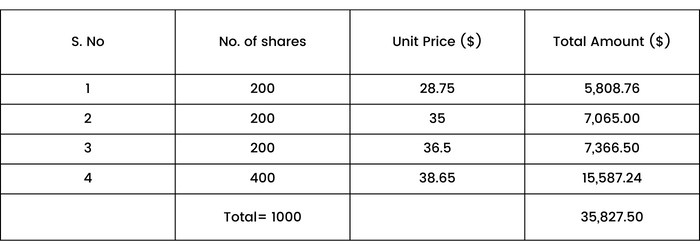
Then he bought Diner’s club –
He got out of the Diner’s club because it fell below the stop loss. His theory worked and he received $35,848.85, making an overall profit of $10,328.05. He was able to book profit just based on cables and Barton’s.
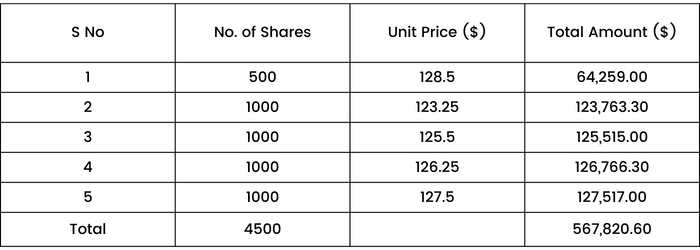
Next he noticed that the stock EL Bruce meets his theory. He chose to sell Lorillard and invest the money in EL Bruce. He sold all of the 1000 shares at an average price of 57⅜ making a profit of $21,052.95.
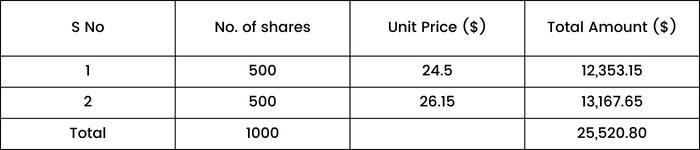
He bought EL Bruce at the following prices-
He was suggested to sell these shares at a $100 unit price but he didn’t because according to his theory, the stock still showed indications of growth. He gradually sold his stocks in blocks of 100-200 shares at an average price of $171. He made a $295,305.45 profit on this stock.
Takeaway- Great stocks can be found by looking at their price strength even in a weak market. A big clue is higher highs and increasing volume. Companies that are transforming the world through new and innovative products will tend to have stocks that rocket higher if the earnings expectations are considerable enough.
Traders should not be afraid to be stopped out of a trade. On the other hand, they must turn around and go back in when it starts acting right.
It is stupid to hold onto wrong opinions stubbornly. It is smart to change opinions to fit the price action.
Darvas was an expert at adding to winners on each leg up. This enables maximising returns and multiplying profits when a trader is in the right stock in an uptrend.
One secret of most of the best traders is to go into every trade, presuming it is a loser. This helps to mentally deal with the loss before it happens. It also helps to keep a neutral opinion. One cannot control what the market does, so they have to be prepared to take a loss every time one enters a trade.
To keep the big profits which are accumulated during the uptrend, stop loss must be trailing so that it can lock in profits and not be given back.
A trader will be able to make large profits in the right situation if he does regular homework and doesn't give up. Homework might include reading books, building an initial trading account, attending seminars, using coaches, but not quitting during the learning process.
My First Half-Million
The overwhelming success on the stock E. L. BRUCE had made Darvas more cautious. He had made over $325,000 in nine months’ investment and was determined not to lose it by a wrong move.
Many operators made big money in nine months and lost it in nine weeks. The first step he took was to withdraw half of his profits from the market. With the remaining capital, he monitored the market carefully, watching for potential new well-behaved stocks.
He ventured back to Lorillard only to be sold out thrice. He realised that this stock no longer worked for him.
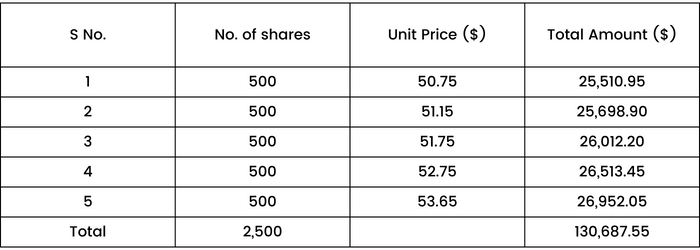
In July 1958, ‘Universal Products’, then an unknown company grabbed the author’s attention as it satisfied his theory. The price was $35 and fluctuated between $35.85 and $33.5. To get the feel of the stock movement he purchased 300 stocks at $35.25.
In the third week of August 1958, he bought 1200 shares at $36.5 with a stop loss of $33. He bought 1500 more shares within the next few days.
His transactions for Universal Products were–

Pursuing the same theory, he went on to buy 6000 shares of Thiokol for $350,820 in various transactions. Thiokol reached $100 and Universal Products was $45. He was tempted to sell but he decided to hold.
In January 1959, when Darvas returned to New York, his brokers informed him that his overall profits in the stock market were more than half a million dollars.
Takeaway- Great traders are always mindful and understand that it is likely to give back all the trading profits with a series of bad trading losses if the risk is not controlled. Overconfidence is extremely dangerous and doesn't consider the skills and trading record of a trader. Keeping the money made should be the first and foremost priority.
It is not advisable to habitually go back to a favourite stock that has made money in the past; its run is likely over unless it shows the best price strength again.
Big profits are usually made at the beginning of a new bull market. It is essential to take the first few leading stocks that show breakouts above old resistance levels because these will be the biggest winners in a bull cycle. At the same time maximum leverage should be added to the winners as paper profits assemble. It is futile to wait for a pullback at the onset of the new trend because there may not be one. Hence it is better to take the buy signals when they occur.
Nothing focuses the mind like purchasing even a few shares of a company. It is like being in the game from being a spectator. Taking a tiny position will also amaze you at the focus on the price action that you will unexpectedly gain.
A common trait of rich traders is that they hold their opinion loosely. They know that they could be wrong on any trade at any time. At times, they will instantly flip and reverse a position that they believed in because of an unexpected reversal or event.
At one point, Darvas was carrying about one-third of his entire account on one stock, which looked reckless. However, the deep thought behind such trade was:
- He only bought the strongest stocks at a breakout from a prior trading range. This good entry put the odds in his favour.
- He added more stock only after he had paper profits in his initial holdings.
- He had the stops in place to limit losses.
- He was long mostly when the market was in an uptrend.
- He focused only on a few stocks, so he was well aware of their movements and volatility.
Traders find it difficult to let their profits run long. On the contrary, they let their losses run because they don't want a loss. They choose to wait for it to come back. Traders also get nervous about profits because of the fear that the market will take them back, so they lock them in a hurry and end up with small wins and big losses.
My Second Crisis
The half-million-dollar news gave tremendous confidence to the author. He had a very clear conception of how he had done it and was also convinced that he could repeat the feat. He had developed a sixth sense of working with the cables and had mastered the art.
The huge profit turned his confidence into overconfidence. He started operating from his broker’s office and stopped telling stop loss. He was not following his theory anymore and started listening to everyone except himself. As a result, within a few weeks, he lost $96,588.
He noticed all sorts of distractions and realised his mistake.
He went to Paris and gave special instructions to his broker to only communicate through usual telegrams.
Initially, it was difficult for him to find his rhythm once again, but he finally did.
Takeaway- Arrogance is one of the most dangerous traits a trader can possess. It results in trading big at wrong and late entry points which results in losses. When a trader thinks he is more clever than the market action itself, he is setting himself up to take big losses. Everyone is always a student of the market, no one is ever its master.
Many traders underrate the psychological consequence of drastically increasing position size and trading with a much bigger account in a short period. To be successful in trading it is much better to start smaller and ease up in account size gradually over years. It is also beneficial for stress management to lower the percentage of capital at risk.
No one can ‘predict’ what will happen in the stock market because that would mean being able to read the minds of the millions of market participants, being able to see all breaking news before it happens and even knowing how the market will respond to that news. He would also be able to anticipate every political move before it was made.
What works is reading the price action and trading reality, buying at supports, selling at resistance, following trends, managing risk and staying modest and disciplined after big wins.
The market cannot beat a trader if he goes with the trend, manages risk and trades a strong system with confidence.
The weakest part of any trading method is the trader and his emotions. To improve trading one has to overcome emotions, strengthen self confidence and discipline in trading.
Greed causes traders to blindly look at price targets while ignoring the downside risk. This is the road to destruction. Risk management ALWAYS comes before thinking about profits.
Following are the causes for being unable to read price action correctly:
- Trading too big causes emotions to overtake.
- Looking at too many stocks.
- Allowing greed to alter the way one looks at charts.
- Letting people’s opinions influence you.
It is important to have definite rules for price action which stop from drifting away from the actual happenings. Traders should stay sharp and neutral to outcomes.
Two Million Dollars
Darvas asked his brokers to send telegrams after the market closed. He kept away from all financial commentaries. As prices began to fall, he chose to sell Universal products and made a profit of $409,356.48.
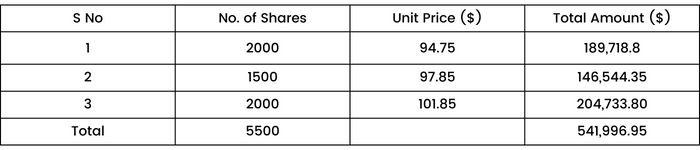
Now he had a huge sum to invest and he did it in Texas instruments at the following prices –
He then profited $862,031.52 from Thiokol. He invested in Zenith Radio,Fairchild Camera, Litton Industries, and Beckman Instruments to get a fair idea of these stocks.
After observing these, he moved on with ZenithRadio and Fairchild Camera. His transactions were-
Zenith Radio:
Fairchild Camera:
On June 9th, the author received the quotes of his stocks. He compared it with the previous day's quotes to find that his holding appreciated $100k in that single day.
He had to leave New York for his professional commitments. Before going, he found that if he sells his stocks, he will make over $2,250,000. That is how he finally made $2 million in the stock market.
He felt pleased because he was doing what he liked. He worked while Wall Street slept.
Takeaway- Discipline to stick with a winning system will determine success in trading over the long term.
A pure Darvas system trader has the benefit of not having to watch the live market. The essential principle here is not to get entrapped in the intraday fluctuations of stock prices but to look at the longer-term price action and trend.
Another key characteristic of the Darvas system is not to be sold out until the stop loss or trailing stop is hit.
The winning system of Nicolas Darvas’ includes entering trades that break out of price boxes. If it retraces back under the breakout, sell for a small loss and if it keeps going up, let it run with a trailing stop under rational past price support. This results in big winners and small losers if the market is in an uptrend.
These are the principles of the Darvas method:
- In an up-trending market buy a rising growth stock as it breaks out of a conventional price range to all-time highs and let it run as far as it will go. Do not use a price target to sell, instead sell only when the stock reverses and stops out by losing short-term support.
- While winning with a rising trending stock, add more shares early in the move.
- Always have a stop in place to lock in profits and get out of Darvas stock while it is near all-time highs but loses short-term support levels.
Conclusion
Darvas principle in a nutshell-
1. Go long only in a market that is in an uptrend
According to the author, when the market is above the 50 day simple moving average it is in an uptrend. If it falls below the 50 day it is perhaps the beginning of a downtrend. If there is a reversal near the 200-day simple moving average, it is an indication to start taking small long positions again.
2. Only trade the Monster stocks.
Buy the best stocks to make the most money. The best stocks are those that would be changing an industry or even the world through new products or services, innovation or advanced technology that gives them a huge advantage over their competition. Growth is what one should look for.
3. Enter stocks at high probability moments.
The key entry points for Darvas stocks are:
- At a breakout to new all-time highs in price.
- Price bouncing at the bottom of a well-defined Darvas price box.
- The stock bounces off or breaks out above the 50 or 200 day moving average.
4. Let the winner run.
Do not limit the upside potential. The right stock in the right market can make a run that is beyond anyone’s prediction, measurement or target.
5. If you are wrong, get out quickly.
Keeping losses small is the biggest key that separates winning trades from losing trades. Stop loss and trailing stop should not be neglected.
6. Do not waste your emotional and mental capital watching every tick of your stock.
Many traders lose because they just get burnt out because of the market fluctuations. Losing and making money minute by minute. According to the Darvas system, buy stops, limit orders and stop losses or just check the open and close prices to see what is going on.
7. Always do your homework.
Even when the market is bearish, never stop looking for the potential stocks.Traders have to be ready always to start buying when the time is right. Keep a watch list and watch it.
8. Pyramiding
Never add to a losing trade. It ruins the trading, mental and emotional capital. The key is to add early to the winning trades not late in the move.


