Macroeconomic Factors Affecting Stock Market
Introduction
What Are Macroeconomic Factors?
Macroeconomic factors are conditions that affect the entire economy of a country or region. These can include things like how much a country produces, how many people are out of work, or how fast inflation occurs. These factors don’t just affect a few people, they impact businesses, government, and the whole economy. That’s why governments, companies, and consumers keep a close eye on these changes to understand what’s happening in the economy.
Now, in the case of investment, the rule of thumb says that one must think like a business owner while investing in a company.
Consider a Petrol Pump chain that is up for grabs.
As a potential investor, it is natural that the first number to gaugewill be the annual sales & profit figures.
You notice an increasing trend in the numbers. The reported margins are impressive compared to industry standards. The company has been on an expansion spree & plans to add more outlets this fiscal. The entire expansion is funded through equity. All stores are owned which gives the company the dual advantage of rental savings as well as price appreciation of property. Debt is negligible & the working capital cycle does not appear to be stretched.
The best part amongst all this is that the existing owner quotes a reasonable price.
Will You Go Ahead with the Investment?
Well, prima facie, it does appear to be a good deal. Let us now take into consideration some alternative scenarios:
- Crude Oil prices are expected to go up which is likely to dent retailing margins
- Automobile companies are increasingly shunning traditional fossil fuel churning cars. There is a clamour in the Electric Vehicles space with market stalwarts such as Apple & Xiaomi joining the race.
- Business & consumer sentiment in the economy is at an all-time low. The economic growth in the country is lagging & people are shunning purchases of everything under the non-essentials tagline.
- The entire due diligence process for finalizing this investment will take some time to complete from our end. The board has decided to fund this acquisition by taking a loan from the bank. However, consensus expectations point to a significant interest rate hike in the coming months. This situation will inevitably lead to a higher net outgo & it will take another year for you to break even.
- Commodity prices are expected to go up. This will lead to a cost escalation for automobile manufacturing firms. The cost-sensitive consumer will put purchases on hold. As a result, demand for petrol & diesel might fall going forward.
- The Rupee is expected to depreciate. This may push up the cost of imports and impact profitability if pump prices are not increased by a similar quantum.
- The government is coming up with a proposal to hike taxes on petrol & diesel. It also announces incentives for shifting to greener means of commute.
- Hardening bond yields in the USA suggest that the government has no choice but to raise interest rates earlier than expected. This would make further investments.
In the light of these developments, an outstanding potential investment might turn out to be a mediocre one or perhaps even a loss-making idea in due course of time. In each of these scenarios, we have highlighted potential macroeconomic factors to the business-
- Crude Oil prices
- Technological Shifts
- GDP
- Monetary Policy
- Inflation
- Exchange Rate Movements
- Fiscal Policy
- Bond Yields in that order.
Such is also the case with Equity Investments. Just like any other business, equity investing too comes with a risk profile of its own. Therefore, it becomes crucial to have a comprehensive understanding of different risk factors in play with the ultimate objective of maximizing alpha.
Stock returns are a function of many micro and macroeconomic factors other than the fundamentals of the company.
It is a norm for listed companies to disclose their financial performance quarterly. Hence, out of two hundred & fifty trading days in a calendar year, it is only on four days that there is some material information to reflect on. Add to this number a maximum of fifteen noteworthy Corporate Disclosures such as Dividends, Loan repayments, Credit Ratings, Changes in the Board of Directors, Mergers & Acquisitions, Analyst Meets, and so on. Alongside these, macroeconomic factors such as interest rate changes, inflation data, and GDP growth can also influence market sentiment and trigger re-evaluations.
This amounts to a sum total of approximately twenty days in a year. It is on these days that market participants revise their earning estimates on account of the updated information & arrive at a new equilibrium price where demand equals supply.
Some investors also address the remaining two hundred thirty days of trading activity as a random walk or more simply put, noise. A “random walk” is a statistical phenomenon where a variable follows no discernible trend and moves seemingly at random. Otherwise speaking, this theory implies that stock price changes are random & cannot be predicted.
The relevance of such a concept remains widely debated by market experts. Nonetheless, comprehensive knowledge of the different macroeconomic factors affecting stock market will help you decipher if the recent market correction was an indication of complete trend-reversal or just a temporary blip in your journey towards financial freedom.
Factor 1 - Crude Oil
First & foremost, it's time to get familiar with India's Achilles Heel- Crude Oil.
Crude Oil is a key macroeconomic factor because its price directly affects inflation, production costs, and trade balances.
India is the world's third-largest importer & consumer of Crude Oil after The USA & China. Crude Oil is the second major source of primary commercial energy in India after coal. The country meets more than 80% of its requirements through imports. The Crude Oil Import Bill for FY2024 stood at $132.4 billion.
India’s economic growth is closely related to its energy demand, therefore, the need for Oil & Gas is expected to increase at a steady pace for many years to come. According to some reports, Crude Oil consumption in India is expected to touch 500 million tonnes by FY2040, from 233.3 million tonnes in FY2024 implying a CAGR of around 4.8%.
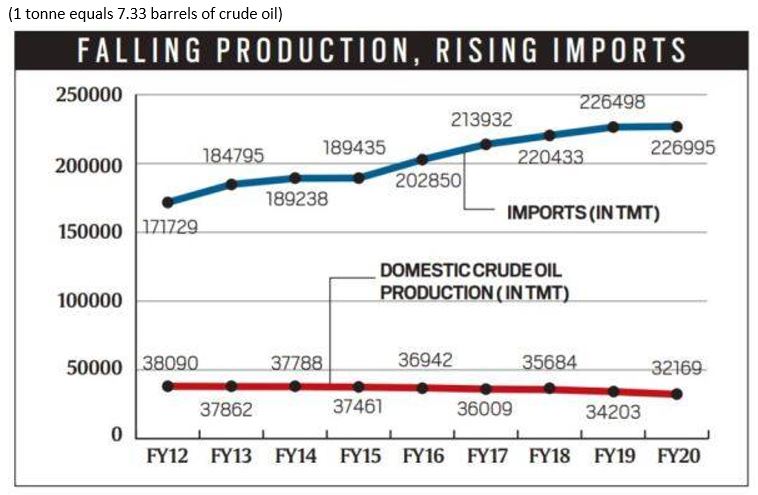
The domestic production of Crude Oil has virtually stagnated over the years. India is producing less & less oil with every passing year. Experts have blamed the steady decline in production on ageing wells that have become less productive with time coupled with the lack of new oil discoveries in the country.
Many industries depend on healthy crude oil prices for their smooth functioning. Any adverse change in prices might erode the profit margins of companies operating in sectors such as Automobile Ancillaries such as Tyres & Lubricants, Aviation, Chemicals, Footwear, Paints, Plastics and others.
A rise in Crude Oil prices worsens the Trade Deficit which in turn affects the Current Account Deficit (CAD) since the country largely relies on imports to meet demand. According to some estimates, every $10 per barrel rise in crude oil worsens India's CAD by 0.5% of the GDP or $15 billion. A widening CAD puts pressure on the Rupee's value vis-a-vis foreign currencies. A similar magnitude of price change would also impact the GDP by 20 to 30 basis points.
Note: If you are confused with the term GDP, worry not. It is among the important macroeconomic factors that we will elaborate on the concept of GDP in Unit 4 of this module.
At this stage, the vicious cycle starts to hit the common man rather acutely. Surging oil prices spill over to the consumer basket of goods & services as a cascading effect. Ultimately labourers start demanding higher wages & the economy witnesses an inflationary spiral.
To combat inflationary pressures from rising prices, the Central & State Governments are forced to slash excise duties that lead to lower tax collections. Topping it, the subsidy bill for Kerosene & LPG cylinders goes up. A $10 increase in crude oil prices burdens the fiscal headroom by about $2 billion or ₹15,000 crores- in the form of cooking fuel subsidies.
The net result of all the furore is that India remains at the mercy & behest of OPEC nations for its economic well-being.
In this regard, it is imperative to get the idea that these factors are not congruous across the spectrum. Every economy has its inherent strengths as well as pain points. For instance, Oil-Rich Gulf Nations such as Saudi Arabia, Oman, Qatar, Bahrain, and others.
Factor 2 - Technological Shifts
We will be continuing this discussion with the Oil & Gas sector in the spotlight. In this section, we will analyse a major technological shift that completely altered the fate of the Industry- The US Shale Revolution
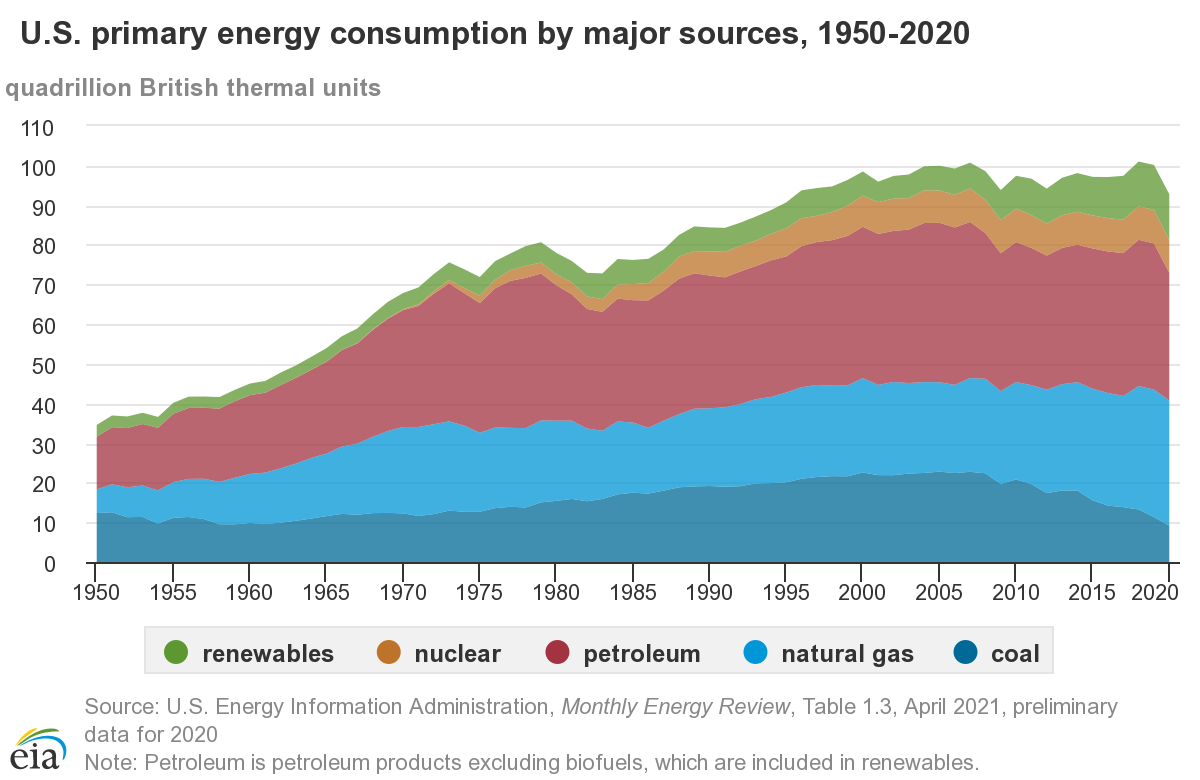
The shale gas boom had colossal effects on the demand-supply dynamics of the Crude Oil market. Thanks to investments in new extraction techniques- drilling of horizontal wells & hydraulic fracking- it made the production of gas cheaper compared to traditional methods. As a result, the soaring global economy was able to tap vast resources of unconventional gas spread across the USA. The Shale Oil Boom enhanced the United States’ energy security, reduced CO2 emissions & greenhouse gas pollution. The share of Natural Gas in the US's energy mix expanded rapidly after 2010, denting the prospects of Coal- a heavy carbon emitter:
The country's economy also benefited substantially from the cheap energy, revitalizing prospects for growth & providing employment opportunities to millions. What happened next is summarized in the next few slides:
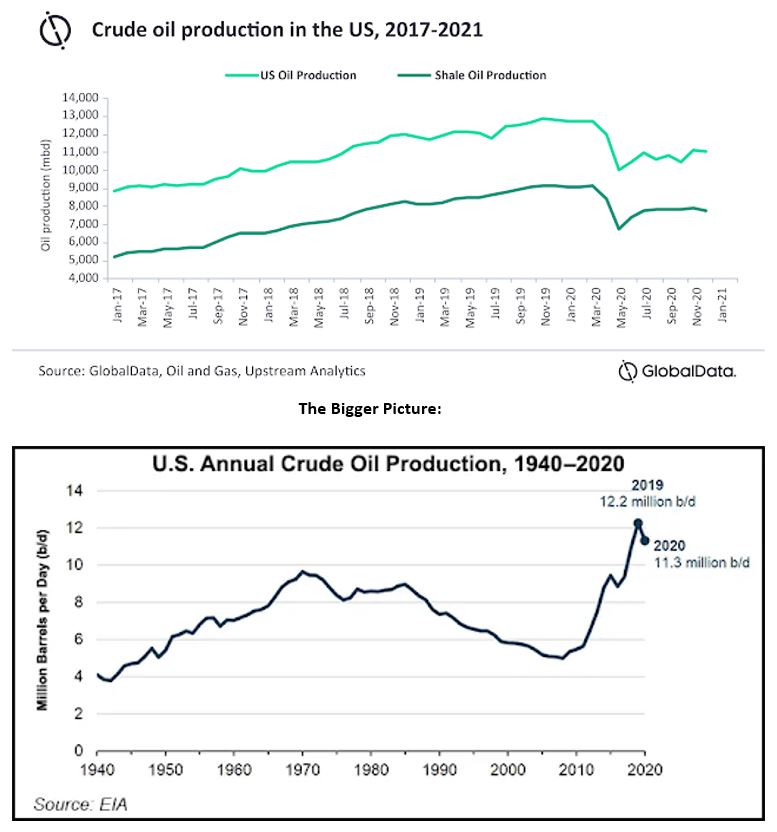
Our point of contention however remains the broader outlook of it, so, we will be ignoring the pandemic-induced fall in production. As a matter of fact, operations are returning to normalcy & this can be interpreted from the Rising Rig Counts.
The Shale Oil Revolution helped The US to cement its place as the world's largest Oil Producer overtaking the legacy of Saudi Arabia, long considered as the world's "swing" supplier of Crude Oil. The geopolitics of Oil is also shifting as the balance of supply moves away from OPEC nations. Reports suggest that Non-OPEC nations such as The USA, Canada, Brazil, Guyana & Norway are expected to lead much of the output growth in the next five years.
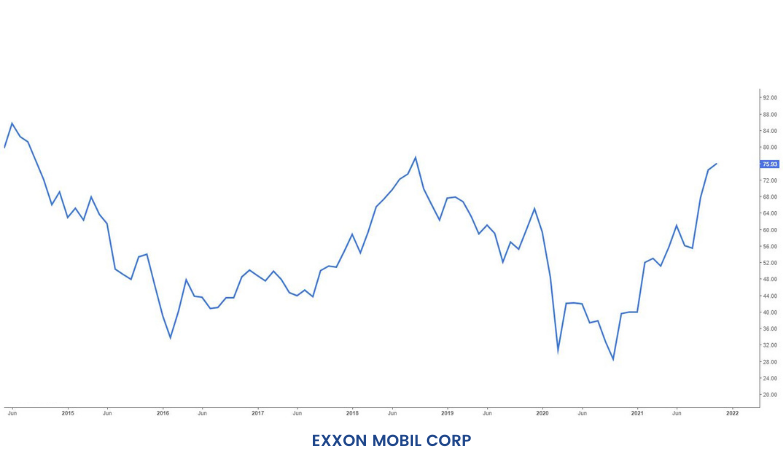
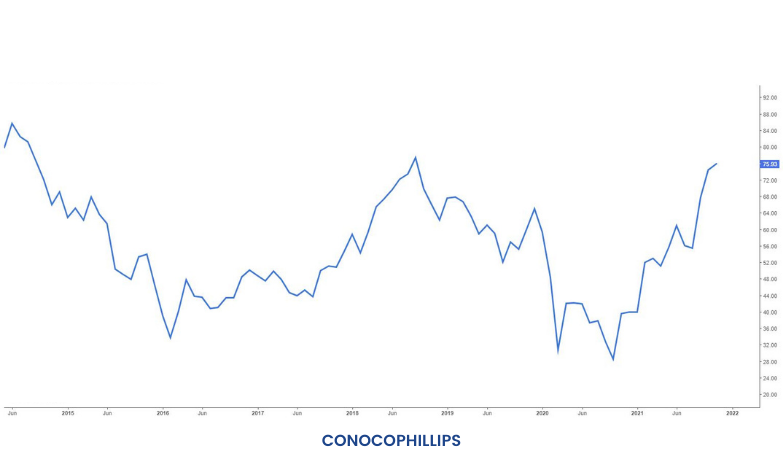
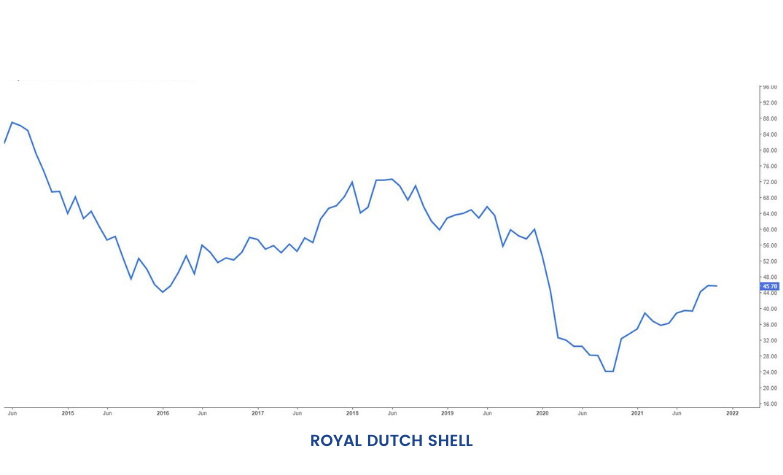
Let us see how the Oil & Gas sector has performed during the Shale Boom since 2010. Here is the last five years date from 2015 to 2020. Also, an investor must acknowledge that this sector is cyclical & dividends are a major source of income for shareholders.

Likewise the shale boom, many economists are predicting that "Peak" Oil production, a hypothetical point after which the global crude-oil production will reach its maximum point & start declining has been realized in the aftermath of the COVID crisis. Only time can respond to such a prophecy.
It becomes amply clear that the introduction of new technologies can have potentially sizable effects on the prospects of the industry & the economy as a whole. So, we can count Technological Shift as another important macroeconomic factor affecting stock market. Investors must pay attention to the evolving nature of financial markets & observe the strategy being employed by global peers towards shifting preferences. A similar scenario seems to be unfolding in the Information Technology sector where Time-honoured Enterprise software companies like TCS and Infosys are being threatened by the advent of new-age & agile Software as a service (or SaaS) start-ups.
Factor 3 - Gross Domestic Product (GDP)
Previously while discussing Crude Oil as one of the important macroeconomic factors, we have come across the term GDP multiple times. So, in this section, let us understand Gross Domestic Product (GDP) and how this macroeconomic factor affects the stock market.
Gross Domestic Product or GDP is the total value of goods & services produced in an economy during a particular period of time.
The stock market is a leading indicator of economic health. Stock valuations imbibe an element known as forward earnings that take into account future earnings outlook instead of the present scenario.
A rising stock market indicates that a period of economic expansion is likely to follow. This is reflected in increased production and earnings growth. Investments are high & overall economic sentiment is buoyant. Hence, Market participants drive up the demand for shares that will likely outperform.
Companies reporting excellent profitability in the upcycle use some of the free cash flow to repay their liabilities. It has been seen that corporate debt comes down drastically during periods of optimism. Logically, interest costs also head south. \
The stock market and the economy are often used interchangeably- but they do not mean the same thing. Factually, the stock market is just a part of the overall economy. Of course, there exists the age-old tussle If the stock market is a reliable gauge for the economy with strong arguments from both supporters and naysayers.
The fallacy in this altercation is that the economy is too complex a thing to be surveyed by a sole metric. It is like measuring an entire classroom of students based on an index of average GPAs.
We would like to draw the attention of our readers to the fact that none of the macroeconomic factors and their implications discussed in this reading should be taken as a concrete message. There are always exceptions and outliers:
The first picture reflects the GDP per Capita of Brazil in USD terms. It is amply visible that the GDP peaked out in 2011 and hasn't yet returned to those levels.


However, the market capitalization of companies listed on the Sao Paulo or B3 Stock Exchange- represented by the BOVESPA Index has doubled in value between 2012 and 2021. The stock market appears to be in good shape & is perhaps even more expensive than before. It becomes almost certain that there are factors other than the absolute GDP figures that are at play. More specifically:

The Brazilian Real has depreciated by around 70% since 2011 and that number probably explains a lot. We will cover this topic in greater detail in the subsequent parts when we discuss Exchange Rate movement and its impact on stock prices. For now, the point to draw home is - prima facie it may appear that the BOVESPA index has given stealthy returns, in materiality it has underperformed on all counts.
Things in Japan are no different either- the GDP topped out in 2012 but the Nikkei Index is up almost three and a half times since then.
Investors often use a metric-Market Capitalization-to-GDP ratio, also known as the Buffett Indicator to check if the current stock valuations appear reasonable or not.

The stock market is all about money. Therefore, demand and supply of money have an essential role in affecting the market. So, in the next section, we will discuss Monetary Policy, our fourth macroeconomic factor affecting stock markets.
Factor 4 - Monetary Policy
Money, Money, Money!
The basic relationship between Money Supply & Stock Markets is simple.
Low Interest Rates = More Money Supply
Lower interest rates mean lower borrowing costs for companies & the government alike. A lower interest outgo results in significant improvement of the bottom line of corporations that are waist-deep in debt. Higher earnings in turn, imply higher book value of companies as well as higher P/E multiples. In a low-interest-rate environment, conservative investors who generally do not think beyond Fixed Deposits or Public Provident Funds may also shift to other lucrative assets. An interest rate cut lowers the hurdle rate for investments & encourages entrepreneurs to borrow more & invest in their business. The transmission goes somewhat like this:

Long story short - an interest rate cut is perceived as a positive news flow by the markets.
The Federal Reserve has vowed to keep interest rates at near-zero through at least 2023 and even beyond. And it is not just the Federal Reserve that is following an expansionary monetary policy. Interest Rates have sunk into the negative territory in countries such as Denmark, Sweden, Japan, Spain & Switzerland. Negative Interest Rates essentially imply that savings are penalized in such an economy and borrowers must be rewarded.
While some of this increased money supply may be channelled into productive investments, a good proportion of this amount is likely to find its way into assets such as Bonds, Equities, Real Estate, Commodities, and the like. Actually, the truth is, a world flush with liquidity is speculating on asset prices like never before!

Hyper low-Interest Rates around the globe send Foreign Institutional Investors (FII's) flocking to risky assets in Emerging Markets (EM's) like India. Investment by Foreign Investors in Indian markets reached a Two-decade peak in FY 2020-21, at a staggering $37 billion as per data from National Securities Depository Limited (NSDL).
But what happens when the cycle reverses?
Yes, you guessed it right. Higher Interest rates tend to negatively affect corporate earnings & stock prices for the same reasons we discussed above. Rising interest rates in Developed Economies start ringing alarm bells for EM's due to the risk of capital outflows where the return on investments such as bonds & fixed deposits has suddenly increased.
The looming fear is a repeat of the “taper tantrum” episode of 2013 when indications of an earlier-than-expected tapering of US bond purchases by the Federal Reserve caused a rush of capital outflows from emerging markets.
If an investment is withdrawn- in all probability if interest rates rise- it is bound to leave a gaping hole in the recipient country's financial system. As a result. the home currency depreciates and investors fear the end of the bull market aka the bubble has burst.
So, we have learned how the rise and fall in interest rates, the crucial macroeconomic factor affecting the stock market. However, there is another macroeconomic factor, i.e., "Inflation." Let us discuss the impact of inflation on the stock market in the next section.
Factor 5 – Inflation
Inflation signifies an increase in the aggregate price level of a basket of goods & services. In India, The Consumer Price Index (CPI) and The Wholesale Price Index (WPI) are the widely accepted barometers for tracking inflation. An Interest rate hike is the textbook solution to counter inflationary pressures. However, high-interest rates are against the greater good of society. The Central Bank stands in midst of this bemusement & balances its stance between Hawkish & Dovish.
It is argued that equities are a great hedge against inflation. This is primarily because earnings tend to rise in tandem with the general price rise in the economy. A moderate price rise is generally considered inflation to be a macroeconomic factor of a healthy economy.
How Do You Exactly Quantify "Moderate" Inflation?
For starters, The Reserve Bank of India has set a target inflation band of 4% +/- a band of 2%. Any number within this range can be termed reasonable in the Indian context. A high inflation number might be a sign of an overheated economy and is one of the key macroeconomic factors that policymakers closely monitor.
Although expectations of inflation are baked in nominal interest rates offered to fixed-income security holders, any surprise on the flip-side can eat into the real returns.
Rapid Inflation increases the input costs of companies. For instance, an increase in Crude Oil prices is beneficial to Upstream Oil companies such as ONGC, Oil India, HOEC, etc. but it might severely dent the prospects of companies such as Interglobe Aviation, Asian Paints, JK Tyres that use Crude Oil as a raw material.
Similarly, Rising Iron-Ore prices will improve the earnings outlook for Iron-ore producers such as NMDC, Vedanta, and KIOCL. Nonetheless, stocks such as Tata Steel, Jindal Steel & Power, JSW Steel that use Iron-Ore as a raw material in the steel production process are expected to react negatively to this news development.
An inflationary environment is a death knell for those companies who do not command sufficient pricing power. It may also happen that companies are abstaining from transferring the increased costs of production on account of a benign economic environment. Leaders of the next market rally will be likely those who show resilience in tough times & seek to innovate during periods of downturn.
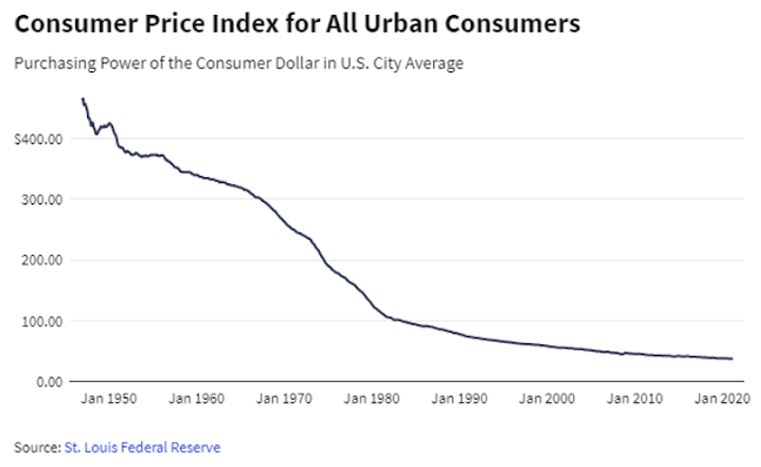
With time, Dollar Bills aka US Currency notes have been reduced to worthless pieces of paper. The steady declining purchasing power of the US Dollar is a great proxy of how Central Banks across the globe are colluding to steal from the pockets of the common man. Shoe-leather costs have gone up significantly since
By a continuing process of inflation, government can confiscate, secretly & unobserved, an important part of the wealth of their citizens - John Maynard Keynes
The graph on the previous page depicted how the money supply in the USA has gone up year after year, relentlessly. This slide however does justice to those statisticians who claim to have "uplifted" the economic doom by keeping the printing press rumbling, by providing a complete perspective.
No, the Greatest Heist in history was not the one connived by The Professor at The Royal Mint of Spain. It has been going on since the advent of the Modern Monetary Theory. It is happening right now as you are reading this module and another Dollar or Pound or Yen or Euro is printed out of thin air. This phenomenon essentially summarizes that there are no free lunches in this world.
Factor 6 - Exchange Rate Movement
This section will discuss the sixth macroeconomic factor that affects stock market, which is movements in the exchange rate, especially INR/USD.
It must be assumed here that we are using the INR/USD rate as a reference for our study.
Before delving into this topic, investors must understand that various micro-units of the economy work in sync with each other. Case in point- It is likely but not necessary that high GDP growth is accompanied by a loose monetary policy which in turn is followed by Inflation. It is not concrete that inflation is spurred by low-interest rates. The oddly high number can be a result of supply-side mismatches. The way our economy is closely knitted, there is always a cause-and-effect theory in action.
Coming back to our point of contention, The Forex Market is the largest as well as the most liquid financial market in the world, traded globally by a large number of individuals & organizations. With a daily trading volume in excess of $6.6 trillion, the magnitude is much higher than the equity market. The majority of forex trading takes place on forward markets instead of exchanges like the NSE and BSE. The EUR/USD currency pair is the most widely traded pair in the forex market. In fact, the US Dollar is the most traded currency as well making up 85% of all transactions!
As you must have noticed, exchange rates are not as volatile as stocks. Hence, the notional outstanding value of transactions is exceptionally high. Not even in the wildest dreams can one think of a 20% gap-up opening when it comes to currencies.
So, What Moves Exchange Rates?
A lot of dynamics viz Inflation, Interest Rates, Political Stability & Economic performance, Net Capital Inflows, Terms of Trade, Current Account Deficit (CAD) and Public Debts.
For the purpose of this module- we will be dwelling upon the former three macroeconomic factors:
a) Inflation- Differences in the rate of inflation between two countries are one of the primary reasons behind exchange rate movements. The currency of the country with a higher rate of inflation is expected to depreciate in value. One can also think about this idea in terms of demand-supply analysis. Inflation might be a result of an excess money supply in the economy. Simply put, the supply of currency is high. Other things unchanged, a rise in supply leads to a drop in the price of the currency.
Similarly, a country with a lower rate of inflation exhibits a rising currency value.
As an illustration, let us consider Annual Inflation in India & America to be 5% and 2% respectively. It is expected that INR will depreciate by approximately 3% against the USD or the USD will strengthen by approximately 3% against the INR in the next year
We can find out the exact expected inflation using Fisher's Approximation:
(1.05/1.02)-1 = 2.94%
(1+n)/(1+n)-1 = r
Where,
n = Nominal Interest Rate
i = Rate of Inflation
r = The Real Interest Rate
Thus, it is expected that the INR will depreciate by approximately 2.94% against the USD in the next year.
Earlier in this module, we had hinted at how a Falling Brazilian Real nullified the resilience in the BOVESPA Index.
The graph below depicts the Annual Inflation Rate in Brazil from 2011 onwards:

Meanwhile, Inflation in the US during this period averaged around 2% & this explains the unabated fall in BRL/USD exchange rates. We can safely say that the Brazilian Stock Market has underperformed on all counts after taking into account the impact of Inflation.
b) Interest Rates- The key takeaway here is these macroeconomic factors; Inflation, Interest Rates & Exchange Rates are all correlated with each other. A Rise in the domestic Interest Rate Level leads to an appreciation in the value of the home currency and vice-versa.
The logical reasoning behind this is no different either. High-Interest Rates lead to a fall in the demand for money. The total amount of currency in circulation reduces and hence, it is accompanied by a rise in the value of the currency. Another argument to support this proposition is that high interest rates may lead to a gush of capital inflow in the country as investors find it lucrative to park their surplus funds at higher yields.
c) Political Stability & Economic Performance- Foreign money favours countries that have a strong economy and a stable currency. The higher the capital inflows, the stronger is the currency. Among the key macroeconomic factors influencing this are political stability, inflation, and monetary policy.
The context of political stability becomes extreme especially while analysing emerging market currencies. It has been observed time and again that currencies of countries with grave political unrest have significantly underperformed their peers, Case in point- Zimbabwean Dollar, Venezuelan Bolivars (VEF), Turkish Lira (TRY), Syrian Pound (SYP), Egyptian Pound (EGP) and the like.
The Hyperinflation experienced by Venezuela has reduced the status of VEFs to nothing but toilet paper. The hard currency crisis is so acute that it has given birth to a thriving black market for USD.
The TRY was making headlines a little while ago when its currency shot up after Recep Tayyip Erdogan, President of Turkey fired the Central Bank head, Naci Ağbal after a brief stint of four months. The country is already in the midst of an economic crisis.

Now that we have established some foothold on this topic let us shift our focus back to equity markets and figure out how the two tango.
An open economy has trade relations with almost all countries in the world. When the value of the home currency depreciates, it makes domestic goods more competitive in the global market. Exporters tend to benefit as they can now fetch an increased value for their goods and services. The positive rub-off is visible in Information Technology and Pharmaceutical companies as they derive a maximum chunk of their sales from exports.
Quite logically, Companies that Import raw materials from abroad are adversely affected by a depreciating local currency as it increases their costs of imports. Importers have to shell more to purchase the same quantity of goods & services. Companies with foreign currency loan exposure on their balance sheet also tend to lose out if there aren't any hedges in place.
The Indian Equity markets are excessively susceptible to Foreign Institutional money. A report by the NSE for the quarter ended March 2020 pegs Foreign Institutional holding in the NSE-listed universe at around 20.8%. The number has only gone up since then owing to the fresh influx of foreign funds after the pandemic struck.
Foreign Investors are spooked by the prospect of exchange rate losses as it eats into their real returns. Capital outflows accelerate rapidly when the domestic currency drops and this is precisely why we refer to foreign flows as "hot money".
Factor 7 - Fiscal Policy
In Unit 5 of this module, we have learned how the macroeconomic factor, monetary policy affects the stock market. Now, let us discuss how fiscal policy, another crucial macroeconomic factor affects stock market.
The Fiscal Policy consists of the tools used by the government such as Capital Expenditure, Spending, Transfer Payments & Taxes to influence economic growth in a country.
This relationship is the most straightforward and there isn't much to deliberate on this topic. If the government follows an expansionary fiscal policy viz increases spending on Social Infrastructure such as healthcare, education, public facilities, transportation, etc, reduces personal/corporate tax rates, raises unemployment benefits, etc. with a motive to increase the money supply in the economy.
It is self-explanatory by now that equity markets tend to thrive on loose money supply coupled with expansionary fiscal policies. The Covid Crisis evoked a similar response as Central Banks all over the globe injected trillions of dollars into the financial ecosystem by cutting interest rates to near-zero & Governments loosened their purse strings in the name of stimulus measures.
The extent of market merriment on receiving such news can be adjudged from the Mrs. Nirmala Sitharaman Candle on the Nifty Index dated 21st September 2019. Mainstream indices- Nifty 50 & Bank Nifty rallied almost 6% and 10% respectively in a single day. And the reason? - Corporate Tax Cuts.
Factor 8- Bond Yields
The next macroeconomic factor affecting stock market are ‘Bond Yields.’
Bonds are investment securities issued by corporations and governments for the purposes of raising money. Bonds can be of many types such as zero-coupon bonds, perpetual bonds, floating-rate bonds, fixed-rate bonds, subordinated bonds, bearer bonds, etc.
The Coupon Rate on the bond is the annual interest payment made by the issuer on the Face Value of the investment. This number is usually used as a reference for the risk-free rate of interest in the economy. The Yield on the bond is the internal rate of return (IRR) when an investor holds the bond till maturity.
Now, Let Us See a Few Differences Between Yield & Coupon:
- The Yield is the rate of return that a bond generates, whereas a coupon is the rate of interest that a bond pays annually.
- Yield = annual coupon payment/ market value of a bond & Coupon rate = coupon payment/Face Value of the bond
- The Yield defines how much an investor will be paid in the future & a coupon tells us what the bond paid when it was issued.
- Yield changes with the change in the bond's market price, whereas coupon rates remain fixed for the entire duration of a bond.
There exists an inverse relationship between bond yields and bond prices. When the price of a bond increases, its yields fall and vice-versa.
You can deep dive into other crucial aspects of the bond market in our Debt Markets Module on ELM School.
Bond Markets have a huge spill over effect on the Equity Markets. This is because bonds compete with stocks for the same money. If an investor observes that he can get a decent return just by investing at the risk-free rate of interest, he would move some of his money out of stocks and use them to purchase bonds.
For instance, if government bonds yield 6%, equity market returns need to be way above 6% to compensate for the additional risk- an equity risk premium of say 4%. This means that the investor must only risk his moolah in equities if he expects returns to be north of 10%.
Simply put, as bond yields go up the opportunity cost of investing in equities goes up & makes it a less attractive option.
Hardening of yields might also point to an increase in the consensus estimate for expected inflation as investors demand additional returns for the loss in the real value terms. Surging bond yields have the potential to threaten a nascent economic revival as the Central Bank may be forced to announce rate hikes to keep a lid on inflation. Such a step would predominantly signify that it is time to bid goodbye to cheap money. Quite naturally, higher Interest Rates would deter governments and corporations from borrowing more in the future. An already existing floating-rate borrowing would only add to the trouble.
Bond Yields in developed markets like The USA, United Kingdom, Germany, Switzerland tremendously affects the fortunes of equities in emerging markets. An increase in the bond yields back home sends shivers down the spine of Foreign Investors as they face the double whammy of a stronger Greenback (fall in real returns as the local currency has depreciated) & higher borrowing costs in their home country.
Some historical periods might point to the conclusion that the correlation between the returns on stocks & bonds is positive, others that it is negative. We believe that these variations can be a signal of fundamental change in the broader market environment. However, it has been observed in the past few years, that the correlation between the two i.e., stocks and bond returns move in opposite directions.
Although trading of debt instruments has not picked up pace in India yet, Boutique investment banks have a separate fixed-income division hosting scores of traders who trade anything & everything from government bonds, corporate bonds, gilts, credit derivatives, mortgage-backed securities, money-market instruments, etc. The scale of operations is massive and so are the opportunities.
Conclusion
Finally, we have summarized the key takeaways from our module Macroeconomic Factors Affecting Stock Market:
- High crude oil prices: When there is a rise in the global crude oil price, it is a negative point for India, as our country is a net importer of crude oil. It puts inflationary pressure on the economy & worsens the fiscal balance. Both central & state governments might be forced to reduce the tax to relieve consumers. But a lower crude oil price is favorable overall.
- Technological changes: The effect is quite neutral, but it depends on how the companies adapt to the changing landscape.
- Gross Domestic Product (GDP): When there is a rise in Real GDP, it means outputs are expanding, which is positive for stocks as earnings increase.
- Expansionary Monetary Policy: There is a positive effect on the stock market as companies borrow more to invest in business at low-interest rates. Also, some of the increased money supply might find a way to equity markets as fixed income instruments go out of flavour.
- Contractionary Monetary Policy: It has a negative impact as higher interest rates increase the hurdle rate for investments. Also, borrowing cost increases for companies, and people may shift to the debt market.
- Inflation: Equity as an excellent hedge against inflation. A moderate amount is positive, but anything in excess would signal brewing trouble in the economy.
- Exchange rate movements: A depreciating local currency is positive for export-oriented sectors & negative for importers. Foreign investors favor countries with strong governments & stable currencies. A fall in the value of domestic currency lowers the real rate of return for offshore investors.
- Expansionary Fiscal policy: It is positive as the money supply increases, corporations benefit from tax cuts & transfer payments stimulate demand.
- Contractionary Fiscal policy: It is negative as decreased money supply affects overall demand. Corporations, as well as individuals, defer purchases due to lower disposable income (higher taxes), which has a ripple effect on the economy.
- Bond Yields: Soaring bond yields in the developed markets might lead to a gush of capital outflows from emerging markets ( better opportunities in the home country coupled with an increased cost of borrowing). Domestically too, an investor may prefer bonds over equities given the return on these investments- negative.
Company fundamentals may appear attractive but external variables can dramatically alter the investment landscape. It is better to understand these macroeconomic factors to make informed stock market decisions. Staying alert to policy changes, global shifts, and economic cycles helps anticipate risks, optimize entry and exit strategies, and ultimately make more resilient and profitable investment choices in the stock market.


