Think and Trade Like a Champion
Introduction
About the book
The book 'Think and Trade like a Champion' by Mark Minervini (author) has brought a huge amount of value to the trading world.
It is full of chart illustrations and historical trades of the market's leading stocks. It also explains the different stages that stock goes through and the cycle of accumulation and distribution through different price bases.
About the author
Mark Minervini is considered one of America's most successful stock traders and a veteran of Wall Street. He is the author of some of the best-selling books on trading and stock market like 'Trade Like a Stock Market Wizard' and 'Think and Trade Like a Champion.' Mark also educates numerous traders worldwide about his SEPA® methodology through 'Minervini Private Access’, an online platform that allows users the unique experience of gaining real-time access to his buy & sell recommendations, market commentary and in-depth research and analysis.
Buy the book
The most important lesson you will learn from this book is establishing the correct risk-reward ratio while entering a trade. We highly recommend you to read the entire book. (affiliate link)
Always Go In With A Plan
Once an individual adopts the right mindset and is willing to sacrifice his time and effort into the trading business, he needs to create a plan. There are very few successful businesses that do not follow some kind of strategy. The author says that trading is a serious business that involves real money. There is no reason for a person to get into it without a well-thought-out plan of action.
Firstly, define the objective followed by a road map of how to achieve it. The plan or strategy will be constantly evolving depending upon the feedback one gets from the data recording and analysis.
However, the rules should be objective and fixed from the research and prior backtesting and tell what information tells otherwise.
- Position size must be determined.
- Evaluation of capital allocation must be done. How long to invest and over what period?
- Some form of trade risk management needs to be defined.
- If the position moves against the view, where will the stop loss be placed?
- Will it be a trailing stop loss? Have the fundamentals changed?
- Not forgetting how to sell to lock in profits? Will it be a fixed percentage? Will it be a certain chart pattern?
All these factors must be taken into consideration before placing a trade. Once the trade is complete, it needs to be recorded for the continual analysis and continual optimisation of the strategy. Once this process is mastered one can reach their objectives and become king of the trading business.
Throughout the entire process, Mark underlines the importance of capital saving. One must limit his losses on each position which will ultimately protect the trading account. If a person takes too much risk in any individual position, he will risk losing the game and ultimately, his capital. Having a plan will help protect the capital base, encourage discipline, and provide a foundation for continual analysis. According to Mark, he defines his parameters ahead of time just to establish a basis for knowing whether his plans are working or not.
Approach Every Trade Risk-First
Beginning with the first two rules: always go in with a plan and approach every trade risk-first. The two most important words in trading are respect risk. Risk cannot be completely averted, but it can be minimized. If a trader wants to mitigate risk effectively, he must realize that stocks don’t regulate themselves. He is the regulator and has to protect his hard-earned capital. Laziness, lack of discipline will lead to poor performance.
With every trade Mark executes, his approach is always “risk-first.” By following this approach, he can easily evaluate what he stands to lose if he is wrong, which is much more important than what he stands to gain if he is right. This is because the game is over if he loses all his chips.
When a trade doesn’t work out as expected, he is sure of the exact price where he wants to exit. He predefined this exit level. Instead of focussing on the upside, he focuses on the downside. Whenever his stop loss is triggered, he gets out of the trade without any question.
Without discipline, rules are meaningless. One must learn to accept small losses thus protecting them from turning into large losses.
Many investors tend to use emotional stops that are incorrect and far beyond the mathematical stop. This results in a loss that is damaging enough financially and psychologically.
Beginners tend to fluctuate between being a trader and an investor according to their convenience.
When they are correct, they choose to be a trader and when they are wrong, they choose to be an investor.
Losses should be cut off immediately, without any hesitation.
Losses should be kept to 10% or less. This is because, with a 10% loss, it takes an 11% gain to get even.
Stock trading needs a good plan based on solid trading principles. Sacrificing very risky trades are part of that plan.
How to place the optimal Stop Loss?
To control his risk, Mark tries to enter a long trade as close to his stop loss as possible. This is known as trading near the “danger point”. Placing optimal stop loss is setting it at a level that will provide enough room for normal fluctuation, but is close enough to the danger point that’s not very risky mathematically.
In trading, there are only a few things over which one has control. There are three decisions one can make before placing the trade. They are: what to buy, when to buy and how much to buy. After placing the trade, the only thing that can be controlled is when to sell.
Deciding to cut loss in stock requires accepting the idea that the market is never wrong. It is only the trader who can be wrong. This is very difficult for traders to accept because of their egos.
A strategy is only as good as the eagerness to follow one’s own rules. A sound plan takes enactment, which takes discipline.
The market is a charging taskmaster. If a mistake is made, traders will get penalized financially and emotionally. However, there are ways of protecting with any strategy.
Never Risk More Than You Expect To Gain
To set an appropriate stop-loss, a person needs to know his average gain. For example, with an average of 5% gain, will anyone be willing to risk 10%? In that case, to break even, he will require to be correct on almost 70% of his trades. However, if he gains 10% to break even a risk of only 5%, he can avert trouble despite being correct in one out of three trades.
Mark strongly disagrees with the idea of setting a wide stop-loss just to provide room for volatile price action. Very often during a tough market environment, high volatility is experienced. During such times, the profits and ratio of profitable trades are smaller than usual. Hence the losses must also be cut short as compensation.
A common indicator used to set a stop-loss level is the Average True Range or ATR. It was introduced by Welles Wilder for commodities but is also used for stocks and indexes.
A high volatility stock will have a higher ATR or wider stop, and stock with low volatility will have a lower ATR or closer stop.
The stock market is all about speculation because there is no certainty in it. Thus, speculation is based on certain assumptions. When a trader buys a stock, he hopes that others will soon recognize the value in the stock and buys the shares, creating demand that moves the price higher.
Take an example of a 50/50 trader, if he cuts losses at 10%, with the assumption that his winners will rise 20% on average, but his upside turns out to be only 8%. In this situation, he surely loses money because he has a negative expectancy.
Expectancy is the percentage of winning trades multiplied by the average gain, divided by the percentage of losing trades multiplied by the average loss. To be a winner, one has to maintain a positive expectancy.
PWT (percentage of winning trades)*AG (average gain) / PLT (percentage of losing trades)*AL (average loss) = Expectancy
Defining the upside potential can be achieved in two ways. First, by using Theoretical Base Assumptions (TBA). Secondly, by Result Based Assumption (RBA). Using RBA to determine risk requires a lot of discipline.
It is not necessary to set a stop-loss at one price for the entire position. Staggered stops can also be used to mitigate losses. The key to using staggered stops is maintaining the line without getting knocked out of the entire position.
The author himself follows several guidelines to decide when to raise his stop above the original position. He never allows a stock that rises to a multiple of his stop-loss and is above his average gain, to go into the loss. When the price of a stock he owns rises by three times his risk and his gain is higher than his average, he always moves his stop up to the breakeven at least.
A trader’s actual results encircle not only his strategy, but also the faults, abnormalities, and emotions that frequently override a part of even the best laid-out plans.
Mark’s invariable goal is to minimize risk and maximize potential gains. He applies a trade management technique called the Add and Reduce.
Calculating risks smartly is the main element for constant superior performance. Experts play percentage ball which makes them more consistent than beginners in the long run.
When one relies on the probabilities to win, he is sure to succeed. The more times he turns over his edge, the more profit he will make, and the more possible, the proportions will distribute correctly over time.
Professionals understand that stock trading is not directed by absolutes, but on probabilities. They choose the course of action with the highest probable rate for success.
Investors tend to be emotionally attached to their stock holdings. When their stock takes a plunge, it knocks their ego, which in turn, leads to excuses and justifications for not selling. Most investors fail to sell and cut their loss short because they fear that the stock might go back up after they sell. It’s propelled by the fear of guilt, which results from pure ego! Ironically, the same fear controls them when they have a profit. They feel pressured to sell too quickly
Because they fear that the stock may go down and wipe out their gain. To be successful at trading, pretence must take a backseat and emotions must be removed. Fear, hope and pride have no place in a trading plan.
Know The Truth About Your Trading
The power of measurement is a priceless tool for those who are disciplined to use it routinely. When a trader keeps a track of the trading results, can gain insight into his trading that no system or indicator can ever tell. The results show the true picture of everything, from identifying trades to the consistency in executing them.
However, the sad truth is that very few traders know the truth about their trading. This is because people don't prefer to look at their bad trades. This is their biggest mistake.
How can traders avoid making this biggest mistake?
- The first step is post-analysis of your results.
- Every trader should collect their trading data and calculate their numbers. The data should be recorded according to the strategy. This will help in controlling the risk/reward ratio for each trade.
- They should be committed to updating the record regularly without fail.
Winners don’t take things for granted. They realize that every experience whether good or bad is a lesson that should be studied and built upon. They understand the restriction of only committing things to memory. They are always prepared with a journal to reflect and compare expectations to reality. The journal acts as a detailed guide for dealing with the next trades.
Mark compares trading to photography. Photography exposure is determined by three variables, light sensitivity, shutter speed and the size of the camera aperture. This “triangle” of factors determines the exposure. Similarly reading too has a triangle of three legs. These legs are:
- Your standard win size: how much do you win across all your winning trades on a percentage basis?
- Your average loss size: how much do you lose across all your losing trades on a percentage basis?
- Your ratio of profits to losses: your percentage of winning trades.
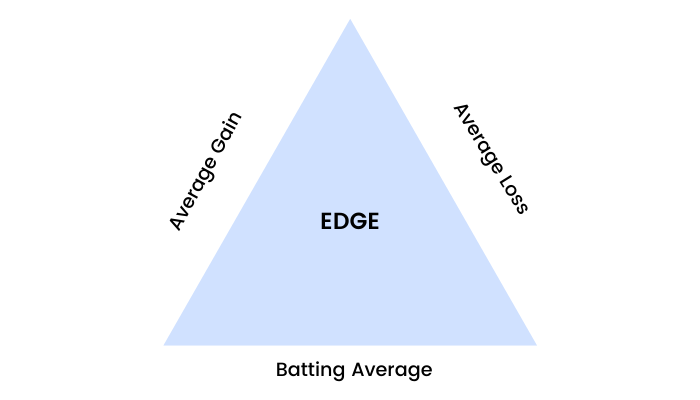
Image source: Think And Trade Like A Champion
Mark identifies the ‘stubborn trader’ indicators. They are the largest gain and loss in any one month and the number of days those gains and losses are held. For an average of a 6- to 12-month period, the net result should be positive.
For example, if the largest gainers are smaller than the largest losers on average, this means stubbornly carrying losses and only taking small profits, the exact opposite of what one should be doing. If the average hold time on the winners is less than the average hold time on the losers, it again indicates holding onto losses and selling winners too quickly. Tracking this data will give an honest picture of a person’s trading.
The power of “small” gains compounded overtime should not be underestimated. Elevated turnover of fairly small gains can mean considerably higher returns compared to lower turnover with higher profits.
The basic intent of any business endeavour is to have average gains larger than average losses.
The only solution to battle anxiety and control fears are rules and realistic objectives. With persistent rules, decisions will be grounded in reality and will not be emotionally based.
One must never let himself get absorbed with regret or bound with indecisiveness. Utilize the “sell-half” rule.
When a trader sells half and the stock goes higher, he will feel thankful that he has half the position left with him. However, if the stock goes lower, he again feels happy that at least he booked half the profit.
Psychologically, it’s a win/win situation in both ways.
One must be aware of the fact that selling half does not work on the downside when at a loss. When the stop is hit, the trade must be exited instead of selling half and gambling with the other half of the position. When a position moves against the view and hits the protective sell line, there is no room to fiddle but just act decisively and in a disciplined manner.
The author also emphasizes following healthy routines in trading. He calls them Lifestyle Habits. Once these habits are developed, they help in the progression and expansion of the comfort zone. One of the healthy habits of trading is regularly executing a post-analysis of results.
Another is cutting losses without failing to protect against capital destruction.
One of the biggest obstacles to success is making excuses. A trader should know the power of owning his results and should take full responsibility for the same. It is either possible to make money or excuses, but both can't be made together. One should work towards eradicating their excuses and start on the road to success by taking responsibility.
Compound Money, Not Mistakes
When a position results in a loss just after buying, most likely the trade was a mistake. It may mean missing an element in selection norms, or the timing could be wrong.
Many investors understand that they should cut losses to control risk. Yet they persuade themselves to wait. Trading is difficult enough without undermining one’s own rules.
Being disciplined means taking lots of small losses to keep safe. Mark admits that his performance went from average to outstanding when he made up his mind and decided to never have a “just this one-time” moment ever again. He decided not to break the rules because it doesn't pay.
Paul Tudor Jones has a message over his trading desk: “Losers average losers.” Those three words comprise impactful intelligence that only losers average down on losing positions. That message knocked the author for a set of reasons. First, if a wizard-like Paul Tudor Jones makes that statement, then it’s worth paying attention. Second, if one of the greatest traders was compelled to post such a sign, it is evident how alluring it is to “average down,” and how important it is to remind yourself not to do it.
A stealthy probability of the 50/80 rule is very important to compound money and not losses. Once a stock establishes a major top, there’s a 50% chance that it will fall by 80% and 80% chance that it will fall by 50%.
This is a warning about being aware of the first loss to hit the radar. Every major reduction starts as a minor retreat. If a person is disciplined to notice trading rules, he will limit his losses while they’re small.
Professionals are consistent and bet only when the odds are in their favour. They avoid risking money on low probability trades.
Buying a stock that is suddenly cheaper can be a trap instead of being a good bargain. When a trader buys a so-called cheap stock and it moves against him, it is difficult to sell because it becomes even cheaper. Then it becomes more attractive based on the cheap rationale.
When a leading stock tops, it may look inexpensive after a decline, but it’s expensive. This is because stocks discount the future. Usually, after the decline, the P/E ratio rises because of negative earnings comparisons or losses showing up on the balance sheet. However, it's too late by then. People are not willing to buy such stocks irrespective of how high quality they are, making them just worthless pieces of paper.
One must strictly stay away from stocks whose price action does not confirm the fundamentals.
A series of small successes bound together over time result in big success. Mark too initiates with a considerably small position. If it works, he adds more positions or more stocks. If he succeeds in a few trades, then he prefers to go aggressive and increases the overall exposure of his portfolio. This process keeps him out of trouble and helps to win big when right. Trading smaller while trading the worst is controlling risk.
The goal in trading should be to execute a strategy one can consistently rely on, realizing that the result of a single trade does not define success; rather, it’s the combined outcome of all the decisions and trades over time.
Mark shares his general trading rule. He never allows any stock to go into the loss column if it has risen to a multiple of his stop loss and is above his average gain. When the price of a stock he owns rises by three times his risk, he moves up his stop. If the stock rises to twice his average gain, he moves the stop to breakeven or equal to his average gain. This protects from losses and also safeguards confidence and profits.
To attain consistent profitability, one must protect his profits and his principal. There is no difference between the two. Once a trader makes profit, that money belongs to him. Yesterday’s earnings are part of today’s capital. Novice investors treat their income as the market’s money instead of theirs, and in scheduled time the market takes it back.
The marketplace is full of publicity and exaggeration. To trade successfully, one must know how to make his own decisions. A trader’s best and most robust protection is to have a strategy and rules that direct his actions.
If he wants invariant success, he must apply discipline unfailingly. He can’t have one without the other.
How And When To Buy Stocks- PART 1
The author’s approach is to trade with the trend.
- He only buys stocks that are in long-term uptrends.
- A stock that moves sideways in a strong uptrend could be good for buying.
- Contrarily, a stock that consolidates but is in a strong downtrend could be good for short. It’s all a matter of perspective.
Charts provide important indications. Price and volume inspections can help in determining whether a stock is under accumulation or distribution. It alerts of extreme danger and indicates when the chances of profits are fairly high.
One must be sure about what a stock should do instead of knowing what it is going to do. This is important because when the stock doesn't perform how it is supposed to, the decision to exit becomes easy and clear.
Like all other stocks, super performance stocks also go through four distinct stages. This cycle can take several years or even decades. One should focus on Stage 2. Mark avoids going long in any stage except Stage 2. The other three stages either result in losing time or losing money. The four stages are based on the stock’s price action.
Ready to master stock buying? Join our 'Stock Markets Made Easy' course and start investing confidently! Enroll now!
- Stage 1: Neglect phase: consolidation
- Stage 2: Advancing phase: accumulation
- Stage 3: Topping phase: distribution
- Stage 4: Declining phase: capitulation

A stock must confirm all the eight criteria to confirm that it is in a stage 2 uptrend.
- The stock price is above both the 150-day and the 200-day moving average.
- The 150-day moving average should be above the 200-day moving average.
- The 200-day moving average line is on an uptrend for at least 1-month. Better if it is for 4 to 5 months.
- The 50-day moving average should be above both the 150 and the 200-day moving averages.
- The existing stock price is at least 25% above its 52-week low.
- The current stock price is within at least 25% of its 52-week high (the closer to a new high the better).
- The relative strength ranking is not less than 70, but preferably in the 90s. The RS Line should also be in an uptrend for at least 6 weeks, preferably 13 weeks.
- The current price is trading above the 50-day moving average as the stock is coming out of a base.
As the stock shifts from Stage 1 to Stage 2, a meaningful pickup in volume can be seen as a sign of institutional support. Then the chart patterns should be evaluated. Here, the author looks for a volatility contraction pattern (VCP) to develop, which is the key to establish the exact entry point. VCP is the digestion period or the consolidation of previous gains made during the uptrend. In almost all the chart patterns, Mark looks for stocks that move from greater volatility on the left side of the price base to lesser volatility on the right side.
With every constriction in a VCP, the price of the stock becomes lighter and can move in one direction much more easily than when it was loaded with lots of supply.
A price consolidation illustrates a period of balance. As it goes through a consolidation period, each stock makes its unique mark. As a stock corrects and moves lower, certainly some buyers are trapped who bought higher and hope for a rally to sell. They hope to break even which results in an oversupply.
During the volatility contraction, increasingly less supply comes to the market because long-term buyers meet short-term sellers. This is the overhead supply that has been holding the stock back. It’s important to keep in mind that the VCP happens at higher levels after the stock has already moved up 30, 40, 50% or more.
A stock under accumulation will always exhibit VCP elements. This is exactly what is required to initiate a purchase on the right side of the base, which forms the pivot buy point.
A pivot point is the optimal buy point or the price level where it calls for action. A proper pivot point represents the fulfillment of a stock’s consolidation and the verge of its next advance.
When a stock’s pivot aligns with the line of slight resistance, it crosses the limit very rapidly and moves higher in a short time. With volume contraction, every correct pivot point evolves at a level below average.
How And When To Buy Stocks- PART 2
When a stock falls recklessly, it is probably the onset of a bear market. Just because a stock is trading down 50 to 60% below its high, doesn't make it a good bargain. First, such a reduction could imply a serious fundamental problem that may not be evident in reported fundamentals. Second, even if there is no problem with fundamentals, a stock that undergoes a deep sell-off must assert with a large number of sellers. The more a stock drops, the more it is loaded by this overhang.
It is very easy to correlate the relative strength (RS) of companies in the market, with a simple ranking of 1 to 99 (99 being the strongest and 1 the weakest). The key is to use a mix of the RS ranking, the RS line (which compares stocks to the general market), and the technical action of the stock. These indicators will help in determining the best time to go long. If a person focuses on the ranking only, he could end up buying a stock that has moved up too much and is susceptible to a large correction.
The best stocks make their lows before the general market does. During a correction, the leaders deviate and make higher lows. The stocks that sustain the best and trade to new highs from the general market low during the first four to eight weeks of a new bull market are the true market leaders. These stocks are competent in making impressive profits.
While making buying decisions, one must always buy in order of strength. The best choices in the lineup will be the first to intensify ahead and rise from a decent buy point. The strongest ones are the best choices.
Commonly, the initial stage of a move off has the traits of a lockout rally. During this lockout interval, investors wait for an opportunity to enter the market on a retreat that never arrives. Rather, strong demand makes the market move higher steadily, dismissing overbought readings. As a result, investors are nearly locked out of the market.
The author talks about a continuation pattern known as the cup completion cheat or 3-C. It’s called a cheat because it was considered to be an entry earlier than the optimal buy point, which implies cheating.
It is the firstest point at which buying should be attempted for any stock. Some stocks form a low cheat while some form it near the middle of the cup or saucer that comes before it. The clue is to comprehend when the stock has bottomed and observe when the start of a new uptrend is underway, in sync with the primary Stage 2 uptrend. The cheat trade gives a pivot point to act upon to time the stock’s upturn while boosting the chance of success.
A logical cheat area should display a reduction in volume and tightness in price. This halt illustrates an opportunity to enter the trade at the earliest point, although not always with the whole position. Nevertheless, the average cost basis can be lowered by capitalizing on cheat areas to scale into trades. Once the stock trades above the high of the pause, it is believed to have made a turn. This suggests the stock has possibly made its low and will continue the longer-term Stage 2 primary trend.
The cheat structure is the same as the traditional cup with a handle because it is merely the cup portion being attained. When a handle forms, it usually arises in the upper third of the cup. If it forms in the middle third or below the halfway point, it may give more than one buy point.
There are the four steps to a stock appearing through the cheat area.
- Downtrend- The stock will encounter a midterm price correction that takes place within the framework of a longer-term Stage 2 uptrend. This can happen over numerous weeks or months. It is natural to experience large price spikes during the downtrend on increased volume.
- Uptrend- The price will break its downtrend and attempt to rally. However, it is too early to buy because the price and volume lack the essential confirmation that the stock has bottomed and entered a new uptrend.
- Pause- The stock will pause over several days or weeks and form a plateau area (the cheat), which should be contained within 5 to 10% from high point to low point. The best situation is to have the cheat drift down to the point where the price drops below a previous low. At this point, as the stock moves above the high of the pause, it is ready to be purchased.
- Breakout- As the stock rallies above the high of the plateau area, the buy order should be placed.

Image Source: Think And Trade Like A Champion
The double bottom is a pattern that forms a “W” and cuts away, or in some cases tests, an earlier low within the base. Structures that run up straight from the lows without a cheat or handle are more susceptible to failure.
Power play, also known as the high tight flag, is one of the most important and profitable formats to learn. It is also one of the most misinterpreted technical patterns.
The following criteria must be met to qualify as a power play:
- A fierce price move with huge volume stimulates the stock price up 100% or more within eight weeks. Stocks that have already made an enormous increase coming off a late-stage base generally don’t qualify. The best power plays are stocks that were soft in Stage 1 and then unexpectedly explode.
- Following the volatile move, the stock price moves sideways in a fairly tight range, not rectifying more than 20% over three to six weeks (some can appear just after 10 or 12 days).
- From high to low, if the correction in the base does not exceed 10%, price tightening in the form of volatility contraction is not necessary because the price is already tight enough.
It takes time and discipline to understand how to recognize the best stocks and specify optimal buy points. Opportune purchases will put the trader on the road to super performance.
Position Sizing For Optimal Results
If a trader has a concentrated portfolio and things go his way, he can gain big in a shorter time. The first rule is not to put an entire account into just one stock because that would mean too much risk. On the other hand, in order to accomplish super performance, diversifying the portfolio too much is disadvantageous.
Diversification is a trick used to allocate investments among different securities to curb losses when the security declines to ensure overall smoothing of short term volatility. However, the goal should be optimal position sizing. The position size should be defined by how much equity one stands to lose if a trade goes against him.
Instead of unscientifically picking a number, the maximum risk should not be more than 1.25 to 2.5% of equity on a single trade. Either the stop must be moved or the position size. One or the other must be modified to sustain the correct amount of risk.
The key is to find a balance between a favourable position size and a stop that allows the stock’s price to deviate normally without clogging off the trade.
If a trader sticks to Mark’s position sizing guidelines below, he will never take on too much risk per position.
- 1.25–2.5% risk of total equity
- Maximum stop of 10%
- Average losses should not be more than 5–6%
- Never take a position larger than 50%
- Aim for optimal 20–25% positions in the best names
- Total of 10 to 12 stocks (16 to 20 for larger professional portfolios)
Depending on the portfolio size and risk, there should be 4 to 8 stocks in the portfolio. For larger portfolios, there must be 10 to 12 stocks. This will ensure adequate diversification.
If four out of six stocks are doing well and two are performing poorly, then it’s perhaps time to reallocate the capital. In such a situation, position size must be reduced in those two dull stocks instead of completely dumping them.
While selling a few stocks and reallocating the capital into others, a trader doesn't want to keep himself over diversified. According to the author, it is not diversification but “di-worsification.”
Large numbers of stocks are difficult to track and the position also becomes small for each stock. This weakens the possibility to get super performance out of a really big winner.
It’s better to learn how to concentrate the buys in the best names strictly at the right time and then safeguard yourself with the help of reasonable stop-loss order.
When To Sell And Nail Down Profits
One of the most uncertain moments in trading is when to sell. Selling too soon leads to the fear of losing out on future profits. Selling too late leads to regret. These two emotions of fear and regret lead to indecisiveness.
There are two basic strategies in which to sell. The first is to sell into strength when the stock is moving in the favourable direction and there are plenty of buyers. The second technique is selling into weakness. Initially, the stock made a good run but is weakening now. In this case, the profit needs to be protected as the stock reverses. This can happen suddenly requiring a very swift response.
Both plans begin with an “aerial view.” From an aerial view, one has to infer the context of the existing price action. Without this viewpoint, they run a high risk of getting trapped in fears and emotions.
A crucial factor that affects the decision to sell is where the stock is within its cycle. One way to evaluate whether the stock is in the early or late stages of its upward move is with the base count. This matters exceedingly because it will notify about the possibility of a continued move, or if one should look out for more distinctive sell signals.
A stock’s P/E also indicates where a stock is in its life cycle. Specifically, it tells whether the run-up is late-stage and further upward propulsion is likely to be depleted.
After a leading stock makes a healthy advance for many months, the price will go up at a faster pace and a steeper angle than at any time during the advance.
When this happens, the stock should be sold into the rally and book at least some of the profits.
If a stock experiences its largest daily or weekly price decline since the onset of a Stage 2 advance, it is giving an outright sell signal.
The objective of stock trading is to make a generous profit on investments. It is not to try to be right all the time. It is not always possible to get the highest price. However, it is also not necessary for achieving super performance.
Instead of bothering about selling at the high or buying at the low, one should be concerned about making an adequate profit and repeating it over and over.
Almost as the buying setup, the selling too requires rules. Having rules about selling results in making decisions based on strong rationale instead of giving in to the emotions of fear and regret.
Eight Keys To Unlocking The Super Performance
The author suggests 8 keys to unlock super performance with low risk.
Out of these, four keys address the upside, while the other four focus on limiting the downside and protecting a trader's capital and confidence.
The Four Keys To Generating Big Performance:
Key 1: TIMING
Money needs to be compounded promptly to generate big returns. The accuracy required to enter and exit the positions at the most favourable points means timing the buys and sells.
To time the market, a formalized strategy with rules needs to be employed that enhances the possibilities of capturing above-market gains. Charts are vital. Mark uses a chart blueprint known as the volatility contraction pattern (VCP).
Key 2: DON’T DIVERSIFY
If widely diversified, the returns will be diluted. To achieve consistently big returns, one needs to be centralized among the best names (maximum 4 times 12), depending on the risk tolerance.
With a concentrated portfolio, a close watch can be kept on every stock and quick decisions can be made on entry and exit. Speed is a big advantage. Another reason is diversification gives a false sense of security because one can easily forget about so many stocks. This thinking is exactly the opposite of the one required for super performance.
Key 3: TURNOVER IS NOT TABOO
Turnover can be good if one has an edge and a concentrated portfolio. However, money should always be moving towards reaping the best performance and moving out of apprehensive situations that pose risk to the capital.
Key 4: ALWAYS MAINTAIN THE RISK/REWARD RELATIONSHIP
Here, all the keys of super performance are compiled. By continuous balancing of the risk and reward, one can neutralize any downside by being highly concentrated among a few names in the portfolio. A short-term approach must be adopted to losses and a moderately longer-term approach to profits, which means, cutting losses and letting the winners run.
The Four Keys To Limiting Drawdowns
After addressing the upside, it’s time to evaluate the downside. Every trader wants to limit losses by setting a stop loss at a predetermined level. However, they must be set at a sensible level to control risk concerning reward. If that correct balance is not maintained, one might end up taking a big risk for a small payoff. However, the objective is just the opposite- taking small risks for big potential gains.
KEY 1: SELL INTO STRENGTH
It is always better to sell early when there are eager buyers than to sell late. However, beginners think that the rising stock will never go down again.
If one waits too long to sell, the uptrend will cease and the stock will come down crashing. In that case, the profit is greatly diluted just because of the fear of missing out on more upside. The equity value is at its highest point when sold into strength. To maintain a consistent equity curve, traders must learn to sell with decent gains.
Key 2: TRADE SMALL BEFORE YOU TRADE BIG
One can increase overall exposure when correct. During such effectiveness, they can trade more aggressively because they have built a cushion.
The key is to build on success. However when things don't go well—maybe with correct analysis but off timing- one can’t continue aggressively. Then they have to slow down or must take a break to evaluate the reason. This is the true meaning of letting the market guide, rather than following the feelings or opinions.
KEY 3: ALWAYS TRADE DIRECTIONALLY
One will seldom be correct if he goes against the trend.
If significantly tight stops are used, even a small reduction can stop out and generate a losing trade. These losses can accumulate, so the objective is to buy at the exact moment when the risk of loss is least.
KEY 4: PROTECT YOUR BREAKEVEN POINT ONCE YOU’VE ACHIEVED A DECENT PROFIT
When a trade is entered, a stop is set below the entry point at a predetermined loss. However as the trade becomes profitable, the stop loss should be moved up to the break even. It’s also important to hold off on raising the stop loss until the price moves up an adequate amount, otherwise there will not be enough room to allow normal fluctuation and the trade will be called off.
The Champion Trader Mindset
In this part of the book, Mark teams up with performance coach Jairek Robbins to deal with the emotional baits that keep traders from achieving super performance.
A mental mindset is a great addition that the author has incorporated. Psychology is an underestimated part of being a trader. Anyone can do this task and be a successful trader, but not many have the devotion or the belief to accomplish it.
One can extensively increase their chances by actually changing their way of thinking. Any unwillingness to do so may cause a hindrance in the stock market.
Minervini emphasizes that trading is completely a business and if it is not taken seriously, then the person will be squeezed. Many investors are sold the dream, but they don’t accept the risk that is put on the shelf. One can make huge amounts of money in this business, but only if he earns it.
Conclusion
In all honesty, this book is for every type of trader. Be it a stock trader, a forex trader, an investor, beginner, day trader, or professional trader.
This book has something for everyone to turn themselves into profitable traders or substantially improve their performance.
New traders can learn about the basics of successful trading. They will discover why they have to cut their losses short, the importance of having a trading plan, the reasons why they should not diversify, the risk-reward ratio and also the basics of becoming efficient.
Advanced traders of any asset class and time frame will reveal how they can greatly improve their performance by scrutinizing the math behind their results. They will learn how to position their stop losses better and sell into strengths and weaknesses so that it makes mathematical sense.
Given the dramatically positive impact this book can have on trading, the reward-to-risk ratio of reading this book is extraordinarily skewed to the upside!


