Trade like a stock market wizard
Introduction
About the book
'Trade Like A Stock Market Wizard' by Minervini (author) unveils his trademarked stock market method SEPA, which provides outsized returns in virtually every market by combining careful risk management, self-analysis, and perseverance.
The book teaches you:
- To find the best stocks before they make a big price move
- To avoid costly mistakes made by most investors
- To manage losses and protect profits
- To avoid high-risk situations
About the author
Mark Minervini is considered one of America's most successful stock traders and a veteran of Wall Street. He is the author of some of the best-selling books on trading and the stock market, like 'Trade Like a Stock Market Wizard' and 'Think and Trade Like a Champion.' Mark also educates numerous traders worldwide about his SEPA® methodology through 'Minervini Private Access', an online platform that allows users the unique experience of gaining real-time access to his buy & sell recommendations, market commentary, and in-depth research and analysis.
Buy the book
'Trade Like A Stock Market Wizard' simply teaches you risk management and how to make profitable trades in the stock market. We highly recommend you to read the entire book. (affiliate link)
An Introduction Worth Reading
'Trade Like A Stock Market Wizard' reveals the proven, time-tested trading system which the author Mark Minervini has used to achieve triple-digit returns. Mark Minervini shares his Specific Entry Point Analysis (SEPA) trading strategy in this book. It’s practically a trend-following/breakout strategy that screens for variables like relative strength, earnings and institutional interest. It counts on both technicals and fundamentals. It focuses on young small/mid-cap stocks.
Minervini’s method is not for those who are lazy. The investor will have to work out with his fundamental study and chart analysis.
This book will resonate for those who can buy stocks at 52-week highs, for those who are looking for the next super performer and for those who are ready to invest in the time to become a qualified analyst and trader. Even those who are disciplined enough to buy after an established trend.
Different market players have different investing styles, but without anomaly, winning stock traders share important attributes required for success.
Two things are required: a passion to succeed and a winning method.
Success needs an opportunity. The stock market provides tremendous opportunity daily. To spot them and take advantage of them, you must be disciplined to apply the proper investment strategies.
Commitment and a desire to succeed are required to achieve super performance in stocks. Don’t get convinced that you can’t do it. People think it’s impossible to achieve super performance because they have never achieved it themselves. You should ignore any demoralization that you confront.
Mark’s style is to be aggressive and at the same time be extremely risk-conscious. “Risk-first” approach works best for him.
By sticking to a disciplined strategy, he could accomplish the most important goal of protecting his trading account and keeping the profits made during the last bull markets.
When you make a firm commitment, you put yourself much ahead in the race for success. This is because most people have a natural tendency to overestimate their achievements in the short run and underestimate them over the long run.
Opportunities can spring up in the stock market on short notice. You must be prepared and ready to take advantage of them.
There is no alternative for real-life experience. The only way to acquire experience is by acting and producing results and then understanding those results, good and bad. Unfortunately, experience cannot be fed forcibly; it must be attained personally over time. However, as you go through hardships, your expertise cannot be taken away from you.
Passion cannot be learnt but comes from within you. It surpasses monetary reward. If you enjoy doing what you are great at, money will automatically come your way.
To realize profits from stocks, you must make three correct decisions: what to buy, when to buy, and when to sell. All your decisions may not be correct but they can be intelligent. Believing in yourself and willing to work towards it shall make everything possible.
What You Need To Know First
The reason for the lack of success is simply that most traders have not taken the time to understand what works in the stock market and what accounts for super-performance.
Among those who obtain the needed knowledge, many fail to develop the emotional discipline to implement a winning plan.
Achieving super performance in stocks does not depend on luck or circumstance. It is accomplished through proficiency, endurance, and talent, which is developed over time through commitment and hard work. If you have these qualities, the likelihood is that you will succeed.
There are technological developments along the way, and some techniques work better than others during certain periods. However, stocks still rise and fall for the same basic reasons as they did before: people drive stock prices and they are emotionally the same. Moreover, history repeats itself over and over.
The road to success in the stock market is not a structure or technique. It is within you and will be discovered only to the extent that you are able to control your emotions as you face challenges.
Learn to do your own research because it is far superior to outside research or tips. Do the work, take responsibility for your failures, and you will own your success.
To acquire handsome returns from the market, you have to separate trading from your ego. Making money is more important than being right.
Most investors practice incorrectly and refuse to objectively analyze their results to find out where their approach is going wrong. They forget the losses and keep doing what they’ve always done. Practicing correctly is what's important.
Paper trading is the wrong kind of practice. It does not prepare you for the real punch of the market. It also does not prepare you to handle financial and emotional pressure. Hence, it will be unlikely for you to make the same decisions as your practice sessions. It creates a false sense of security and hinders your learning process.
Novice traders should trade with real money as soon as possible. It is a good way to gain experience by trading with an amount that is small enough to lose but large enough to be painful.
Applying traditional wisdom generates conventional returns, not super performance.
As you examine and evaluate the market, be willing to do things that most people won’t do. Growth comes at the cost of comfort. Learn to experiment outside your comfort zone and always question conventional knowledge. If you wish to be extraordinary, you must be unconventional.
Define your trading, whether trading suits your personality or long term investment approach. If you fail to do so, you will experience inner conflict at key decision-making times.
The key is to focus on a particular method, which means sacrificing other techniques. Once you define your style and objectives, it becomes easier to stick to a plan and achieve success.
Celebrate, be happy and appreciate when you win. Don’t look back at failures with regret. The past cannot be altered, only learned from. Most importantly, never let bad days make you give up.
Specific Entry Point Analysis: The SEPA Strategy
Mark has used his three decades of experience and study in his book ‘Trade Like A Stock Market Wizard’, and refined and retooled that information into Specific Entry Point Analysis or SEPA. He studied what makes a stock price move up drastically to join the special circle of super performers. There are three empowering points that convinced him:
1. To buy a stock, there is a right time and a wrong time.
2. Stocks with super performance capability can be identified before they dramatically increase in price.
3. By correctly investing in these stocks, it is possible to turn a small capital into a fortune in a fairly short period.
Mark constructed a blueprint of the characteristics shared by super performance stocks and called it a Leadership Profile. It helped him to identify in detail the qualities and traits of the most successful stocks of the past to discern the cause of its outperformance in future. It focuses not just on the price magnitude but also on the time element.
While filtering the database, he compared each stock to how well it fit the optimal Leadership Profile and ranked it accordingly. This would result in a surprising increase in the possibility of finding the next super performer.
The purpose of SEPA is to take all the relevant data available and pinpoint the exact spot to enter a high-probability trade in terms of risk versus reward in ‘Trade Like A Stock Market Wizard’. It combines the corporate fundamentals along with the technical behaviour of a stock.
The primary characteristics are broken down into five major categories:
- Trend: Almost every super performance phase occurred while the stock was in a distinct price uptrend. In nearly every case, the trend was identifiable early in the super performance advance.
- Fundamentals: Most super performance stages are propelled by an improvement in earnings, revenue, and margins. This typically occurs before the onset of the super performance phase. In most cases, earnings and sales can be measured earlier.
- Catalyst: Every stock that makes a tremendous gain has a catalyst behind it. The catalyst may not always be noticeable casually, but a little work on the company’s story could lead you to a potential super performer stock.
- Entry Point: Most super performance stocks give one or multiple opportunities to detect a rapid rise at a low-risk entry point. Clocking the entry point is crucial. Incorrect timing can lead to big losses and vice versa.
- Exit Points: It is not necessary for all stocks with super performance characteristics to result in profits, even if the entry time is correct. Hence, defining stop-loss points is important to move out of a losing position. Contrarily, at some point, a stock must be sold to achieve a profit.
Mark developed SEPA to recognize an exact point to place a trade for the lowest risk and the highest reward. His goal is to buy a stock and male a profit instantly. To accomplish this, he considers all the appropriate fundamental, technical, and market factors and pinpoints the position at which there is a valid convergence.
He wants to see these factors merge like four cars coming at the same time at a four-way crossroad. The SEPA method accumulates supporting likelihoods to produce that alignment.
Normally, a super performance phase prevails when a stock is relatively new, for example, during the first 10 years after the IPO.
Most companies experience the high-growth phase when they’re relatively small. As they grow older and more refined, their growth starts to stall, along with the appreciation rate of their stock prices.
Often, small-cap companies are the super performers. However, it’s important to confirm that they’re already beneficial. Look out for stocks with a fairly small total market capitalization. Ceteris paribus, a small-cap company will have more potential to appreciate than a large-cap, based on the stock supply available. It will take lower demand to move the small-cap stock than a large-cap stock.
A simple conduction of quantitative analysis will serve better than a complicated one. You must not put too much into each screen. Otherwise, you may involuntarily eliminate good prospects that meet all your criteria except for one.
A better approach to be successful is to run separate screens with smaller lists of compatible criteria, the correct understanding, good work conduct and discipline. To succeed, you have to finalize an approach that suits you and must commit to refine and improve the understanding and execution of the same. It requires time and dedication, but the goal should be to become a specialist in your approach.
Value Comes At A Price
In the stock market, what seems cheap could literally be expensive and what looks expensive may turn out to be the next super performer. The simple fact is that value comes at a price.
The typical P/E ratio indicates historical results and does not take the future into account.
It's important to focus on companies that report strong earnings, which then generate upward revisions in earnings prediction.
It is hard to get away if you buy a cheap stock because it’s tough to sell if it moves against you because then it's even cheaper. Most investors look for discounts instead of looking for leaders.
If you are looking for leaders, then this Mentorship Program might help you.
The best growth stocks rarely trade at a low P/E ratio. In fact, in history, many winning stocks have traded at more than 30 or 40 times earnings before experiencing their biggest advance.
While dealing with a dynamic new leader or new industry, it is extremely difficult to predict the span of the growth phase and the level of slowdown that will occur over a particular time frame.
In June 1997, Mark bought Yahoo! shares when it was trading at 938 times earnings. Every investor disapproved of the unknown company. However, Yahoo! was driving a new technological revolution- the Internet. The potential of the then-new industry was widely misjudged. Yahoo! shares increased a remarkable 7,800% in just 29 months, and the P/E broadened to more than 1,700 times earnings.

Image Source: Trade Like A Stock Market Wizard
Stock prices are not moved by value but by people placing buy orders. As a thumb rule, Mark doesn't buy shares of a company with an extremely low P/E, particularly if the stock price is near its 52-week low. A stock with an exceedingly low P/E ratio can prove to be trouble. A stock trading at a multiple far below the existing industry multiple could indicate a fundamental issue. The potential of the company may be debatable, and it might even be headed towards bankruptcy.
Mark uses the P/E ratio as a sentiment measure that gives him an outlook about investor expectation. Generally, a high P/E means high expectations and a low P/E means lower expectations.
Trading With The Trend
Intuition and mechanical signals supported by scientific research are both important factors. Despite good fundamentals, a company must meet certain technical standards to qualify as a buy candidate as explained in the book ‘Trade Like A Stock Market Wizard’.
For example, never buy a stock that is trading below its decreasing 200-day moving average, not even if its revenue growth, EPS and return equity are attractive. This is because you should look for some interest in it from big institutional investors. You should not be the first one to buy, but to make sure that buying is already on.
Buying stocks in long-term downtrends will considerably lower your chances of winning. To increase the possibility, you should focus on stocks that are in a confirmed uptrend.
The perfect scenario is to buy stocks when they come out of the first stage and begin to move higher, which is the second stage. Then selling them as they reach the peak of the cycle, which is the inception of the third stage. The fourth stage is a full-fledged drop that you have to avoid or when you go short.
The four stages of a stock price action are:
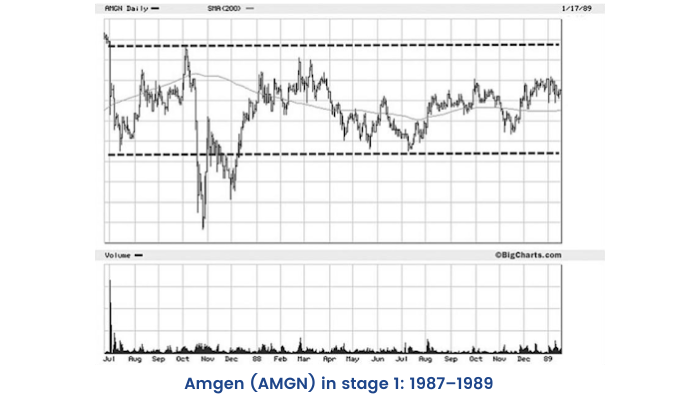
- Stage 1 - Neglect phase: consolidation
- Stage 2 - Advancing phase: accumulation
- Stage 3 - Topping phase: distribution
- Stage 4 - Declining phase: capitulation
Stage 1 - The Neglect Phase: Consolidation
Stage 1 is when nothing significant is happening and you should avoid buying here. This phase can persist from a few months to years.
Characteristics of Stage 1
- Stage 1 shows a sideways price movement with a lack of any sustained price movement.
- The stock price wavers around its 200-day or 40-week moving average. However, it lacks any kind of trend during such wavering. This stage can stay for months or even years.
- This stage often occurs after the stock has collapsed during stage 4 for several months or more.
- Volume is contracted and light compared with the volume of previous stage 4.
The goal is to buy at the correct price and not at the lowest or cheapest price. Trying to pick a bottom is a waste of time as it misses the whole point.
Transition from Stage 1 to Stage 2
A stage 2 advance may begin with little or no warning.
The transition criteria are:
1.The stock trades above both the 150 and the 200-day moving average.
2.The 150-day moving average is above the 200-day.
3.The 200-day moving average has turned up.
4.A sequel of higher highs and higher lows has emerged.
5.Large up weeks on volume spikes are contradicted by low-volume pullbacks.
6.There are more up weeks in terms of volume than down weeks.
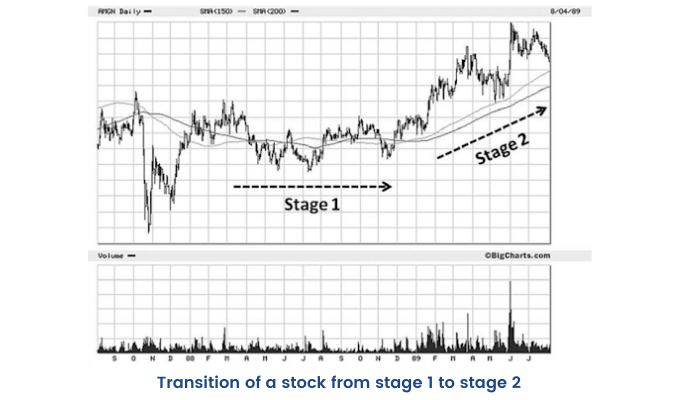
Stage 2 - The Advancing Phase: Accumulation
The advance of stage 2 gives a sign of clear sailing ahead. The stock price begins to escalate with a buildup in earnings momentum because of a rise in demand as big institutions buy the stock. The daily and weekly price chart will show big up bars depicting unusually large volume on rallies, differentiated with the lower volume on price pullbacks. These signs of accumulation should happen during every stage 2 advance.
Stage 2 Characteristics
- The stock trades above its 200-day moving average.
- The 200-day moving average is also in an uptrend.
- The 150-day moving average is over and above the 200-day moving average.
- The stock price is in an obvious uptrend, characterized by higher highs and higher lows.
- Short-term moving averages are above long-term moving averages.
- Volume spikes on big up days and big up weeks are countered by volume compressions during normal price pullbacks.
- On above-average volumes, there are more up days and up weeks than down days and weeks.
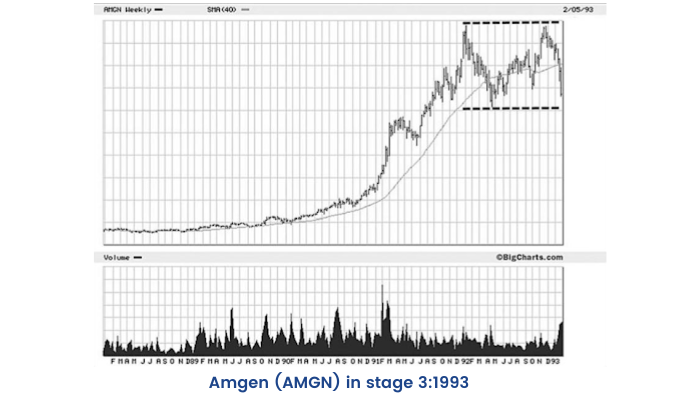
Stage 3 - The Topping Phase: Distribution
As all good things come to an end, so does the momentum of the stocks in the market. During stage 3, the stock is changing hands from strong buyers to weaker ones.
This distribution phase displays a topping pattern. The stock becomes more volatile compared to stage 2.
Stage 3 Characteristics
- The stock moves front and back in wider, looser swings and volatility increases. Although the comprehensive price pattern may look similar to stage 2, with the stock moving higher, the movement is much more unstable.
- Usually, there is a prominent price break in the stock on an increase in volume. Often, it is the largest one-day decrease since the inception of the stage 2 advance. These price breaks occur on overwhelming volume.
- The stock may trade under its 200-day moving average. Price volatility around this average is very common.
- The 200-day moving average will flatten and lose upside momentum and then turn into a downtrend.
Stage 4 - The Declining Phase: Capitulation
During stage 4, earnings measures are normally revised downward, which puts more selling pressure on the stock. As a stock deteriorates, it’s back to stage 1. Stage 4 is the opposite of stage 2 in terms of price and volume characteristics. You should certainly avoid buying a stock while it is in stage 4.
Stage 4 Characteristics
- The huge part of the price action is below the 200-day moving average.
- The 200-day moving average, which was flat or turning downward in stage 3, is now in an obvious downtrend.
- The stock price is near a 52-week low or hitting new lows.
- The stock price pattern is defined by lower lows and lower highs.
- Short-term moving averages are below long-term moving averages.
- Volume spikes on big down days and weeks are contradicted by low-volume rallies.

The four stages are greatly useful for attaining a view on where a stock is in its life cycle price-wise and then comparing that with where the company is in its earnings cycle. A stock can go through the cycle several times.
Mark applies the Trend Template criteria to every single stock he considers. The Trend Template is an eight criteria qualifier that a stock must meet to be considered in a confirmed stage 2 uptrend.
Trend Template:
1. The current stock price is above both the 150-day (30-week) and the 200-day (40-week) moving average price lines.
2. The 150-day moving average is above the 200-day moving average
3. The 200-day moving average line is trending up for at least 1 month (preferably 4-5 months minimum in most cases).
4. The 50-day (10-week) moving average is above both the 150-day and 200-day moving averages.
5. The current stock price is trading above the 50-day moving average.
6. The current stock price is at least 30 percent above its 52-week low. (Many of the best selections will be 100 percent, 300 percent, or greater above their 52-week low before they emerge from a solid consolidation period and mount a large scale advance.)
7. The current stock price is within at least 25 percent of its 52-week high (the closer to a new high the better).
8. The relative strength ranking (as reported in L'investment's Business Daily) is no less than 70, and preferably in the 80s or 90%, which will generally be the case with the better selections.
You should align yourself with this powerful force. Stick with stocks that are in a solid uptrend and it will be probable that you own a stock that has the potential to skyrocket and become a super performer.
Categories, Industry Groups And Catalysts
A good way to gain perspective and regulate your thoughts about a particular stock is to categorise companies. It will help you ascertain the type of company you’re considering so that you get an idea about where the stock is in its maturation cycle.
They normally tend to fall into one of the following six categories:
- Market leaders
- Top competitors
- Institutional favourites
- Turnaround situations
- Cyclical stocks
- Past leaders and laggards
Market leaders are the companies that can grow their earnings the fastest and are easy to spot. The share prices of market leaders up the most percentage-wise in the preliminary stages of a market rally. They are the first to move to the new highs. Most investors think that these stocks have moved too high because of this remarkable strength. Hence, they are apprehensive of buying it.
The charm about these ultrafast growers is that they grow so fast that even Exchanges can’t value them very accurately. This leads to pricing inefficiency, providing a big opportunity. The objective is to notice and invest in market leaders early in the growth phase when profits are stimulating.
A company with a strong brand and market position is known as a category killer. It is difficult to compete against such companies despite having unlimited capital.
The official growth stocks, also the institutional favourites normally have a good track record of uniform sales and dividend growth. They continuously attract prudent institutional capital because of their proven ability to boost earnings, expand margins and build shareholder value.
They are also referred to as blue chips.
Despite all good things, these companies have one problem that by the time they reach institutional favourite status, they become big and slow. Although their earnings are even and of high quality, the growth is sluggish. They are so widely observed that there’s little room for quick price appreciation.
A company that is sensitive to the economy or to commodity prices is known as cyclical stock. Cyclical stocks have an inverse P/E cycle. This means they usually have a high P/E ratio when they are poised to rally and a low P/E near the end of their cycle. The trick with cyclical stocks is to comprehend whether the turn of the next cycle will happen earlier or later than usual.
At the bottom of a cyclical swing, the subsequent things happen:
- Falling earnings.
- Dividends omitted.
- High P/E ratio.
- Generally bad news.
The exact opposite happens at the top of a cyclical swing.
A laggard stock belongs to the same group as the market leader but has poor price performance. They are relatively cheaper than market leaders and attract unskilled investors.
Your portfolio should comprise the best companies in the top four-five sectors. Look for new technologies that ensure to help people live longer, work better and enjoy life more. It may also help companies to cut costs and improve capacity and productivity.
Just as leading stocks sometimes indicate an influential advance, it could also warn when the group is steered for trouble.
If a key leader breaks down after an enormous advance, beware. This is often the preliminary symptom that the whole group is about to get sick.
Fundamentals To Focus On
In ‘Trade Like A Stock Market Wizard’ Minervini has explained that there's a reason why a stock undergoes a major price break, and very often it’s the onset of lower prices to come. In almost all cases, something is fundamentally wrong with the business or industry of the company.
It is unreasonable for an investor to settle for a poor track record irrespective of the size and reputation of a company.
When a company reports better quarterly results than expected, analysts must revisit and modify their earnings estimates upward. This boosts the attention paid to a stock.
Stocks move for two main reasons: expectation and surprise.
Try to look out for companies that are knocking earnings estimates. This is because earnings surprises have a persistent effect. One way to find such candidates is to check if reported earnings in the last few quarters were better than expected.
Mark doesn't disqualify a stock as a buy prospect if it lacks upward earnings revisions. However, a large downward estimate is clearly a red flag.
As a stock’s price rises quickly because of the possibilities of improving fundamentals, players start buying the stock simply based on a strong price trend and price velocity. Some of these people buy stocks with strong price action irrespective of the fundamentals. They believe that the stock will continue to rise over the short to intermediate-term because of momentum.
At a point, when the growth becomes obvious and everybody knows about it, the stock is termed a growth stock. The smart investors who got in early have generated big profits while the inexperienced ones now step in to buy after reading about it. However, the velocity slows down at this stage. This is followed by the loss of EPS momentum which results in negative earnings surprise and downward revisions. All this puts the stock price under tremendous pressure. This earnings maturation cycle happens repeatedly over time. You have to understand where in the cycle you are and take advantage of its effect.

Earnings Maturation Cycle
According to ‘Trade Like A Stock Market Wizard’, successful companies generally report earnings increases of 30-40% or more during their super performance stage.
It’s not unusual for new market leaders to show triple-digit sales growth in the most recent quarters or maybe even years.
In short, institutions like to see:
- Earnings surprises
- Speeding EPS and incomes
- Broadening margins
- EPS breakout
- Strong annual change in EPS
- Indications that momentum will continue
Assessing Earnings Quality
A company can yield revenue in various ways, some not so reliable. Earnings that are improved from cost reduction and plant closures walk on short legs. Such developments can show up from time to time, but sustainable earnings growth needs revenue growth as explained in ‘Trade Like A Stock Market Wizard’.
You should look for earnings that come from main operations, not from a one-time gain or an extraordinary circumstance.
Company Managements have become proficient at regulating expectations and fondling numbers to underpromise and over-deliver. This should raise a caution alarm because the report may not be as good as it appears to be.
Inventory write-downs and ongoing expenditures should also be looked out for. Few companies will store write-downs for future needs. They may choose to shift revenues or expenses into a different accounting period, which enables them to influence in which quarter they will realize expenses or recognize sales.
Earnings should come from strong core sales and not from accounting conspiracies.
The perfect situation is when a company has higher sales volume with new and current products as well as elevated prices and smaller costs. That’s a winning synthesis.
The worst circumstance is when a company has restricted pricing power, its business is capital-intensive, margins are poor, and it is facing intense competition or heavy regulation, or both.
To ascertain whether the market is looking favourably on a company’s earnings, Mark watches for three distinct reactions:
- Initial response- Whether the stock rallied or experienced a sell-off. If it was sold off, did it proceed with its slide or did it come roaring back?
- Subsequent resistance- How well did it hold its progress and resist profit-taking?
- Resilience- Whether the stock was restored promptly and powerfully or did it fail to rally after a pullback or a sell-off?
For a true super performer, there should not be a massive sell-off that halts the leg of the stock’s upward move.
For specific industries, such as manufacturing, the comparison of stock and sales is vital.
Consider inventory as a product waiting to be sold. Under most circumstances, inventories should rise and fall according to the sales.
When inventory grows much faster than sales, it can reflect reducing sales or misjudgment of future demand by the organization.
The receivables part of a company’s balance sheet deserves attention. Accounts receivable are what the company has to collect for sales it has already made. If receivables are increasing at a greater rate than sales, this could be an indication that the company is having difficulty receiving from its customers.
If receivables and inventories are both increasing at a greater rate than sales without explanation, this could be a twofold danger.
This kind of situation should put up a warning.
Follow The Leaders
Most of the huge profits made in bull markets come in the early stages of the first 12-18 months. Top-performing stocks lead the extensive market averages at significant turning points. These market leaders also foretell the downside turn.
More than 90% of super performance stocks originate from bear markets and common market corrections. The key lies in doing your homework while the market is down because it will help you to reap huge money when it turns up.
If the major market indices neglect an exceedingly overbought situation after a bear market decline and your list of leaders widens, this should be perceived as a sign of strength, as explained in ‘Trade Like A Stock Market Wizard’.
The stocks that sustain well and rally from the market low during the first 4 to 8 weeks of a new bull market are the true market leaders. They are capable of progressing reasonably.
It’s important to carefully review the price action of companies with recent optimistic developments and strong EPS during main market declines.
Each market cycle has a distinct form of price and volume action. A large number of stocks that exhibit positive price behaviour during a general market decline can hint at the point where the next market leaders will appear or what stocks are likely to take off first when the market begins to rally.
When you see this kind of price action, you should tune out the media and concentrate on the facts like price, volume, sales, earnings, profit margins, new products and positive industry transformations. Look for the confirmation in each stock and assign the best criteria.
Many times there will be more than one stock in an industry that displays this kind of behaviour. You should own the top one, two, or three names in that industry. Look for the kinds of patterns and price action that are multiplying in the market. This will help you understand what trick will work best in the existing cycle.
When a market bottoms, the best stocks make their lows before the market average low. As the broader market averages make lower lows, the leaders deviate and make higher lows.
Mark believes in buying strength and not weakness. True market leaders always show better relative strength especially during a market correction.
The leaders of the former bull market rarely lead the next rally, so expect to see new names. Less than 25% of leaders of a cycle commonly lead the next cycle.
With each bull market, old leaders step aside and new ones emerge. Be prepared to act quickly. Most importantly, stop paying attention to the media and start focusing on the leaders.
A picture Is Worth A Million Dollars
‘Trade Like A Stock Market Wizard’, this book has taught us that charts help us to see what’s going on in a particular stock. They filter the conflict for emotional, reasonable, and even manipulative decisions into a clear optical display or the judgment of demand and supply.
Mark himself never bets on the fundamental ideas alone without any confirmation from the charts. First, he uses charts to ascertain the current trend of a stock. In other words, technical analysis facilitates him to qualify candidates for his watch list. Then he uses charts to decide the entry time.
There are three schools of thought. The first group consists of technical analysts who rely only on the price and volume action. The second group is that of pure fundamentalists who believe that every know-how lies in a company’s fundamentals. The third group comprises techno-fundamentalists who exploit both technical and fundamental analysis. They bank on price and volume action along with the fundamentals. A healthy mixed approach exploits charts as well as fundamentals to boost the probability of success.
Chart patterns reflect the effect and not the cause. The demand and supply picture does not command the market but human behaviour does. Human behaviour is the same and is not prone to much change in the future. Hence, chart patterns continue to be powerful tools in clocking trade entries and exits. The key lies not in knowing exactly what a stock is going to do but in knowing what it should do. Then it’s a concern of defining whether the proverbial train is on schedule.
Knowing what to expect enables you to detect whether a stock is acting correctly or incorrectly in the current situations. When you know how something is ought to perform, but it doesn’t perform in that similar way, the exit decision is much easier.
The initial and most essential information that charts show is the prevailing stock trend. You should select only those stocks that exhibit proof of being favoured by institutional buying. Your goal is not to be the first one to buy but to look where momentum is picking up and the risk of failure is fairly low.
If you enter too early in a trade, you run the risk of the stock restarting its downtrend. However, if you are too late, you run the risk of buying a stock at the late stage which is known to everyone and susceptible to failure.
A widespread characteristic of almost all constructive price patterns is a contraction of volatility supported by certain areas in the base structure where volume contracts reasonably. To demonstrate this Mark uses the concept of volatility contraction pattern (VCP).
VCP is part of the demand and supply format. Its main function is to establish an exact entry point at the line of least resistance. The stock should move from the left side of the price base with greater volatility to the right side with lesser volatility.
The instant differentiating features of the VCP are the number of contractions that are formed (generally between two and four), their relative depths, and the level of trading volume associated.
As a stock corrects and heads downward, certainly some trapped buyers who bought around the stock’s previous high, are now sitting with a loss. With the passage of time and growing losses, many of these buyers would be pleased just to reach breakeven. This creates an overhead supply.
Unlike the trapped buyers, there are also buyers who were fortunate enough to bottom fish and accumulate huge profits. They also add to the supply issue. As the stock trades near its old high again, the profit-takers feel the urge to sell and book their profits. All this selling causes a price pullback on the right side of the base.
Just because a stock is trading down 50-60% off its high doesn't mean it is a good bargain. First, it may imply that the company or the industry is facing a serious fundamental problem. Second, even if there are no fundamental problems, it gets burdened by the trapped buyers. Finally, the more a stock decreases, the more profit takers will be waiting to sell if the stock rallies and intersects overhead supply.
You will be more successful if you focus on stocks that correct the least versus the ones that correct the most. Under most circumstances, if a stock corrects more than two to three times the decline of the general market, it should be avoided.
Just before a price correction or consolidation begins, a price spike occurs on the left side. This may become news and cause the stock to pull back, especially if the broad market begins to correct.
A proper pivot point indicates the fulfillment of a stock’s consolidation and the threshold of its next advance. A pivot point is a price level that calls for action and is often called the optimal buy point or the line of least resistance.
Once a stock breaks through this least resistance line, there are the greatest chances that it will move higher in a short period.
Once the stock breaks this pivot point successfully, the stock price should hold its 20-day moving average and should not close below it. The pattern should not get broader with more up and down movements.

The cup completion cheat, or 3C, is a continuation pattern and marks the earliest point at which you should try buying a stock.
The clue is to identify when the stock has bottomed out and has started a new uptrend, in correspondence with the primary stage 2.
The cheat setup usually develops during a general market correction.

Making the Turn
A. Downtrend- The stock price will undergo an intermediate-term correction that takes place within the context of a longer-term stage 2 uptrend. This can take over several weeks or months, and it is natural to encounter huge price spikes along with the downtrend on enhanced volume.
B. Uptrend- The price will strive to rally and halt its downtrend. At this point, the price and volume action does not confirm that the stock has bottomed and got into a new uptrend. The price will start moving up, regaining one-third or half of its previous decline. However, the overhead supply created during the downtrend will be strong enough to slow the price increase and create a halt or retreat.
C. Pause- The stock will pause for several days or weeks and form a plateau area, which should be encompassed within 5-10% from high point to low point. Here, the stock moves above the high of the pause and is ready to be bought. A typical indication for the breakout of the stock is when volume dries up drastically, escorted by price tightness.
D. Breakout- Place your buy order as the stock rallies above the high of the plateau area. The stock is now considered to have made the turn which means that it has made its low and the trend is now up and back in correspondence with the longer-term stage 2 primary trend.

The riskiest time is to trade when a stock is trying to bottom. While searching for the bottom, it can blow back and forth, making it a very volatile period. Trying to pick up a low can be extremely frustrating and expensive.
To be able to distinguish, one of the most significant setups you can learn is the power play, also known as a high tight flag. There are two reasons why Mark also calls this a velocity pattern. First, it requires enormous momentum to qualify. Second, this setup can move the quickest in the shortest period; momentum creates more momentum. This pattern is a sign of a dramatic shift in the company's prospects.
The following norms must be met to equip as a power play:
- A fierce price move initiates on huge volume that fires up the stock price by 100% or more in less than eight weeks. This commonly happens after a period of comparative inactivity.
- Then the stock price moves sideways in a fairly tight span, not correcting more than 20-25% over three to six weeks.
- The stock must exhibit VCP characteristics or the right price action should not correct the stock more than 10%.
The key to earning huge money in stocks is to coordinate supporting fundamentals with effective price action during a healthy market environment.
Don't Just Buy What You Know
As a disciplined trader, you should buy a stock only when you feel that adequate factors have come together into an optimal setup for a near eruption in share price. An essential factor in Mark’s entry setups is youth.
Every bull market is characterized by a few leadership stocks that were recent IPOs.
To attract Mark’s interest, a new issue must prove its strength in the market for at least a couple of months. Evidence comes in the form of a primary base which is the first buyable base after a company has gone public.
The primary base refers to the apparent future direction of a stock from its price and volume history. However, the primary base has deep roots in corporate fundamentals as well as the stock’s market action. The biggest portion of a company’s growth generally arises in the first 5 to 10 years after the company goes public.
This critical period is when management is at its entrepreneurial best. As sales expand and economies of scale improve, margins are stimulated and profit growth speeds up.
Before buying a recent new issue, a stock must have a primary base. Some IPOs take a year or more to form a reasonable base.
Every stock that makes a new high from a primary base does not turn out to be a big winner. Although a proper primary base has some of the best odds to join in during the majority of a big move, there is no guarantee of catching a stock as it begins a large-scale increase. Hence, you must always be ready with an exit plan to cut your losses if a primary base turns against you.
Beware of well-known companies that are considered as “official growth stocks”. At some point they are so over-owned that a material problem can create a huge amount of supply that can bring down the house. Rather, buy the new market leaders. Don't be worried about unfamiliar companies. You can work and get familiar with the stocks that are creating a primary base. This is where most of the upcoming big winners will be found.
Risk Management Part 1: The Nature Of Risk
Mark focuses on his trading plans and the two factors that are significant for winning over the long trail: stability and risk management. Risk management is the most important structure for achieving constant success in the stock market.
According to ‘Trade Like A Stock Market Wizard’, to achieve constant profit, you must preserve your profits and principal. There is no difference between the two because once you make a profit, that money belongs to you. The previous day's profit is a part of today's principal.
Once a stock reasonably moves from the purchase price, you should give it less space for the downside. You should get into a profit-protection mode to protect your breakeven point. Analyze your stocks based on the expected return versus the risk. Every day, a stock must rationalize your belief in holding it for a greater profit.
Adhering to sound risk-management principles will allow you to keep the acquired profits and will also keep you grounded when you become over ambitious after a successful period.
You should remind yourself that executing the basics properly is the key building block for success. Fundamental principles lay the solid foundation for greatness. Never authorize yourself to lose an amount that would endanger your account. A large loss is very difficult to recover.
The first discipline is to accept the market's judgement to stay clear of its wrath. It is very simple to comprehend but extremely difficult to perform regularly.
Irrespective of the method you use, there is just one way to protect the portfolio from a large loss. It is to sell a position with a small loss before it converts into a huge one. Resisting huge losses is the solitary important factor for winning big.
The stock price is not under your control, however, taking a small loss or a big one is purely your choice.
Investors rationalize because they hate to admit mistakes. They fluctuate from being traders when they’re right to becoming investors when they are wrong. Don’t become an involuntary investor.
In the stock market, you have a wonderful advantage of staying aside free of cost, observing and waiting for the most suitable moment to bet. Yet very few exploit this advantage.
Market has its own ways of creating pressure to make you feel foolish. Still you have to remain disciplined and cut your losses. For everlasting success in the stock market, you must understand that it’s more important to make money than to be right. Your ego should be left behind.
Losses are a part of trading and investing and if you are not capable of dealing with them, then eventually you will have to deal with huge losses.
Risk Management Part 2: How To Deal With And Control Risk?
As long as you are in the share market, risk looms. When you hold a stock, there is an invariable possibility of a price drop. The objective of stock trading is to make consistent money by carrying out trades with more reward than risk.
‘Trade Like A Stock Market Wizard’, this book has checked the facts that most investors tend to focus too much on the rewards side and not enough on the risk side.
If you regulate a portfolio with sentiments and not discipline, then be prepared for an explosive and depleting ride.
With thoughtful and regular work, you can acquire successful trading habits. Cultivating habits for producing positive results is always worth it. However, it requires immense discipline.
Your goal should be risk management not risk avoidance. Risk can be managed by significantly controlling the possibility and the amount of loss.
Before each trading day, you must mentally rehearse about handling each position based on what can unravel during that day. Thereafter, when the market opens you will know how to respond and there will be no surprises.
Contingency planning plays an important role because it helps you to make good decisions when you need them the most. You cannot control the magnitude of a stock price, however, you can monitor the amount you lose on each trade.
Always define your risk in advance. Not defining a predetermined level of risk may prove to be more fatal and costly than any other mistake.
Praying and hoping for a loss recovery cannot be a part of your psychology if you want to achieve super performance. Sticking to rules and discipline and maintaining a positive reward/risk ratio will result in money inflow.
If you get stopped out of your positions repeatedly, there can only be two wrong things:
1. The stock selection criteria are faulty.
2. The general market environment is adverse.
If you encounter an unusual losing streak, cut down your exposure first.
In a tough market environment, profits will be smaller than usual and losses will be larger. You will experience greater slippage because downside gaps will be more common. A wise way to handle this is to do the following:
- Tighten up stop losses. If you cut losses at 7-8%, start cutting them 5-6%.
- Settle for smaller profits. If you usually take profits of 15-20% on average, keep it at 10-12%.
- Reduce your exposure in terms of position size as well as overall capital commitment.
If you rely on diversification for protection, you will not achieve super performance. When you spread your money all over the place, you attain three things:
1.Inefficiency to follow each company closely.
2.Failure to reduce your portfolio exposure rapidly when required.
3.Average results because of the smoothing effect.
Conclusion
Smart people learn from their faults, but really smart people learn from other people’s faults. The author has followed this ideology in ‘Trade Like A Stock Market Wizard’ by carefully studying the great traders and imaginative thinkers. He has made his part of mistakes and has learnt tough lessons. In this book, he presents a realistic plan that is based on his experience. It’s now up to the traders to enforce it and stick to the discipline. Doing this will surely be worth it.


