Trading for a Living
Introduction
About the book
Many people aspire to be successful traders, but only a few succeed, and one of the main reasons is that traders generally fall into the trap of short-term excitement (gambling), i.e., making trades without giving a proper thought or doing proper due – diligence. They ignore the long-term benefits of trading with discipline.
Trading for a living is a book written by Dr Alexander Elder, which has now been translated into more than ten languages and is regarded as one of the most important books in the history of the stock market. The book explores three pillars of success:
- Psychology
- Trading Tactics
- Wealth Management
About the Author
Dr Alexander Elder is a professional trader and an expert in technical analysis. He also loves educating people about trading. He graduated from the University of Tartu, and his book Trading for a Living, which was first published in 1993, is considered one of the best books on individual psychology and trading. His previous experience as a psychiatrist gave him a unique insight into the world of trading.
Buy the book
The book teaches you to master a new way to trade stocks, futures, currencies, and options. We highly recommend you to read the entire book. (affiliate link)
Individual Psychology
(Chapter-1)
Traders can base their trades on fundamental or technical analysis, or by using insider information, but the main test of a successful trader starts once he enters a trade. Instead of going through an emotional rollercoaster and making irrational decisions, one of the most important aspects of being a successful trader is to manage emotions.
Trading is risky and attracts thrill, just like a sport as scuba diving does. These risky sports provide intense pleasure but are dangerous and much thought process isn’t involved to make a decision. Trading is similar in the way that when we purchase a risky stock, we get an entertainment value, but we are most likely going to lose our money too. We can succeed in trading only if we handle it seriously. Emotional trading is very lethal. Practicing defensive money management can help us in ensuring success. "A good trader watches his capital as a professional scuba diver watches his air supply.”
Why do most traders lose?
Professional traders lose their money primarily because of three main reasons:
A) Emotional trading,
B) Thoughtless Trading, and,
C) The markets are made in a way that most people will lose money most of the time.
Trading is a minus - sum game, i.e., losers lose more than winners win because there is a specific amount of commissions and slippage involved each time we enter and exit a trade, and that is why most people lose money in the markets.
Slippage is nothing but commissions, brokerage and other charges that are required to be paid when executing a trade. Slippage drains out money from the system which a new investor, who has just entered the market, cannot understand.
There are three kinds of Slippage:
- Common – This kind of slippage is due to the spread between buying and selling prices, i.e., the bid-ask spread. Let's try to understand this by an example. A broker may quote us a price of $350.45 for a stock. If we want to buy that stock, we will have to pay at least $350.50 or more, and if we want to sell that contract, we will receive $350.40 or less. This 10 point difference between the buying and selling price, is the bid-ask spread is the profit of the brokers for maintaining inventory, etc. These spreads are smaller in liquid markets and tend to get larger in the illiquid markets.
- Volatility Based – Slippage rises as markets get more volatile. When markets get high, slippage points get high, and vice – versa.
- Criminal - This kind of slippage is a way by which brokers can steal our money. Brokers might execute more trades, just to increase their commissions. Another way can be by putting bad trades into your account and keeping good trades for themselves.
To reduce slippage:
- Trade-in liquid markets,
- Avoid volatile markets,
- When the market is quiet, go for long or shorts.
- Use limit orders,
- Buy and sell at a specified price,
- We can keep a record of prices of the time when we place our orders, and fight the broker if we find any discrepancies.
Commissions can be anywhere from $12 to $100 every time we enter and exit a trade. To understand the magnitude of commissions, let us take an example: -
There is a contract worth $10,000 involving 5000 bushels of corn. The commission for this contract is $30, which according to a broker, is less than 1%. But in reality, we have to first deposit a $600 margin to enter this contract. This means we have to make 5% on the committed capital just to break even. Now suppose we trade this contract 4 times a year, to break even we have to make 20% in profits. 20% to not lose any money, very few people can achieve this, and this is why most of the people lose their money in the markets.
The logical thing to do here is to trade with those brokerage houses that charge the lowest commissions. If possible, bargain with the broker for lower commissions.
Trading cannot be achieved if one keeps fantasizing about supernormal profits. The reality of trading is that it takes time and patience to be a successful trader, and a person's distorted realities can hinder his success.
The goal of a good trader is not to make money, instead, the goal is to trade well. If the trade is a success, the money is a guarantee. Markets offer unlimited opportunities to trade well. As traders, our main goal should be to find good trades and execute those trades.
Fantasy Versus Reality
“A successful trader is a realist. He knows his abilities as well as his limitations." He knows how to react when a piece of information flows in the markets. A professional trader cannot afford illusions.
Our fantasies have the power to influence our behaviours, and the environment of our markets makes it easier to develop fantasies. They distort reality which can stand in the way of our success.
There is something called the "brain myth" which can help us in understanding our fantasies. For example, many traders feel like trading requires some specific knowledge, but in reality, trading is very simple. Because of this distorted reality, they make complex trading systems, taking parameters which are not needed and they ultimately lose money.
The Undercapitalization Myth
Another reason is that traders feel that they would be successful if they can trade in a bigger account. Most of the traders suffer losses because of a string of losses that were locked in a big account. Some traders borrow money from their relatives or friends, which is not a good idea because if an adverse event occurs, it can create an embarrassing situation.
So how much money should be required to begin trading?
The answer is simple, a small percentage of your equity should be adequate. Taking time to learn from the markets is a good idea, and, lastly, controlling our losses is something that we should learn.
The Autopilot Myth
Imagine a man comes up and tells you that there is an automatic driving system. You just need to install a chip and car runs automatically; you can also take a nap in the car. You would probably laugh at that man. But what be your reaction if the same told you there is an automatic trading system?
The author here is trying to explain that the creation of wealth cannot be automated, no matter how good a system is. Markets are always developing and changing. One needs to monitor the markets themselves and react accordingly.
Even if you have a good trading system, applying individual judgement is very important to succeed in the markets. Our trades must be based on some defined rules.
As we execute a trade, it is important to analyse our feelings and making sure that our decisions are intellectually sound. It is also important to structure our money management in such a way that no string of losses can kick us out of the markets.
Market Gurus
Gurus have been in the markets since the markets developed. The opinion of gurus nowadays spread quicker than early days. This is because of the development of technology.
There are three kinds of market gurus:
A) Market Cycle Gurus:
These types of gurus forecast every rise and fall in the markets. The logic here is that if he forecasts everything, there is a probability that some of the forecasts will turn out to be true, which will increase his fame. These kinds of gurus last for 2 – 3 years, and their success is generally dependent on short – term luck.
Once these gurus get exposed, their fame gets destroyed and new gurus emerge.
B) Magic Method Gurus:
A method guru emerges when they discover a new analytic or trading method. Traders always look for an edge over fellow traders, and when a new method is discovered everyone wants to jump on it. But when everyone discovers these methods, they become ineffective and these gurus also disappear with them.
C) Dead Gurus:
As time passes, a dead guru's books are reissued, his market tactics are scrutinised by new generations.
The gurus will keep on coming. As intelligent traders, we must realise in the long – run, no guru can make us rich. We have to work on it ourselves.
Trading is very difficult and a person needs to be very serious if they want to be successful in trading. But there exists various self – destructing things a person can do some of which are:
A) Gambling:
The key sign of a gambler is the inability to resist the urge to bet. If you're suffering losses and you feel that you're trading too much, then stop trading for a month, and re-evaluate your trading methods. If you cannot resist trading, then it’s time to develop your personality for your betterment.
B) Self Sabotage:
People keep blaming others and not themselves for their mistakes. They do not succeed in life generally.
The author says that our mind can be a major reason for our failures and that we should find our weaknesses to change ourselves. Keeping a diary can help, reasons for entering and exiting a trade should be written and later evaluated.
We need to be aware of our tendencies to sabotage ourselves. We should stop blaming our losses on bad luck and other things and take 100% responsibility for our results. Look for repetitive patterns of success and failures. Those who do not learn from the past are prone to repeating it in the future.
Trading lessons from Alcoholic Anonymous (AA):
When he was practicing psychology, Dr Alexander came across an alcoholic group, known as Alcoholics Anonymous, whose main aim is to keep their members sober, who were previously alcoholics, smokers, etc.
The following are the lessons that can be learned from AA:
1) Aim to be a trader for the long run (even after 20 years).
2) Learn as much as you can, read, write and always listen to experts, but keep applying your brain too.
3) Do not get greedy, and base your decisions on short term fluctuations.
4) Analyse every event in the market, I.e., if B went down, why did it go down?
5) Develop a money management plan.Our 1st goal should be long term survival, our 2nd goal should be a steady growth of capital, our 3rd goal should be high profit. Most traders put the 3rd goal as 1st and forget about the other 2.
6) Learn how to avoid losses.
7) Change is hard, but if we want to be successful in this profession, we have to work on changing our personality.
8) A trader needs to understand that the trouble is not with their methods, the problem is with their thinking.
Mass Psychology
(Chapter-2)
What is price?
A stock’s price is what a person is willing to pay. An adverse event might change an investor’s perception overnight which will cause the value of a share to go the other way rapidly.
A price is a Psychology event, a difference of opinion between bulls and bears. The patterns between prices, volume and open interest reflect the mass psychology of the market and the prices are based on them.
Each price represents a monetary consensus of value between sellers, buyers, and undecided traders when a transaction takes place. There is a crowd of traders behind every stock’s pattern.
Technical Analysts try to profit from these patterns.
What is the market?
The market is a huge crowd of people and every group of people try to outsmart each other by outguessing the other person’s behaviour. In India, we have two popular markets, namely the National Stock Exchange (NSE) and Bombay Stock Exchange (BSE).
All traders need to understand how a crowd can influence their behaviour. A successful trader must think independently, regardless of what the crowd thinks.
A crowd's actions are repetitive, their behaviour is simple. We should respect the power of a crowd, but not fear it.
Mr Elder touches the point of insider trading and says that trading on inside information is simply illegal. It is legal in the futures market. A technical analyst can detect whether insider trading is happening or not by looking into the charts.
There are two kinds of traders:
A) Individual Traders - The goal of an individual should be to trade well, not to trade often.
B) Institutional Traders - Institutions are responsible for a huge volume of trading. They pay low institutional commissions and can afford to hire the best researchers, brokers and traders.
Several advisors who send "newsletters" regularly are of good entertainment value because advisors try to pretend that they are an insider of the business, but in general, they don't know much.
An individual does not have the power to control the markets, all they can do is to decide on when to enter and exit a trade.
Group members, on the other hand, can catch a few trends here or there, but suffer huge losses when those trends reverse.
Joining a group is like following a parent. The parent might guide you, but unless you use your brain and make your own decisions, the guidelines will not yield any benefits.
To be a successful trader, it is necessary to become an independent thinker, as markets do not care about your well-being. It is very important to observe ourselves and notice the changes in our mental state as we trade. As stated, write the reasons for entering and exiting a trade.
Journal all your trade and trade ideas.
Do not change your plans when your trade is open and live.
Our human nature takes away our ability to make independent decisions when we are in stress. That's why we start intimating other's actions and overlook warning signals.
Only a few traders act as a purely rational human being. Majority of the traders are irrational when it comes to their behaviour.
Fundamental Analysts can lose their money if they are not synced with the medium and short-term trends.
Technical Analysis is a study of mass psychology. It’s a beautiful blend of science and art. It aims to recognize the trends and changes in crowd behaviour in order to make intelligent decisions.
Successful trading stands on 3 pillars:
- Analyse the balance between bulls and bears,
- Practice good money management, and,
- Personal discipline for trading plans.
Classical Chart Analysis
(Chapter-3)
There are various kinds of charts which can be analysed and studied in the field of Technical Analysis. The two most important types are Bar charts and Candlestick Charts.
Bar charts try to show the price movements of stock during that day in terms of "bars".
Theopening price of a bar or a candlestick chart reflects an “amateur’s opinion” The closing prices show the actions of the professional traders. After watching the prices for the day, they try to act. If prices closed higher than they opened, then market professionals were probably more bullish than amateurs. If prices closed lower than they opened, then market professionals were probably more bearish than amateurs.
Efficient Market Theory:
Efficient Market Theory is an academic notion. It says that anyone can outperform the markets. It says that the price in the market incorporates all available information at that given point of time. All factors which affect the demand and the supply and may affect the price are discounted by the price.
An analyst should try and depict the repetitive patterns of crowd behaviour and try to act on them.
Support and Resistance Levels
Support is a price level where buying is strong enough which can reverse its downtrend.
Resistance is a price level where selling is strong enough which can reverse or halt its uptrend.
The author says that support and resistance levels exist because people have memories.
Our memories prompt us to buy and sell at certain levels. Buying and selling by crowds of traders creates these support and resistance. If traders remember that prices have recently stopped falling and turned up from a certain level, they are likely to buy when prices approach that level again. If traders remember that an uptrend has recently reversed after rising to a certain peak, they tend to sell and go short when prices approach that level again.
The longer a support or resistance area - its length of time to form or the number of hits prices made at those levels - the stronger it is. Support and resistance, like good wine, becomes better with age.
As support and resistance levels grow old, they gradually become weaker.
High volume in a support or resistance area shows active involvement by traders. It is a sign of strong emotional commitment. Low volume shows that traders have little interest in transacting at that level. It is a sign of weak support or resistance.
The author mentions some crisp trading rules with respect to support and resistance.
1.When riding the broader trend, tighten your stop loss, if the prices approach important support or resistance.
2.Longer term supports and resistances on weekly charts are more important than short term supports and resistances.
3.Stop Loss orders should be mostly put on important support and resistance.
4.Never place stop loss orders on exact round numbers.
Trend And Trading Range
A trend exists when the price of a stock keeps rising or falling over time. In an uptrend, there are higher highs and higher lows. In a downtrend, there are lower lows and lower highs.
An uptrend emerges because bulls are stronger than bears with their buying forces.
A downtrend happens because bears are stronger than bulls with their selling forces.
The author suggests that we should buy in an uptrend and sell during a downtrend.
A trading range occurs when a security trades between a constant high and low for long periods of time. Finding a good entry point is extremely important in trading ranges.
Rules for executing a trade in a trending market and in a trading range are different.
When you’re buying in an uptrend and selling in a downtrend, give that trade the benefit of the doubt and do not be shaken easily. When trading in a trading range, close out your positions at the slightest sign of a reversal.
Future prices of a stock are uncertain, nobody surely knows whether it is going to be an uptrend or a downtrend, and because of this reason, some of our trading decisions are based on probabilities.
How to identify a trend?
- Analyse the patterns of highs and lows when looking at a chart. If rising prices keep reaching new higher level and a decline in price stops at a higher level than the previous decline, it signifies an uptrend. The pattern of lower lows and lower highs signify a downtrend, and the pattern of irregular highs and lows signify a trading range.
- To identify a trend, draw an uptrend line connecting the recent lows and a downtrend line connecting the recent highs. The slope of that trend line signifies a trend.
- Plot a 13 – day exponential moving average. The direction of its slope can identify a trend. If the moving average does not reach a new high or low in a month, then it signifies a trading range.
- Market indicators, such as Moving Average Convergence and Divergence (MACD) help in identifying a trend. The Directional System is a good indicator for catching early trends.
Trendlines
A trendline is a line which connects two nearby tops or bottoms, and is used to identify the current trends in a market. It is one of the oldest tools among traders.
The most important feature of a trendline is its angle because it identifies the force that is currently dominant in the market.
There are some important points one should remember regarding a trendline:
- Longer the time frame, the more important the trendline.
- The Longer a trendline is, the more is its validity.
- More the contacts between prices and trendline, the more valid the trendline is.
- The angle between the horizontal axis and the trendline reflects the emotional intensity of the dominant crowd.
If volume expands when prices move in the direction of a trendline, it confirms the trendline. If volume shrinks when prices pull back to a trendline, it also confirms the trendline. If volume expands when prices return to a trendline, it warns of a potential break; if volume shrinks when prices pull away from a trendline, it warns that the trendline is in danger.
The breaking of a trendline shows that a dominant crowd has lost its power.
Trading rules for trendlines:
- Trade in the direction of the slope of a trendline, i.e., buy when the slope is pointing up and vice-versa.
- A trendline provides a support or resistance level. When the prices rise, place buy orders at the uptrend line and protective orders below it. Reverse the procedure for a downtrend.
- If a trendline is steeper than 45 degrees, place a stop order right at the trendline and adjust it daily.
- Draw a channel line parallel to the trendline to use it as a target for profit-making.
- A price often retests the latest extreme after breaking a steep trendline. A pullback rally to an old high on falling volume and with indicator divergences provides a good opportunity to short sell.
Trendlines can also be applied to volumes and indicators. Rising volumes signifies that more people are getting involved in a market and vice – versa.
A trendline channel line marks the area of maximum power of bulls and max power of bears.
Gaps
A gap is a chart pattern that consists of two adjacent bars, where high of previous bar is lower than low of next bar, or low of previous bar is higher than high of next bar.
Gaps occur when prices rise or fall in response to a sudden imbalance of a buy or a sell order. Sudden breakouts of news can often trigger a gap.
There are various kinds of gaps:
- Common Gaps – Common gaps are gaps that close very quickly, usually within a few days and do not repeat regularly. These gaps are often seen in future contracts, thinly traded stocks, etc. Common gaps occur more commonly than other gaps. Common gaps do not provide good trading opportunities, so it is best to avoid them.
- Breakaway Gaps – Breakaway gaps occur when the current price of a stock leaps out of an existing trend and creates a new trend. These gaps can be open for weeks, months, and in some cases, even years. The longer is the range that precedes that gap, the longer is that trend. Breakaway gaps do not close frequently.
- Continuation Gaps – A continuation gap occurs in the middle of a powerful trend, and continues to reach new highs or lows without filling the gap. These gaps can help in estimating how far a trend is likely to carry. Trading strategy for a continuation gap is similar to a breakaway gap.
- Exhaustion Gaps – If a price is not reaching a new high or low for several days after a gap has occurred, it is an exhaustion gap. In an exhaustion gap a new price trend doesn’t occur because prices keep churning and close that gap.
Trading rules for Gaps:
- In a common gap, if the price goes up, sell short as soon as the market reaches a new high and place a protective stop, and vice-versa.
- In a breakaway gap, if prices have gapped to the upside, buy and place a protective stop at the lower rim of the gap. Reverse this procedure in downtrends.
- If a market refuses to reach new highs and lows in the direction of a gap, exit your trade and re – evaluate the market.
- When you identify an upside exhaustion gap, short sell and place a protective stop above the latest high. Reverse this procedure for a downtrend.
Chart Patterns
Chart patterns can help us decide which trends are likely to continue or vice-versa.
There are mainly two kinds of patterns:
- Continuation Patterns - These include flags and pennants.
- Reversal Pattern - These include head and shoulders, inverse head and shoulders and double tops and bottoms.
Head and Shoulder:
The “head” is a price peak surrounded by two lower peaks or “shoulders”. A neckline connects the lows of declines from the left shoulder and the head.
A head and shoulder pattern can provide an approximate target for a new downtrend. This pattern also gives an excellent sell signal.
The author mentions some trading rules for a head and shoulder pattern:
- Sell when you can identify a head or the right shoulder of a head and shoulder pattern, based on low volume, a break of an uptrend, and a divergence between indicator and prices.
- The decline from the head establishes a neckline. If you are holding a long position, place a stop order below the neckline.
- When you sell short into the right shoulder, place your stop at the top of the head.
- After a neckline has been broken, and if the volumes are low, it is a short signal with a protective stop slightly above the neckline.
Inverse Head and Shoulder:
Inverse Head and shoulder is the exact mirror image of a head and shoulder, i.e., it looks like a person standing upside down. The head at the lowest point, surrounded by two shoulders.
The rules for inverse head and shoulders pattern are similar to a head and shoulders pattern.
If you trade at the bottoms of this pattern, the trades are riskier because prices at the bottom are more volatile.
Rectangle:
A rectangle is a pattern that contains price movements of stocks between two parallel lines. The upper line of a rectangle identifies resistance, while the lower line of a rectangle identifies support. We can use Fibonacci Ratios and make a predictable price target.
Trading rules for a rectangle:
- If you buy at the lower boundary, place your protective stop slightly below the rectangle and if you short – sell at the upper boundary, place your protective stop slightly above the border.
- To find out whether an upside or a downside breakout is more likely, you should analyse the charts in a longer time frame than the one you’re trading in. For example, if you’re looking at a weekly chart, before making a decision look at the monthly chart. This can provide traders with a broader picture of the markets.
- Once you buy a breakout or sell short a downside breakout, place a protective stop slightly inside the rectangle.
Line and Flags:
A line is kind of a rectangle which is a correction of a primary trend. It is a congestion area whose height is approximately 3% of the current stock value.
A flag is a rectangle whose boundaries are parallel to each other and slant up or down. If a flag slants upward, a downward break is likely and vice-versa.
Triangle:
A triangle is a congestion area whose upper and lower boundaries converge on the right.
A small triangle whose height is 10 -15% of the preceding trend is likely to serve as a continuation pattern. Large triangles whose height equal a third or more of a preceding trend are likely to serve as reversal patterns.
Trading rules for Triangles:
1.If trading inside a triangle, oscillators such as stochastic help in catching minor swings.
2.Refer to the weekly chart when you’re deciding whether a triangle on a daily chart is likely to lead to an upside or downside.
3.When in an upside breakout, place a buy order slightly above the upper boundary of a triangle and vice-versa.
4.A pullback on heavy volume threatens to abort the breakout, but a pullback on light volume offers a good opportunity to buy.
Double Tops and Bottoms:
Double tops occur when the price of a stock rallies from the area of the previous high. Double bottoms occur when prices fall near the previous low. Buying at double bottoms and selling short at double tops offers some of the best trading opportunities to a trader.
Computerized Technical Analysis
To be a successful trader, you have to analyse and understand the markets better than your competitors do and a computer can help in doing so.
Computerised Technical Analysis is a more objective method of trading by which we can identify charts and patterns, and trade on the information provided by the computer. A computer can help us in a better in-depth analysis because it can process more information than us.
A trader without a computer is like a man travelling on a bicycle. His progress is very slow.
There are three steps to a computerised technical analysis:
A) Choose a software – There are three kinds of programs that a trader can choose from, toolboxes, which are for serious traders, black boxes, which are for people who believe in “Santa Claus”, grey boxes, for people who believe in both.
B) Choose a computer – The author suggests buying the best computer with the best features so that it provides the best platform to work on, and isn't required to be upgraded for some years.
C) Choose the data you want to analyse – Each trader needs to start with a historical database and update it daily. The author suggests that to track 6 or fewer markets in the beginning and keep adding as he gains experience in the markets.
For starters, the author suggested buying 3 to 5 years of historical weekly data and one year of daily data.
There are three major indicators which can help us identify trends and their turning points:
- Trend-following Indicators- It includes moving averages, MACD (moving average convergence-divergence), MACD-Histogram, the Directional System, On-Balance Volume, Accumulation/Distribution. Trend-following indicators are coincident or lagging indicators.
- Oscillators - Oscillators help identify turning points. Examples include Rate of Change, the Relative Strength Index, Elder-Ray, the Force Index, etc. They can be leading or coincident indicators.
- Miscellaneous Indicators - These indicators can be both leading or coincident. They provide insights into the intensity of bullish or bearish market opinion. Examples include Put – Call Ratio, Bullish Consensus, etc.
Moving Averages:
A moving average (MA) shows the average value of a data in a selected time window. For example, a 5-day moving average shows the average price of the past 5 days. The primary advantage of a moving average is that they are easy to calculate.
The value of a moving average depends on two factors:
- The values which are being averaged.
- The width of the MA time window.
The most important thing about a moving average is the direction of its slope. When the direction of the slope of a moving average rises, it shows that the crowd has become more optimistic, i.e., bullish and vice – versa.
There are three main types of moving averages:
1.Simple Moving Average (MA) - Simple MA’s move twice as much the piece of data they respond to. Simple averages reflect the changes in prices, the problem is that a simple average changes again when an old price is dropped off at the end of a MA window. The 2nd change has nothing to do with the market.
2.Exponential Moving Average (EMA) – EMAs are better tools for identifying trends than simple MAs. Its weight distributions are better and responses are faster than Simple MAs. The problem with EMA is that they respond to changes in latest data only. It does not respond to old sets of data.
A short EMA is more sensitive to changes in price changes and helps in catching trends sooner.
3.Weighted Moving Average – A weighted moving average assigns any weight to any day which is selected. Weighted averages are complicated, and the author suggested using EMAs only.
Trading rules for moving averages:
1.When an EMA rises, trade only longs. Buy when prices fall near or slightly below the moving averages.
2. When an EMA falls, only short trades. Sell when prices rise near or slightly or above an EMA.
3.When an EMA goes flat, do not trade in that market.
Moving averages can also be used as support or resistance levels.
Moving Average Convergence and Divergence (MACD):
A MACD indicator consists of three exponential moving averages.
A long moving average line shows long term consensus, a short moving average line shows short term consensus.
Trading rules for MACD:
1.When a fast MACD line crosses a slow signal line from below, it means that we should go long and place a protective stop below the latest low.
2.When a fast line crosses a slow line from above, we should go short and place a protective stop above the latest high.
MACD Histogram:
A MACD histogram shows the difference between the MACD line and the signal line. It is one of the best available tools to a trader.
Trading rules for MACD Histograms:
1.When a MACD – Histogram stops falling and ticks up, it gives a buy signal. Go long and place a protective stop below the latest low.
2.When a MACD – Histogram stops rising and ticks down, go short and place a protective stop above the latest high.
3.Short sell when a MACD – Histogram ticks down from its second, lower top, while the prices reach a new high. Also place a protective stop above the latest high.
4.Buy when a MACD – Histogram ticks up from its second bottom, while prices are at a new low. Place a protective stop below the latest low.
Differences between MACD Histogram and prices occur only a few times a year, but they give us some of the most powerful messages in Technical Analysis. They help in identifying major turning points and a divergence between the two indicates a major breakout might happen in the near future.
The Directional System:
The Directional System is a method which follows trends. The directional system measures the capacity of bulls and bears in moving a stock’s price out of a previous day’s range.
If today’s high is above yesterday’s high, it shows that the market is more bearish, and vice- versa.
Trading rules for The Directional System:
1.When the Average Directional Indicator (ADX) declines, it is better to not use a trend following method because it shows that the market has become less directional.
2.When ADX falls below both the directional lines, it identifies a flat and quiet market. Major bullish trends may emerge.
3.When ADX falls below both the directional lines and the longer that it stays there, the better can be your next move.
4.When ADX rises above both the directional lines, it signifies an overheated market.
Oscillators:
Oscillators provide us with the best trading signals when they diverge from the price of a stock.
Types of Oscillators:
1)Momentum Oscillator and Rate of Change (ROC) Oscillators - These oscillators measure a trend’s acceleration, its gain or loss of speed. They also compare today's closing price to the previously chosen closing price. When momentum or ROC rises to a new peak, it shows that optimism is growing in the market crowd and vice-versa.
When a momentum or Roc rises to a new peak, it shows that optimism is high in a market, and the prices are likely to rise and vice – versa.
Trading rules:
- In an uptrend, buy whenever Roc declines below its centerline and ticks up and vice – versa.
- If prices start to decline and you hold a long position, check whether a Roc has recorded a peak or not.
- A break in the trendline of momentum or Roc means that a break in the price trend of that stock is going to take place.
2)Williams % R – Williams% R measures the placement of each closing price in relation to the recent high-low range. This oscillator measures the capacity of bulls and bears to close prices each day. This oscillator is closely related to the Stochastic Oscillator. The highest range of price shows the maximum power of bulls, and vice-versa. W%R shows which groups are capable of closing the prices in their favour.
Trading rules:
- Divergences rarely occur, but provide the best trading opportunities. When you identify a bullish divergence, go long and place a protective stop below a recent low and vice –versa.
- Failure swings occur when the Wm%R fails to rise above its upper reference or stops falling in the middle of a decline and turns up without reaching its lower reference line. When W%R stops rising in the middle of a rally and goes down, it signifies a sell signal and vice- versa.
- W%R becomes oversold when prices close near the upper edge of their range. When Wm%R rises above its upper reference line, it signifies a sell signal and vice –versa.
3)Stochastic Oscillator - This is a widely used oscillator, and is used for tracking the relationship between each closing price to a recent high – low range. If bulls can push the prices near the high but the prices do not close near the high, it indicates a sell signal and vice-versa.
Trading rules:
- A bullish divergence occurs when prices reach a new low but the Stochastic oscillator shows a higher bottom than during the previous decline and vice-versa.
- When we can identify an uptrend in a weekly chart, we should wait for the daily Stochastic lines to decline below the reference line and place a buy order and vice –versa.
Don’t buy when stochastic is overbought and don’t sell when stochastic is oversold.
4)Relative Strength Index (RSI) - RSI measures the strength of a trading strategy by monitoring the changes in its closing prices. It is a leading indicator and is included in most software packages.
Trading rules:
- When prices fall to a new low but the RSI makes a shallower bottom during its previous decline, it shows bullish divergence and vice-versa.
- We can place a buy order above price trendline when RSI breaks its down trendline to catch an upside breakout.
- We can buy when RSI declines below its reference line and goes above it and reverse our decisions when the opposite occurs.
5)Smoothed Rate of Change Oscillator - This oscillator avoids a major flaw of Roc, it responds to each price data only once rather than twice. The quality of changes provided by this oscillator is better than Roc. S-Roc can track major upturns or downturns of a market crowd.
Trading rules:
- Buy when S-Roc turns up from below its centerline.
- If S-Roc reaches a lower peak than the previous one but the market reaches a new high, then this shows that the crowd is less enthusiastic than it previously was.
The Neglected Essentials
Volume:
Volume represents the activity of traders and investors. Each unit of volume represents an action of a trader selling a contract and another trader buying a contract. Changes in volume can show us how bulls and bears react to price swings, which can be used as clues for identifying trend reversals. Comparing the volume of 2 markets can show us which is more liquid than the other.
Trading rules on volume:
- When the volume reaches a new high, and prices reach a new high as well, the prices are likely to rise.
- If the volume reaches a new high and the markets reach a new low, it signals a selling opportunity.
- If volume shrinks and a trend continues, then we can expect a trend reversal.
- When volume dries up while prices are falling, it shows a reaction to a particular stock is nearing an end, it signals a good buying opportunity.
There are several volume-based indicators which a trader can use:
1) On - Balance Volume – This indicator is designed by Joseph Granville. OBV can be used as a leading indicator because it often falls and rises before prices do. A new high in OBV shows that bulls are powerful, and prices are likely to rise.
Trading signals for OBV:
- When OBV reaches a new high, it indicates that the markets are about to rise even higher, giving a buy signal.
- OBV can give its strongest trading signals when it shifts from prices.
- When prices are in a trading range, OBV breaks to a new high, it gives a buy signal, and vice – versa.
2) Accumulation/Distribution - This indicator tracks differences between the opening and closing prices, along with its volume. It was initially developed as a leading indicator but most traders apply it to futures. The greater the spread between opening and closing price relative to daily change, the greater the change in Accumulation/Distribution.
Trading rules:
1.When A/D reaches a lower peak, but prices rise to a new high, it gives a short sell signal.
2.When prices fell to a new low but A/D stopped at a higher low than during its previous decline. It signifies that a rally is coming.
3) Open Interest:
Open Interest is the outstanding number of contracts that have not yet expired/squared off by traders on a given day.

Most exchanges release open interest data one day later than their price information. If open interest does not drop during a rollover, it shows a strong commitment among traders for an existing trend, which is likely to continue.
A 10% change in open interest requires serious attention. The higher the open interest, the more active the market, and the less slippage we will risk while getting in and out of positions.
Trading rules for open interest (OI):
- When OI rises during a rally, it is a signal of an uptrend, which indicates a buy signal.
- When OI rises while prices fall, it means that bottom pickers are active in the market, it is a short sell signal.
- If OI rises while prices are relatively constant, it is a bullish sign, meaning hedgers are currently shorting the market and vice-versa.
- If OI is falling majorly, a short sell signal is generated.
- If markets are declining and the OI’s are falling, then we should cover our shorts and prepare to buy.
- If OI’s are constant but the markets are rising, it shows that the majority of the gains have already been made.
4) Herrick Payoff Index (HPI):
The HPI detects accumulation and distribution and tracks open interest as well as prices and volume. HPI confirms valid trends and helps to catch reversals.
The author then says that traders need to keep a measure of time when planning trades. A market analyst who is aware of time can see a dimension hidden from the mass universe.
Long term price cycles can help us in understanding an economy. The U.S stock market generally runs in 4-year market cycles because the U.S presidential election runs every 4 years, during which the markets get inflated.
Major cycles in agricultural commodities are due to the mass psychology of producers and production factors.
Generally, long term cycles are better than shorter-term cycles because they identify major tides. A good method for finding a market cycle, such as MESA or Fourier Analysis is extremely useful.
Trading rules for HPI:
- A bullish divergence is created when prices fall to a newer low and HPI hits a new lower bottom, this is a buy signal. When an HPI turns up from its second bottom, we should buy the stock and place a protective stop.
- A bearish market occurs when prices rally to a new high and HPI goes to a lower top. The signal to short sell is when HPI goes down from its second top. We can place a protective stop above the latest high price.
The author briefly touches on the point of time for a trader and says, “A market analyst who pays attention to time is aware of a dimension hidden from a market crowd”
Indicator Seasons:
The idea of seasons can be put to the financial markets. A trader can look to buy in spring and look to sell in the summer.
The author provides a course of action for seasons:
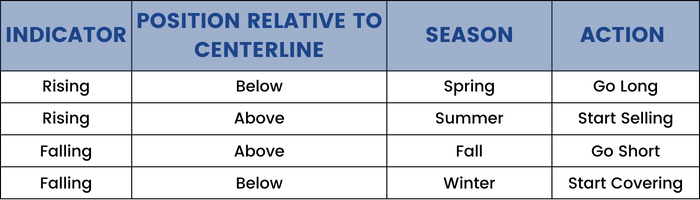
The concept of season indicators shifts the focus of a trader's attention on the passage of time in the market. It helps in planning a season instead of making sudden decisions with a crowd.
Stock Market Indicators
New High - New Low Index (NH-NL):
The NH-NL index tracks the number of market leaders, i.e., number of stocks that have reached new highs or lows on any given day for that year. The NH-NL measures the difference between new highs and new lows.
Trading rules for NH-NL:
1)If NH –NL reaches a lower peak, but the market reaches a newer high, it signifies a bearish divergence.
2)If NH –NL reaches a higher low, but the market reaches a newer low, it signifies a bullish divergence.
3)If NH –NL stays on a flat, it gives a sell signal.
4)If NH –NL rises on a flat day, it signals a bullish message and gives a buy signal.
5)If NH –NL has stayed negative for several months, but suddenly rises above its centerline, it shows that a bullish move is likely to begin.
Traders’ Index and Other Indicators:
Trader's Index or TRIN is a leading indicator. It can show the major rallies and declines that are about to reverse. Tops and bottoms in TRIN are associated with excessive optimism and pessimism.
Over the years, TRIN has been able to maintain itself as one of the best market indicators. It measures the ratio of advancing and declining stocks and compares it to advancing to declining volume.
Trading rules for TRIN:
1)When TRIN leaves its oversold zone, buy the stock and vice-versa.
2)When TRIN leaves its overbought zone, sell the stock and vice – versa.
3)The author states that TRIN works best when it is combined with the NH-NL. If TRIN reaches its oversold zone and NH-NL reaches a low, it signals that the downtrend is likely to continue and vice-versa.
4)If TRIN reaches its overbought zone but NH – NL reaches a new high, it signals that an uptrend is likely to continue.
5)When TRIN touches a lower peak than its previous high but the stock market reaches a new high, it is a sell signal.
6)When the stock market falls to a new low but TRIN falls less than it did in its previous decline, it is a buy signal.
Advance/Decline:
The A/D line can measure mass participation in upturns and downturns. A trend is likely to stay when the A/D line rises to a new high or low.
Traders should look for new highs and lows in the A/D line to predict price movements. To calculate the A/D for a day, we need to subtract the number of declining stocks with the number of advancing stocks.
Most Active Stocks (MAS):
The MAS indicator measures the advances and declines of 15 most actively traded stocks on NYSE.
MAS can show whether a market is currently bearish or bullish.
When the market is going one way and MAS goes the other way, then the market is betting on a reversal and vice-versa.
Psychological Indicators
A trend continues to be in trend when two groups of people have a conflicting opinion on a stock.
There are several newsletters which rate a stock but are no better than the average traders because they become bullish on major tops and bearish on major bottoms.
To understand a group of persons, we should first understand what they want. In general, financial journalists want to appear serious, informative and intelligent. The author says that internal contradiction is the main reason why financial journalism has not succeeded. They always want to present a “balanced picture” which is not ideal for an investor who wants to make an investment decision based on that report.
Financial journalists can be misleading and don't provide an advantage to a particular investor. For example, when a journalist reports a new trend, that report is read by a lot of people, major buying and selling happen and that trend disappears.
Commitment Indicators:
Traders have to report their trades in certain levels to a respective trading commission of that particular country. These levels are called reporting levels. For example, CFTC or Commodity Futures Trading Commission set up the maximum number of contracts a trader can execute, which is also known position limits.
The CFTC has divided all market participants into three groups:
- Commercials - Also known as Hedgers, these are firms or individuals who deal in actual commodities and trade futures to hedge their business risks.
- Large Speculators – Large speculators are those traders whose positions reach the reporting levels.
- Small Traders – To calculate the position of small traders, we need to subtract the holdings of commercials and large speculators with open interest.
Commercials have the best track record in the futures market as a group, simply because they have insider information.
An approach has been mentioned by the author known as the COT or Commitment of Traders Index. This index can be used to analyse the commitment of traders. When the COT index rises above 90%, it shows that commercials are uncommonly bullish and signifies a buy signal.
Odd – Lot Activity:
Odd lotters are people who trade less than 100 shares of a stock at a time. They are also known as value investors and represent a small percentage of the whole volume traded in the markets. The Odd – Lot Sales Ratio or the Odd – Lot Short Ratio were indicators which were used to show the behaviour of odd lotters but have lost their value after the financial markets changed during the 1970s.
New Indicators
Elder- Ray:
This is a new technical indicator, which helps in identifying the power of bulls and bears in a market. The Elder – Ray combines several things, such as:
- Price – Each price is a momentary consensus of value.
- Moving average – Moving averages show the average consensus of value.
- The lows and highs of each end bar – The high shows the maximum power of bulls during that bar and the lows show the maximum power of bears during that bar.
We shouldn’t buy when bear power is positive, and the best time to buy is when bear power is negative but rising.
On the other hand, we shouldn’t short - sell when bull power is negative, but the best time to sell is when bull power is positive but falling.
Divergences between the powers of bulls and bears combined with prices can show the best trading opportunities.
Trading rules for Elder – Ray:
Buy when:
1)The trend is up.
2)Bear power is rising but negative.
3)Latest peak of bull power is higher than the previous peak.
4)Bear power is rising from a bullish divergence.
Sell decisions are opposite of buying decisions.
Force Index:
Force Index is an oscillator which measures the force of bulls behind every rise and vice-versa. Force Index is developed by Dr Elder himself.
Trading rules for Force Index:
- When a 2-day EMA of the force index turns negative during uptrends, buy.
- Short when a 2-day EMA of force index turns positive in down trends.
- Bullish divergences between a 2-day EMA of force index and price gives buy signals.
- Bearish divergences between a 2-day EMA of force index and price give sell signals.
- When a 13-day EMA of force index is above its centerline, it signifies a bullish control and vice – versa.
- A new day in the 13-day EMA of force index signifies that a rally is about to continue.
- A new low in the 13-day EMA of force index signifies that a downtrend is likely to continue.
Trading Systems
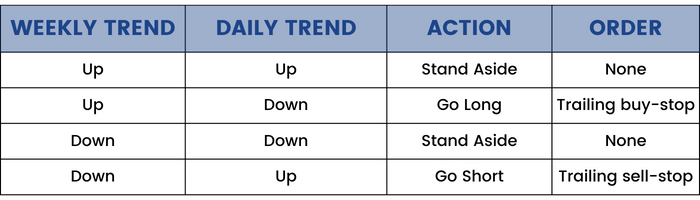
Triple Screen Trading Systems:
The Triple Screen system was first presented to the public in April 1986, and, as the name suggests, it applies 3 screens or tests for every trade. Triple screen system combines the trend following methods and counter-trend techniques.
The markets are too complex to be analysed just by a single indicator. Trend following indicators rise during uptrends and thus, give a buy signal and oscillators give the sell signals.
A major problem is selecting a proper timeline for identifying the trends. For example, a weekly chart of stock may show an uptrend, but a monthly chart for the same stock might show a downtrend.
The Triple Screen System first examines the longer-term charts and after that the shorter-term chart. We can use a weekly MACD Histogram. The slope is set as the relationship between 2 bars. When the slope is up, it indicates that the bulls are in control and vice-versa.
The 1st screen identifies the uptrends on a weekly chart.
The 2nd screen identifies the downturns. The second screen applies oscillators to identify deviations from the weekly trends to find buying and selling opportunities.
The 3rd screen identifies the entry points for an investor by using the intraday charts.
“Proper money management is essential for successful trading”.
A good trader always cuts their losses and outperforms others who cling on to it and keep hoping for a reversal.
Parabolic Trading System:
A parabolic trading system identifies trends and reverses the positions when a trend reverses.
The parabolic system provides discipline to a trader and stops them from making bad decisions.
Trading rules:
1)When the market is in a strong uptrend, go back several weeks and apply the Parabolic Trading System. Calculate the stop loss orders after updating the parabolic system to the current day and protect your losses in a long position and vice – versa.
Channel Trading Systems:
Prices always flow in channels, just like rivers flow in valleys. Channels help traders identify buying and selling decisions and make a trader avoid his bad decisions.
Channels parallel to trendlines are extremely useful for long – term analysis. They also show where to expect the support and resistance levels in the future.
A channel’s slope can identify a market trend. When a channel lies flat, trade all your positions within its walls.
Moving Average Channels:
A 13-day EMA channel is very important for a channel. A channel shows boundaries between a normal and an abnormal price action. Usually, a normal price channel is pushed outside because of unusual events.
If the prices touch the upper channel line, it signifies that the market is bullish and we should sell.
There are some trading rules mentioned for channels:
1)When a channel is flat, always buy and vice – versa.
2)When a channel rises and an uptrend is happening, a momentum signifies bullishness, a chance to sell will come very soon. This rule also works in reverse sharp downtrends.
3)When the prices reach an upper channel line but indicators like stochastic, trace a lower high, then a sell signal is given and vice – versa.
4)Buy when a channel is rising but is below the moving average, and cover your positions on the upper channel line.
Bollinger Bands:
Standard Deviation Channels, or Bollinger Bands are unique instruments because their widths change in response to market volatility.
Bollinger bands are very useful when a trader is dealing in options.
Buy with the help of Bollinger bands when there is less volatility in the market and options are cheap. Bollinger bands become wider when markets are volatile and shrink when markets are stable.
When prices rise out of a very narrow Bollinger band, it gives a signal to buy and vice – versa.
Risk Management
Trading is very exciting and is the reason why an amateur feels high while trading. Each trade that is done by us should be handled like a surgery, i.e., seriously and without any sloppiness or shortcuts.
A person who is losing his money cannot cut his losses quickly because losing traders keep clinging on hope. Their trading is based on emotions.
Emotional trading is a guaranteed way of suffering losses.
The author recommends developing a simple and good trading system. The more complex the trading systems, the more it is likely to fail. After developing a good system, we shouldn't mess with it.
Mr Elder then gives an example of a person called "Johnny" and states him as an emotional trader. Johnny buys a bad stock and is unable to minimize his losses because he keeps hoping for a reversal.
Successful traders cannot afford to dream in the markets. Dreaming and trading do not go together. A person should do a thorough analysis before investing any money in the markets. this will reduce their risk of suffering losses.
Knowing the basic differences between probability and randomness can help when trading.
There is a mathematical concept explained by Mr Elder which is known as the Player's Edge or the House Advantage. This concept states that for example, when we toss a coin, the 2 persons involved do not have an edge on each other. Each one has a 50% chance of winning. But, when you pull the slot machine in a casino that makes sure that we will lose 10% from every pot, there is a guarantee that we will lose 10 cents for every dollar we bet. This system of house advantage creates a negative expectation for us and a person is guaranteed to lose.
Good management of our money can help us make money and minimize our losses.
The 1st goal of money management is to ensure that a trader survives in the market. The best way to achieve this is to not put your money in a very risky stock. The 2nd goal should be to earn a stable rate of return, and, the 3rd goal should be to earn a high rate of return. The latter 2 goals should be concentrated on only after the first goal is achieved.
Taking big risks and hoping to get rich quickly is a very bad idea. There is a very high chance that you will lose your money. Safer stocks may take time to go up in value, but the advantage of a value stock is that their price does not go down very often.
If you want to be a successful money manager, establishing a good track record is very important.
For example, if a money manager can make 30% profit annually, people will rush to him to manage their money. If you can manage 10 million annually, the management fee can be up to 6%, making 600,000 dollars a year and an additional 30% profits.
The point is that to establish a good track record, a trader needs steady gains and small drawdowns and not the opposite.
A test has shown that a trader can lose a maximum of 2% on a single trade and not damage his/her long-term prospects. This is known as the 2% rule and is very advantageous according to the author.
We should concentrate on buying quality stocks to trade, rather than making money. The author gives an example of a professional and explains a good teacher will not count their money while they are teaching, rather they count the number of hours they have put in for that day. Similarly, if a trader keeps counting money instead of finding quality traders the chances are that they are likely to lose their money.
Some traders try to establish profit targets, i.e., sell when the price hits resistance and vice-versa. The Elliott Wave theory is one of the best methods to forecast reversal points. This theory is written by R.N. Elliot, which states that every movement in a market can be broken into waves and sub-waves. These are not entirely reliable but can occasionally be used to make correct predictions.
A trader should learn when to place market orders to be a successful trader.
Some have been described by the author:
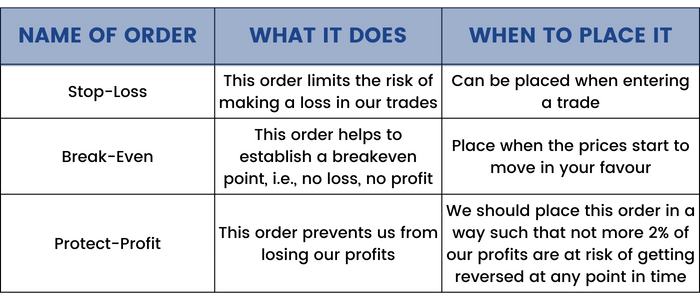
Conclusion:
Near the end of this book, the author says, "a trade does not end when you close out of position". Instead, we must analyse it and learn from it. Learning from our past experiences is the only way a person can evolve into a good trader.
The second point which the author states is to keep a before and after notebook, to analyse the reasons of why you decided to get into a trade. Is it simply because it looked good, or a proper analysis was done? Same rules apply for exiting.


