Narrative and Numbers: The Value of Stories in Business
Introduction
About the book
Narrative & Numbers: The Value of Stories in Business is one of the best books on business valuation that teaches you the importance of storytelling while crunching numbers in order to perform your analysis and valuation for any company. The book majorly focuses on the differences between numbers and stories. If a business valuation is not supported by an underlying story, it will seem soulless and untrustworthy. However, if a story lacks numerical evidence to back it up, then there's a chance that it might be a scam. So, the book is a must-read for all investors and managers or even the founders and CEOs of a company because it teaches business valuation in a unique and effective way. It explains how both narrative and numbers are equally important for analyzing whether a company is undervalued or overvalued so that you can appropriately take a decision to invest. This book can be used by investors, analysts and even the management in order to value a company.
About the Author
The book is authored by Mr. Aswath Damodaran, who is a professor at New York University and also an experienced investor. He wrote quite a number of books on finance, valuation and corporate finance. In his book 'Narrative & Numbers', the professor has emphasized the fact that business valuation is all about combining stories with numbers. Both are essential to succeed. Professor Aswath Damodaran is popularly known as "Wall Street's Dean of Valuation".
Buy the book
The book teaches you a unique way to value a company and how easily it is possible to find out whether the company is undervalued or overvalued. We highly recommend you to read the entire book. (affiliate link)
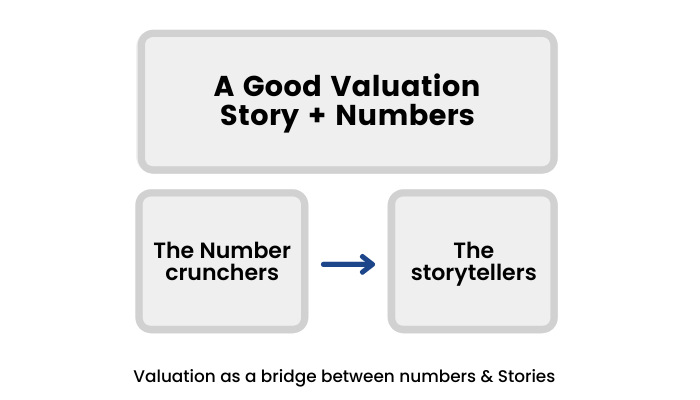
A Tale of Two Tribes
Professor Damodaran starts the book by asking the readers which tribe they belong to, the number crunchers (using left brain in order to remain logical) or the story tellers (using right brain for creativity). He advises the readers to use both sides of the brain, i.e., combine logic with creativity in order to succeed in valuing companies in the stock markets.
A Sample Test:
The professor has taken a different approach by directly starting up by introducing valuation to us rather than the building blocks first. This is done in order to clarify different approaches to valuation.
Before understanding the approach, it will be better to know as to how the Professor values a company. He generally values a company on the basis of three estimates-
- Sales growth
- Operating margins
- Sales to capital employed ratio
You would come across these three variables or estimates in later chapters when he values a company. Let’s now look at the different approaches to valuation by the professor with the help of an example of Ferrari.
How would a Number Cruncher approach the valuation of Ferrari?
I expect Ferrari to grow revenues at a CAGR of 4% per year for 5 years, post which it will continue to grow at perpetuity at the GDP growth rate. The pretax operating margin would be 18.2% and Ferrari will generate sales of EUR 1.42 for every euro invested.
If you notice, this somehow confuses a normal reader as to how these numbers are making sense.
How does a storyteller approach valuation of Ferrari?
Ferrari is a luxury automobile company that charges really high prices for its cars in comparison to its competition. On one side, it will earn a very high margin because of pricing but on the other hand it will make itself available to just a small market, therefore slower revenue growth than the automobile market.
Now, this approach is making some sense as it's easily digestible, however, it gives little understanding as to what price should be paid for this luxury automobile company.
Using both sides of brain
Ferrari, being a luxury automobile maker should be able to garner a revenue growth of 4% per annum for the next 5 years, which is lower than the automobile market in general. The company will be able to earn higher margins than a typical car maker of 18%. And finally, the company would require higher reinvestment needs and therefore the sales to capital employed ratio would be at 1.42.
This looks the best amongst the three as the stories are backed by numbers and similarly numbers are backed by a story.
The allure of storytelling
Stories not only help us connect with others but are far more likely to be remembered than numbers. But it is very easy for a storyteller to wander into a fantasy land where he or she forgets to integrate the story with reality. Like saying, HDFC bank can grow its revenues at a CAGR of 25% forever is a good story however, makes it very unrealistic in real world as attaining 25% CAGR consistently over long term is very difficult to attain.
The power of numbers
With the storage and processing capabilities the investors today have a lot of numerical data with them, typically more than required and hence leads to “analysis paralysis”. So why do we need numbers then? Well, in an uncertain world, numbers offer a sense of objectivity and precision. The precision is however often illusionary as there are many behavioral and cognitive biases that can influence the numbers for businesses. For example, just because you like HUL, you are biased towards the company and hence your revenue and operating margin estimates are bound to be higher than other analysts tracking the company.
Professor Damodaran explains the three aspects for effective data management, such as:
- Use judgment on the amount of data and the time period over which the data analysis is to be run. Try to minimize biases in data collection.
- Use basic statistics (average, CAGR, etc) to make sense of large data
- Finally come up with interesting ways to present the data that makes sense even to a novice.
We relate to and remember stories better than we do numbers, but storytelling can lead us into fantasyland quickly, a problem when investing. Numbers allow us to be disciplined in our assessments, but without stories behind them, they become weapons of intimidation and bias rather than discipline.
Valuation as a bridge
The solution is simple. You need to bring both stories and numbers into play in investing and business, and valuation is the bridge between the two.
How to discipline story telling?
Professor Damodaran has suggested a 3P framework.
- Whether the story is possible. Going 100% electric car is a possible event. This although makes sense, however, we do not know how and when this will happen. Hence, it’s a possible story but unlikely to happen if we factor in reasonability.
- Whether the story is plausible. Replacement of old combustion engines with electric vehicles is a plausible event. This seems reasonable, however, I can not still be very sure about it since there are production constraints to meet the replacement demand. Hence, it’s a plausible story.
- Whether the story is probable. 25% of the new cars purchased globally will be electric. Now, this seems like a probable event or story.
Not all possible stories are plausible. Similarly, not every plausible story will be probable.
The valuation process:
Given below are the steps to follow in order to transform the story-to-numbers:
Step 1: Develop a narrative for the business you are valuing.
In the narrative, you tell your story about how you see the business evolving over time.
Step 2: Test the narrative to see if it is possible, plausible, and probable.
There are lots of possible narratives, not all of them are plausible, and only a few of them are probable.
Step 3: Convert the narrative into drivers of value.
Take the narrative apart and look at how you will translate it into valuation inputs, starting with potential market size and moving on to cash flows and risk. By the time you are done, each part of the narrative should have a place in your numbers, and each number should be backed up with a portion of your story.
Step 4: Connect the drivers of value to a valuation.
Create an intrinsic valuation model that connects the inputs to an end value in the business.
Step 5: Keep the feedback loop open.
Listen to people who know the business better than you do and use their suggestions to fine-tune your narrative and perhaps even alter it. Work out the effects on the value of alternative narratives for the company.
Change is constant
Finally, the professor advises us to not have the illusion that the story can not change. It is bound to change as the business environment as in the GDP growth rate, inflation, interest rates change around you. Hence be cognizant to this fact and update the story as and when change is material.
Another determinant for changing the story for a company is when the corporate life cycle of the company changes. Look at the chart.
The Corporate Life Cycle
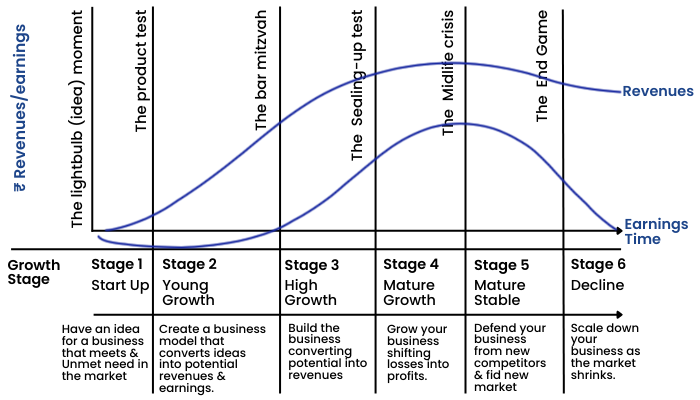
Early in the life cycle, when a business is young, unformed, and has little history, its value is driven primarily by narrative, with wide differences across investors and over time. As a company ages and develops a history, the numbers start to play a bigger role in value, and the differences across investors and over time start to narrow.
Professor advises to use the story to process numbers at each of the stages in the corporate life cycle in order to generate views about the company.
The following chapter onwards, each of the steps of valuation are discussed in depth.
Tell Me A Story
This chapter helps the readers to understand why 'Stories' are important. It also cautions them about the hazards when stories are not concurrent with the real world and run into fantasy land.
Here the author explains why one story is remembered more than the other is because of subjects making inferences and noticing the connections in the story. What he means here is that stories work best if they not only involve listeners but also require them to think on their own and make interpretations.
In the business world, stories have been used for many purposes. In the early stage (startup phase), storytelling is designed to encourage investors to attract high value to business and invest capital. With employee’s storytelling helps to get them excited working for the company. With customers, it helps companies to spur sales even at premium prices.
In investing, storytelling is useful for both investment philosophies and recommendations. As we know, there are many investors who snub numbers and concentrate on the big picture, i.e., the story behind the company. In sell-side equity research stories play a major role in the overall analysis. This is because it interacts better with the readers than numbers.
Professor Damodaran explains a very classic instance on how stories influence us. We all remember the story of Warren Buffet investing in American Express. He invested in the company, when the company was tarred by a scandal wherein a commodity trader deceived the bank by forged the collateral salad oil with contaminated oil. The value of American Express collapsed and hence gave the opportunity for Buffet to invest. The investment story, however, printed probably in every investment book or article glamouring Buffet’s acumen, has actually made very little money for him. The stock gave the partnership a profit of just $33mn which is a paltry sum when compared with his other wins.
This brings us to the dangers of storytelling. As we noted in an earlier section, stories are powerful because they connect with people’s emotions, get remembered, and elicit action from listeners. It is for each of these reasons that stories can be extremely dangerous, not just for listeners but also for storytellers.
“Master storytellers want us drunk on emotion so we will lose track of rational considerations and yield to their agenda.”
To the extent that business stories are often built around the experiences of the storytellers, it is easy to cross the line between real and imagined experiences. Founders who invent improbable rises from poverty, portfolio managers who claim to have had the foresight to get out just ahead of market collapses, and CEOs who invent struggles with nonexistent business challenges may, with repeated retelling of their stories, start believing them. This is not to suggest that stories are always made up or full of falsehoods but to show that even well-meaning storytellers can sometimes reinvent their memories and that those listening to those stories might not be remembering the stories the way they were actually told.
Stories allow businesses to connect to investors, customers and employees at a level that pure numbers can’t. But storytelling left unchecked can easily lose focus and can be dangerous for everyone involved. In this book the reader will get a checklist to ensure that he doesn’t let hope become expectations.
The Elements of Storytelling
In this chapter, the Professor explains how to put a story in the fundamental numbers of a company. He explains that storytelling is both an art and a craft. Like an art, some aspects of storytelling can not be taught. At the same time, like craft, many components of storytelling such as languages and structure that evoke stronger reactions from listeners, are teachable. The chapter basically deals with how to structure your story, which as an analyst you might want to propagate to the larger audience, in order to make them believe. At the same time, for an investor, knowing about how to create stories, let him/her investigate the biases that are formed when listening to others' stories.
You must have heard stories about the founders. Investors tend to get attached to the story of a founder that in turn affects their investment decisions. However, this has two dangers according to Professor Damodaran.
- Businesses that are known because of just the founders, find themselves prone to the reputation risk of the founder. In the Indian context, what better example than Vijay Malaya and Kingfisher Airlines.
- Investors who just look at the achievements of the founders often miss to look at the performance of the company. This seems to be true in case of many startups where the founder becomes the apple of the eyes of the investor and they somehow overlook the huge capital drain that takes place inside the company.
Nonetheless, let's point out various stories that we hear about the founders.
- The Horatio Alger story: This is a classic, especially in the United States, and it is a variant of the rags-to-riches story. Investors are attracted to this story by the tenacity of the founder in making something of himself or herself in the face of immense odds.
- The charisma story: In this narrative the founder’s story is built around an epiphany, a moment when he or she gets a vision of business opportunity and then proceeds to fulfill that vision. Elon Musk has founded or co-founded many businesses, including SpaceX, Tesla, and SolarCity, but with each of these businesses, investors are as much drawn to him, as a charismatic founder, as they are to the companies themselves.
- The connections story: In some businesses, it is who you know that gives you the advantage, and founders who have the right connections, either because of family background or due to their past roles as politicians or regulators, are given special deference.
- The celebrity story: Investors are sometimes drawn to the celebrity status of a founder; in the belief this status will allow them to attract business and generate value. Jack Nicklaus, Magic Johnson, and Oprah Winfrey have all used their celebrity status to build successful businesses, with many investors being drawn to the celebrities’ names as much as to the businesses themselves.
- The experience story: It is the track record of some founders that draws investors to their businesses. The assumption, when investing in these businesses, is that if they have been successful in the past in building businesses, they will be successful in their new ventures.
Now that we are familiar with some of the founder stories, let's look at business stories that the professor has listed:
The Bully
- Type of business: Company with a large market share, a superior brand name, access to lots of capital, and a reputation for ruthlessness.
- Investment Pitch: They will steamroll competition to delive ever-increasing revenues and profits.
The Underdog
- Type of business: Company that is a dis-tant second (or lower) in market share in a business, with claims to a better or cheaper product than the dominant company.
- Investment Pitch: They will work hard than the dominant player at pleasing customers, perhaps with kinder, gentler corporate image.
The eureka moment
- Type of business: Company that claims to have found an unmet need in the market, usually in a serendipitous way, and then has come up with a way of meeting that need.
- Investment Pitch: They will succeed as a business by filling the unmet need.
The better mouse trap
- Type of business: Company that con tends it has a better way of delivering an existing product or service that will be more desirable and better suited to the need.
- Investment Pitch: They will eat into the market share of the existing players in the market.
The disruptor
- Type of business: Company that changes the way a business is run, altering fundamental ways in which the product or service is delivered.
- Investment Pitch: The status quo is ineffective and inefficient, and disruption will change the busines (while making money).
The low cost player
- Type of business: Company that has found a way to reduce the cost of doing business and is willing to cut prices on the expectation that it can sell a lot more.
- Investment Pitch: Increased sales will more than make up for lower margins.
The missionary
- Type of business: Company that presents itself as having a larger, more noble mission than just making money.
- Investment Pitch: They will make money while doing good (for society).
What investors need to understand with respect to business stories is that:
- It is possible for a company to have more than one story at the same time. Uber in 2015, was telling the story of a disrupter and a dominator both. This was because Uber was changing the car services market altogether. At the same time, Uber was dominating the taxi and other car services market via its access to capital.
- The story that a company narrates can change or evolve over its lifetime. For example, Google was the underdog when it first entered the search engine market in 1998 but transitioned into a dominant player by 2015.
In the end, let's find out the characteristics of a good story. You as analysts can use such stories to convey your thoughts to the larger audience to have better impact.
- The story should be simple to understand.
- It should be credible and should meet the reality test.
- The story should be authentic.
- Try to give an emotional touch. Here the professor suggests you to be passionate about your story.
The Power of Numbers
Stories create connections and get remembered, but numbers convince people. As machine power continues to expand, businesses talk about the use of data in operations and decision making. Investors have also become number oriented with some investors putting their trust entirely on data and sophisticated tools for analyzing those data. We call them the 'quants'.
The notion that numbers are scientific and more precise than stories is deeply held. Another reason why investors are so much attracted to numbers is that they appear to be unbiased. However, like stories, numbers too have their own dangers.
The illusion of precision
Since numbers are objective, investors have a false sense of illusion that they are accurate. For instance, just because investors have come across a valuation through complex data analysis, it would necessarily be accurate. This is a wrong notion.
The illusion of objectivity
People respond to data as per it is framed. In the interests of providing comprehensive statistics, Professor reports the average tax rates for each sector using three different approaches for averaging:
- a simple average of the tax rates across companies in the sector,
- a weighted average of the tax rates across companies in the sector, and
- a weighted average of the tax rates across only money-making companies in the sector.
Each year there are journalists, politicians, and business trade groups that use his tax rate data, often to support very different agendas, like the business trade groups that intend to show that they pay their fair share of taxes, pick the tax rate measure that yields the highest value to make their case.
Similarly, the advocacy groups that believe U.S. corporations don’t pay their fair share in taxes look at the same table and find the tax rate measure that yields the lowest value to bolster their arguments.
Both sides argue that the facts (and numbers) are on their side and neither will admit to the existence of bias.
Illusion of control
Professor Damodaran states that measuring something does not necessarily mean that you are controlling it. Just as a thermometer can tell you that you have a fever but cannot treat it, measuring the standard deviation of a portfolio only tells you that it is risky but does not protect you from that risk. The danger with deluding yourself that you are in control, just because you have a sophisticated measurement tool, is that you may not only let the numbers overwhelm your common sense but that you will not prepare yourself properly for the dangers ahead.
So, what is the solution to it?
The solution is to add a story to the number. But if numbers are dangerous because they come with the illusions of control, precision, and objectivity and can be easily imitated, how will adding stories to numbers reduce those problems?
This is so because when you are forced to unveil the story that backs your numbers, your biases are visible not just to the rest of the world but to yourself. So, for example, if you feel that HDFC bank can grow its revenues at 25% p.a. for the next 10 years, the audience can doubt the statement. However, let's say that your story states that you expect the Indian credit market to expand @15% p.a. and HDFC bank being the dominant player will take market share and hence would be able to grow at a faster rate than the market. This way, it is clear that you expect HDFC bank to remain a dominant player in the future and hence there is a story supporting your numbers.
Number Crunching Tools
The number crunching process can be broken down into three parts:
Data collection: The first step is collecting the data. In some cases, this can be as simple as accessing a computerized database. In others, it will require running experiments or surveys.
While collecting the data, the following choices an analyst needs to make.
a. Public company vs private company data: It is far easier to extract data of public companies than a private company.
b. Accounting vs market data: Public companies need to make regulatory disclosure of their accounting data. The market data, i.e., the market prices, bid-ask spread, trading volume, etc. can be easily found for public data. Accounting data is relatively difficult to gather for a private company. The market data of private companies is very difficult to get. This is because the private equity transactions are done in a very confidential manner and there is no regulatory requirement for the private company to disclose these data.
c. Domestic vs global data: Analysts need to make choices whether the averages or macro and micro numbers used in their analysis need to be domestic or global.
d.Quantitative vs qualitative data: Databases tend to be mostly quantitative because quantitative data is easier to store and retrieve. However, nowadays due to the surge in social media sites the development of more sophisticated techniques for reading, analyzing, and storing qualitative data are present.
Additionally, there are a few biases in data collection that analysts need to be aware about.
a. Selection bias: Since collection of data is not an easy task, this can give rise to selection bias. This means that it has been noticed that selection of a particular time period of data can alter the averages and hence change the decision making. For, example, over the last twenty years, growth stocks (such as Amazon, Tesla, etc.) have outperformed the market. However, if we see a fifty-year history, value stocks seem to have outperformed. This is called selection bias. Although this bias is unavoidable, knowing such bias exists can improve decision making through introspection.
b. Survivorship bias: These bias states that databases reflect only the survivors. For example, when we look at the returns of Sensex, we look at the return of companies that are a part of Sensex at present. However, many companies have been excluded from Sensex over the years and the present returns do not reflect the losses suffered by investors in case they were holding these stocks.
c. Noise and error: In the big data world, due to an abundance of data, analysts get distracted from data that are actually irrelevant for their decision making. This is called noise.
Data analysis: Once the data has been collected, not only does it have to be summarized and described, but you have to look for relationships in the data that you can use in your decision making. It is at this stage that statistical analysis comes into play.
Analysts and investors use statistical tools like averages, correlation, beta, standard deviation, etc. in order to analyze the data. However, there are few biases as well:
a. Averages are cursed since it is very much affected by outliers. For example, company results in the year 2020 were outliers and most companies present their average performance by excluding the year since it was an outlier.
b. Standard deviation assumes that the distribution is normally distributed. However, in real life data is seldom normally distributed. Hence it can be dangerous at times to consider normal distribution or standard deviation in calculating risk.
Presentation: Having analyzed the data, you have to present it, not only so others can see and use the information you have gleaned from the data, but so you yourself have a sense of what that information is.
From the next chapter onwards we will start by building narratives and then connecting with numbers. The learnings from the past chapters will be utilized going forward.
Building A Narrative
In this chapter, the professor has basically explained to us how you as an investor or a founder or a manager pitch your company’s story to the community.
Whether you are a founder, a manager or an investor in a company, you ultimately have to play the role of a story teller. A good story as per the author is one in which the interests of listeners and storyteller converge.
As discussed in earlier chapter the elements of a good narrative are:
- It has to be simple.
- It has to be credible.
- It has to inspire.
- It should lead to action, which means for the employees to come and work for you or for the investors to invest money in the company.
Step 1: A corporate story begins with telling something about the company. If the company has a long history, start by explaining the same, along with some numbers like past sales and/or profit growth, etc. For young companies, the professor advises to narrate the history of owners/founders instead of the company.
Step 2: Now tell the audience about the market in which your company is operating. Professor has provided us with a list of questions as per the company types that you need to answer in order to judge/tell the audience about the market.
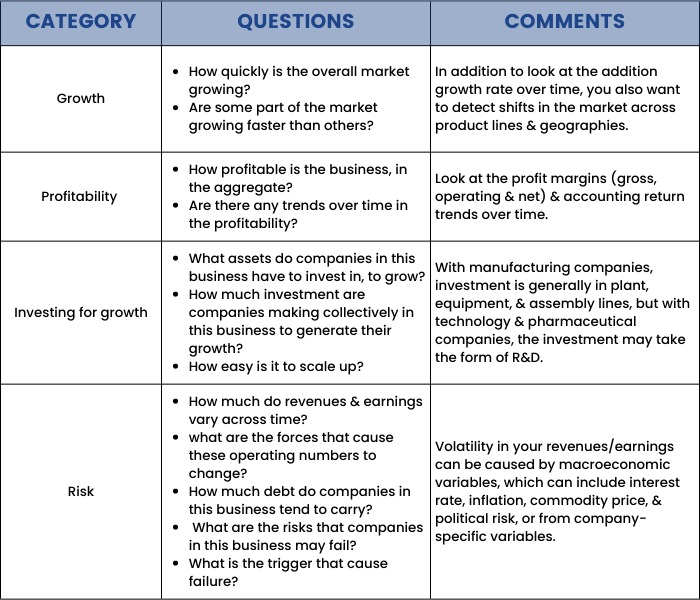
Step 3: Now, finally tell something about the competitors. Here as well, we have a list of questions to be answered in order to make a fine narrative about the competitor analysis.
Competative analysis:

The key to creating a successful story about the company is to constantly revisit it as the market situation changes.
Test Driving A Narrative
The narrative has to go through the stage of introspection. This is done via the 3P approach of Professor Damodaran, which is accessing whether the story is Possible, Plausible or Probable. Refer to the graph below in order to understand the stages of a narrative better.

Lets understand this via an example.
Professor Damodaran valued Uber in June 2014 as an urban car services company which means that professor hypothesized that Uber will be able to take over the urban taxi market. This narrative clearly met the possibility and plausibility test at that time since Uber was already operating in dozens of cities in 2014.
But as he started exploring and indulging more into the analysis (which is an essential step in narrative build-up) he recognized that Uber was increasingly penetrating the sub-urban markets and was also competing with the rental companies. This expanded the market size significantly and can be regarded as a plausible story.
Another addition to the narrative was that Uber could eventually disrupt the automobile industry in a way that people would not buy a car and prefer Uber for daily commutes. This at that moment seemed just a possible story.

Tween the possible, plausible, and probable are not always easy to draw, but one simple technique professor suggests is to think about the distinction between impossible, implausible, and improbable.
Impossible and improbable are quantifiable, the first because you are assigning a zero probability to an event happening and the latter because you are attaching a probability (albeit a low one) that an event will happen. Implausibility lies in the middle, since proving that it cannot happen is not feasible and attaching a probability judgment to it is just as difficult. At the risk of sounding fuzzy, these are the parts of stories that just don’t sound right, and the figure shown below where he would put it in what he calls the “continuum of skepticism.”he lines bet.
The Continuum of Skepticism:

Let’s now listen to some of the impossible stories:
- Bigger than the economy: Sometimes the analysts/storytellers become so indulged in their stories that they forget to be realistic. In Discounted Cash Flow analysis, there is a concept of calculating the terminal value. Its significance is that one cannot go on estimating the cash flows of a company forever. Therefore, analysts usually do it for the next 5-10 years and then put in a terminal value, which basically is the present value of annuity. As a matter of fact, it is not possible for a company to grow infinitely at a growth higher than the growth rate of the GDP of the country’s economy in which it has operations. If this happens, the company will somewhere down the line become the economy. In the Indian context since the economy is growing at 5-6%, if you see an analysts DCF report signaling a 9% perpetual growth rate, it basically creates an impossible story.
- Bigger than the market: Similar is the case with the market. You cannot assume that your company’s revenue will grow at a growth rate higher than the growth rate of the market in which it is operating. This is simply because, as you grow at a rate faster than the industry, it indicates that you are gaining market share, however, you can gain market share only to a limit of 100% of the market and not more than that.
- Costless capital: Businesses need capital to grow, and those who supply capital invest to earn a return. With debt, that required return is explicit and takes the form of an interest rate, but with equity, there is scope for wishful thinking, since the bulk of the cost is implicit. In other words, when investors buy your equity, they hope to get their returns in one of two ways: as dividends while they hold the stock and in price appreciation when they sell the stock.
Lastly, the professor explains a very interesting approach to judge the probability of a story.

From Narratives To Numbers
Now, once you have developed a story or have listened to a story which passes at least the plausibility test, it’s time for you to provide numbers to such stories.
The intrinsic value is the value you would attach to an asset based upon its fundamentals: cash flows, expected growth, and risk. At its core, if you stay true to its principles, a DCF model is an intrinsic valuation model, because you are valuing an asset based upon its expected cash flows, adjusted for risk.
This is how a typical valuation model through DCF looks like.
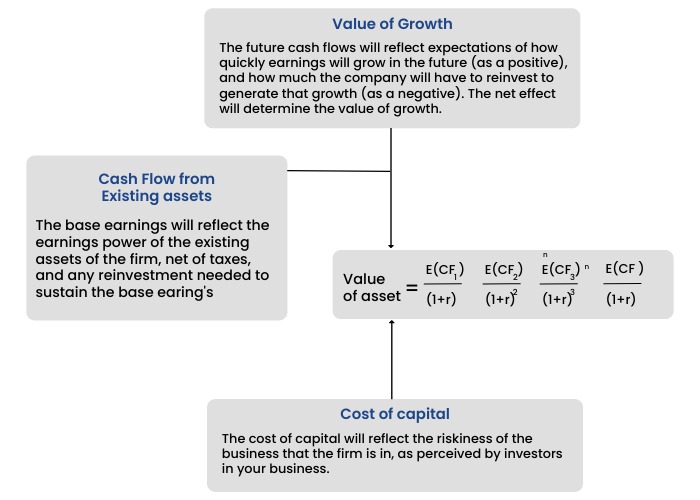
So the E(CF1), E(CF2), etc are the expected free cash flows that the company will be able to generate in the future years. These are estimations and hence requires deep knowledge about the industry and company.
Free cash flow to a company is calculated as:
Revenue x Operating Profit Margins x (1-Tax Rate) = Post Tax Operating Margin – Reinvestment = Free Cash Flow to the Firm
The calculation of free cash flow as per Damodaran’s model requires three major estimates:
The expected sales, expected operating margins and the expected reinvestment.
As you can see here, once a story is established, the DCF model requires numbers to it. This means that no matter whether your story is fascinating and looks possible and plausible, valuation will still require numbers to be attached to those stories. Let's look at how to input numbers into a story.
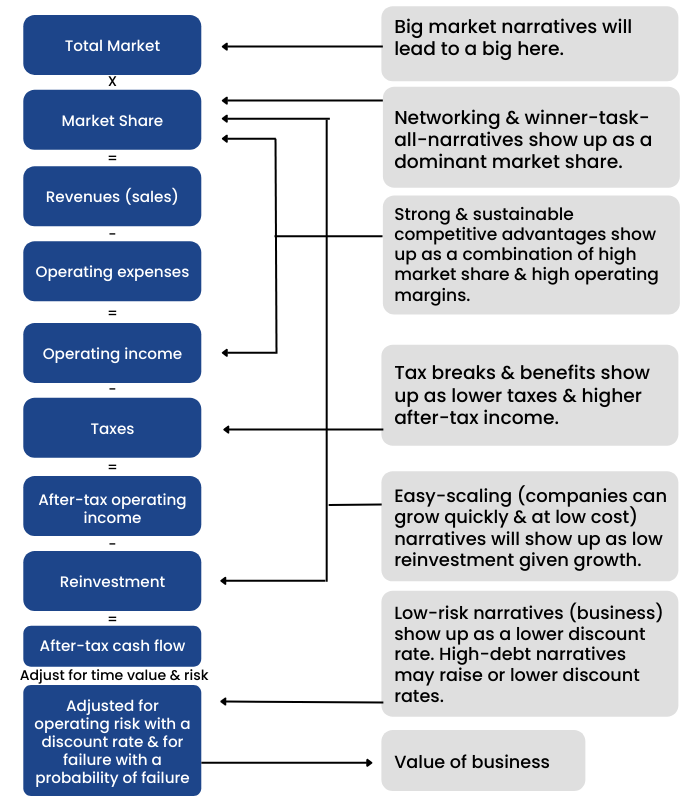
Connecting stories to Valuation inputs:
Professor Damodaran has provided an example of how he connected his story/narrative on Uber (As discussed in the previous chapter) to numbers to be used in the DCF valuation.
Numbers To Value
So, let's bring everything together. Earlier, the professor explained to us to test the possibility / plausibility of a story. Then he told us to write a connecting story. Thereby in the previous chapter, we defined the drivers of value, namely the sales growth, operating profit margin and reinvestment. In this chapter therefore, we will move on to assigning a value to those drivers.
As you review the mechanics of this story, it is worth emphasizing that the inputs are interconnected, that is, changes in one almost always trigger changes in the others. Thus, if you decide to increase the growth rate in a valuation, you have to consider how much your reinvestment will need to change to deliver that growth and whether you will have to alter your business mix (and the risk of that mix) and financial leverage to deliver that growth.
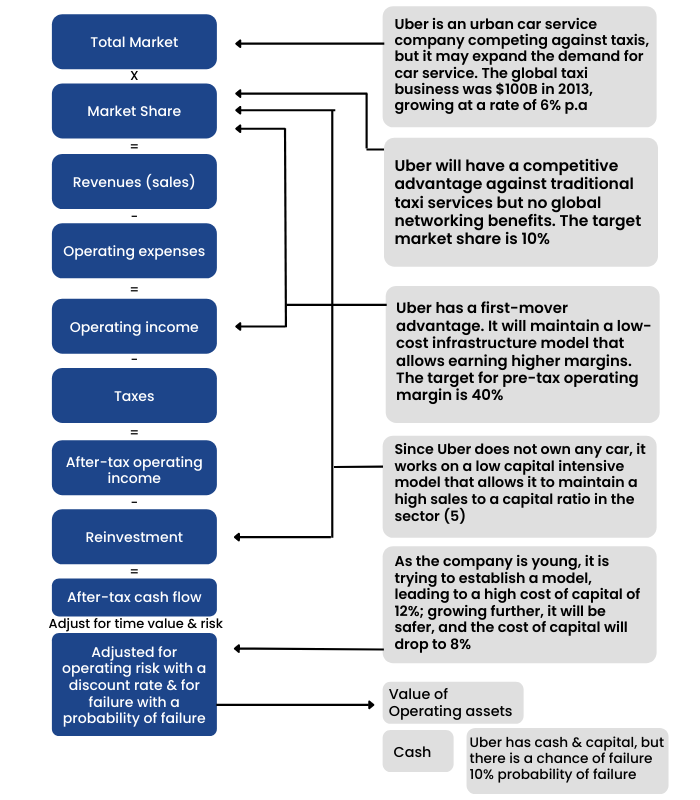
Let's look at the numbers assigned to the Uber story by taking the different input factors and their assumptions:
- Total Market: The total size of the urban car service company in the base year is $100 billion, growing at 3% per year, pre-Uber. Uber and other ride-sharing companies will attract new users into the business and increase the expected growth rate to 6% per year.
- Market Share: Uber will reach a 10% market share of the total market, with the market share rising each year to get to this level.
- Pre-tax operating margin & taxes: Uber's operating margin will rise from 7% (base year) to 40% by year 10, and Uber's tax rate will drift up from current levels (3196) to the marginal tax rate for the United States (40%).
- Re-investment: Uber will be able to maintain its current low capital-intensity model, generating sales to a capital ratio of 5.
- Cost of Capital: Uber's cost of capital starts at 12% (the 90th percentile U.S. companies) in year 1 and drifts down to 10% in year 10 (when it becomes a mature firm).
- Likelihood of failure: There is a 10% chance that Uber, given its losses and need for capital, will not make it.
Once the cash flows (Post tax Operating profit – reinvestment) are estimated, we need to discount them at an appropriate discount rate. One needs to be very careful with the terminal growth rate as explained in the previous chapter. According to the author, terminal value comprises about 60-70% of the overall value of the company.
Taking the present value of the cash flow to the firm for the next 5-10 years and subsequent terminal value will give us the enterprise or the firm value. Now there are a few adjustments like:
- Debt and cash: Debt needs to be subtracted from the firm value and cash needs to be added back.
- Cross holdings: In case, the company you are valuing holds a stake in other listed/unlisted entities, we need to add their proportionate valuation as well.
- Stock based compensation: This is an operating expense and hence needs to be adjusted.
The Professor also acknowledges that the valuation/ numbers would change with the story. For example, if the professor considered Uber as a urban + suburban car service company instead of just an urban car service company, the valuation will differ to a large extent.
Improving And Modifying Your Narrative – The Feedback Loop
Once your narratives are ready and have been replaced with numbers in order to reach a value for the company, is the job done? Well, according to the professor, no. The work has just started. The reason being when you are telling a story, it is your own story and can definitely be misleading. Therefore, it is equally important to listen to other people’s stories about the same company or take others’ viewpoints on your story about the company in order to make the right decision.
The following are the methods suggested by Professor Damodaran in this chapter:
- Fighting Hubris: Once you have developed a story about a company, you naturally start feeling biased about it. You obviously won't support any criticism of it as per the normal human nature. However, it is disastrous in stock markets. One should tell their narrative about the company to a group of people who are not like minded and then analyze their view points to understand any misses or corrections required in your story.
- Face up to Uncertainty: Since the story is a prediction about the future, hence it does not make sense to aspire for preciseness. Following measures are suggested to overcome this problem of uncertainty: Create a scenario analysis wherein you are analyzing various scenarios affecting the company and subsequently the change in valuation due to those. This can be done with various statistical tools such as Monte Carlo analysis, decision trees, what if analysis, etc.
- Pricing Feedback: The steps we followed are, forming narratives, attaching numbers to those narratives and finally getting the value. Now comparing this value with the market price, we most probably will find it divergent from the market price. There are three obvious reasons for the same, the market is wrong and you are right, market is right and you are wrong and the third being, both are wrong and intrinsic value is an unknown number. The best way to have an unbiased opinion as per Professor is to recognize the differential as due to the third reason. With that, you now need to reverse engineer the market’s expectation about the company’s fundamentals given the current price. This allows you to get feedback of how your expectation about the company differs from the market and hence change the narrative if required.
Finally, in order to get proper feedback, follow these suggestions by the Professor:
- Make your narrative and valuation transparent
- Have an open forum for people to comment on your valuation
- Separate constructive criticism from noise
- Use the narrative to organize the criticism
- Look for the weakest link
- Think process, not the product, i.e., focus more on the forecasts then on the value derived.
Narrative Alteration – The Real World Intrudes
“When the facts change, I change my mind. What do you do, sir?”
Continuing with the last chapter, Professor Ashwath Damodaran has listed out why narratives alter in the first place.
The only constant in business is change. It is prudent to respond to new developments and information by revisiting your narrative and evaluating whether any parts of it may need to be changed.
Qualitative vs Quantitative:
- Qualitatives can range from top management change, legal judgment about the company, announcement of activist investors taking substantial stakes.
- Quantitative news changing narrative can be surprises in earnings reports, inflation or economic growth news, etc.
Inside vs Outside:
The information can sometimes be from the company in the form of either a required financial disclosure or as a corporate announcement (of an acquisition, divestiture, or a buyback) and sometimes from external sources (financial news, equity research analysts following the company, or regulatory authorities). In some cases, it may even be from a competitor, with the information that you get changing the way you think about the market and competitive dynamics.
Micro vs Macro news can also affect your narrative about the company.
The following table defines how various news or information changes fundamentals of the company (both narratives and numbers) and hence affects the value.

Professor Damodaran did the same in his Uber valuation saga. His valuation of Uber in June 2014 was USD6bn, while after changing the narrative his estimated value came out to be USD23.4 in September 2015. Let's look at what changed in the company, provoking the professor to change the narrative to affect the value to such a great extent.
Let us see how input changes from new stories in case of Uber:
Image:
Next chapter deals with how to inculcate news in our investment thesis.
News And Narratives
In the last chapter we discussed various aspects of information that affect the narrative. In this chapter, the professor has specifically discussed how corporate news affects the narrative.
The most important corporate event is obviously the earnings report. A company publishes results every quarter and the commentaries may change the narrative about the company. The following table summaries how corporate earnings influence narratives.
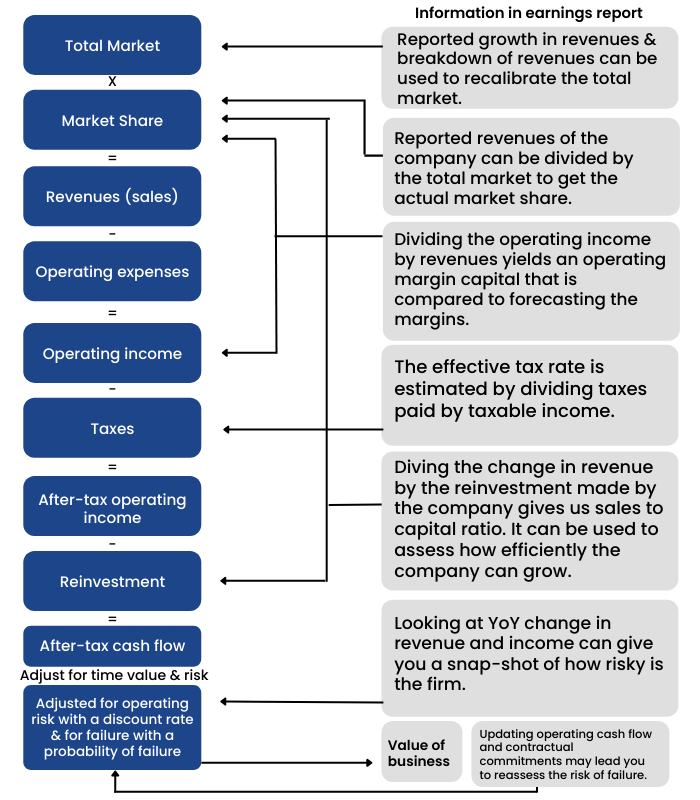
Apart from corporate earnings, other corporate news like acquisition or divestment of assets, financing, dividend policy changes are all going to affect the narrative about the company in one or the other way. This is the very reason why even long-term investors need to be vigilant about what is happening around them and hence actively follow news.
Another important news affecting the narrative and subsequently the value of a company are corporate governance stories like corporate scandal and misconduct. In Indian context, Manpasand Breweries, JP Associates, Café Coffee Day, Satyam are prominent examples of how corporate governance issues have influenced the narratives about the company and hence once a market’s favorite, turned out to be a nightmare overnight.
Go Big- The Macro Story
The most important aspect in this chapter is the process explanation to segregate corporate stories into macro and micro parts.
There are many companies that are cyclical or are dependent on commodity prices or the country level risk. Therefore, their valuation is as much dependent upon the commodity prices or economic scenario (external factors – macro) rather than the fundamentals (internal factors – micro). However, it is prudent to believe that not everyone is proficient in estimating commodity prices or market cycles to predict the booms and recessions.
Therefore, the professor has advised us to separate these vertices. How? Let’s take an example.
Suppose we are valuing Exxon Mobil. It’s an oil exploration company and therefore is dependent upon crude oil prices. So, can I just base the investment decision on the expectation of crude oil prices? If that was the case, then why can’t I just buy crude oil futures. This means that for buying into ExxonMobil, there are company level factors like management strength, efficiency, cost of production, corporate governance, etc. which also affects the company’s valuation. Hence the professor advises to take out two step valuations.
- Value the company as per the average crude oil price during the period under consideration. For example, the price of crude oil as of March 2009 is $45 per barrel. However, the latest available financial data for the company was as of December 2008. The price of crude oil during the twelve-month period ending December 2008 was $86.55 per barrel. As the operating profit depends heavily on crude oil prices, hence a lower crude oil price indicates a lower profit in the coming year. Therefore, as a base estimate, we take out what the operating profit would be when the oil price was $45 per barrel. This can be taken out via the regression analysis, wherein we derive a formula based on the historical relation of the company’s profit and crude oil prices. The calculated number was $34.61 bn. Valuing the company on the basis of 2% perpetual growth rate and a 8.18% cost of capital, gave a value of operating asset at $342.5bn or $69.43 per share. At the CMP of $64.83 ( as of Mar 2009), the stock seemed undervalued. This is based on the expectation that normalized oil price will be $45.
- Now, since the profitability depends heavily on crude oil prices, let's estimate the crude oil price for the next year. This is done via simulation, wherein probabilities of movement of the oil price (both upside and downside) are taken into consideration and a list of possible prices is evaluated keeping a certain normalized price as mean ($45 per barrel in our example).
Oil Price distribution:

Now, estimating the value using the same approach used in Step 1 (estimating operating profit via regression analysis and subsequently calculating the per share value) at each estimated oil price and thereby taking an average of the resultant value, gives $62. The CMP (as of December 2009) of $64.83 suggests that the company is overvalued.
Cumulating the above two points, the decision-making process would be as follows:
If I believe that the company is more dependent on the company level factors (micro), then a value of $69.43 (step 1) makes it undervalued and hence I would buy it.
However, if I believe that the company is a mature one and hence depends only on the crude oil price (macro story), I would avoid buying the story as it is overvalued as per the value of $62 derived in Step2.
There are two reasons for separating your corporate stories into macro and micro parts:
- It will be clear to you, how much of your story comes from each component and will allow you to track your performance on each part. Thus, if you buy Exxon and the stock price drops, you can at least assess whether it was because you got the oil price portion of your story wrong or because your story about Exxon as a company was flawed.
- Your breakdown of the narrative into macro and micro parts is just as critical for someone hoping to act on your story, first, to aid that person in understanding your story and the valuation that emerges from it, and second, to help your listener judge how much faith he or she should have in your story. After all, if you have a woeful track record in forecasting oil prices, and the bulk of your story on Exxon is built on your oil price forecasts, I should be skeptical about your final valuation.
The Corporate Life Cycle
The narratives of the company change as you move forward within the corporate life cycle as discussed in the earlier chapters. Have a look at the following diagram to recall.
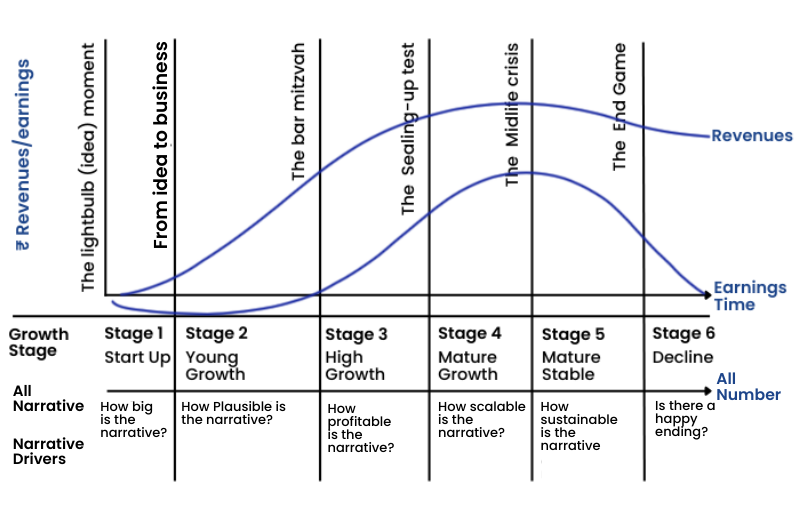
Early on in the corporate life cycle, not only is it your story that drives your valuation of a business, but you are also likely to see wide variations across investors in story lines and valuations. As a company ages, the numbers start to play a greater role in determining value, and it is possible that you can attach a value for a company based purely on its numbers, perhaps by extrapolating historical data.
To understand why there are differences in corporate life cycles across firms, the professor looks at three factors:
- Market entry: Some businesses have substantial barriers to entry, either because of regulatory/licensing requirements or due to capital investments that need to be made. In other businesses, entry is much easier, often requiring little or no regulatory approval or intensive capital investment.
- Scaling up: Building on the first point, once you enter a business, the ease with which you can scale up will vary across businesses, some requiring time and substantial capital investments to get bigger, and others not.
- Consumer inertia/stickiness: In some markets, consumers are much more willing to shift from established products to new ones because they have little attachment (emotional or economic) to the products and/or because there are low costs to switching to a new product.
Other things remaining equal, if market entry is easy, scaling up can be done at low cost, and consumer inertia is low, the growth phase of the life cycle will be much more rapid.
A Comparison of Corporate life cycle in tech and non tech companies:

The following image and its description summarizes the chapter well.
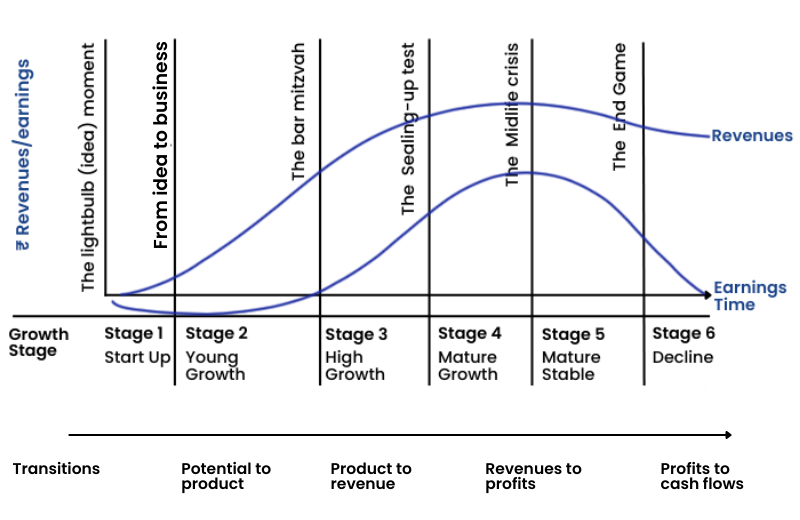
Stage 1: Start-Up
- Key questions: Is there a market for the product or service? How big is that market? Will you survive?
- Pricing metrics & measures: Market size, cash on hand, access to capital
- Narrative Vs Numbers: Mostly or all narrative
- Value drivers: Total market size, market share, and target margin
- Dangers: Macro delusions where companies are collectively overpriced, given the market price.
Stage 2: Young growth
- Key questions: Do people use your product or service? How much do they like it?
- Pricing metrics & measures: Number of users, user intensity (EV/Users)
- Narrative Vs Numbers: More narrative than numbers
- Value drivers: Revenue growth & its drivers
- Dangers: Value distractions, with a focus on wrong revenue drivers
Stage 3: High growth
- Key questions: Will people pay for the product or service? Can you scale up, that is, grow as you get bigger?
- Pricing metrics & measures: User engagement with model revenues (EV/sales)
- Narrative Vs Numbers: Mix of narrative and numbers
- Value drivers: Revenue growth and reinvestment
- Dangers: Growth illusions, with failure to factor-in the cost of growth.
Stage 4 & 5: Stable
- Key questions: Can you make money on the product or service and sustain profitability in the face of competition?
- Pricing metrics & measures: Eamings levels and growth (PE, EV/EBIT)
- Narrative Vs Numbers: More numbers than narrative
- Value drivers: Operating margins and return capital
- Dangers: Disruption denial with failure to see threats to sustainable profits.
Stage 6: Decline
- Key questions: What will you get if you sell your assets? How do you plan to return cash flows to your investors?
- Pricing metrics & measures: Cash flows, payout, and debt servicing (PBIV, EV/EBITDA)
- Narrative Vs Numbers: Mostly or all numbers
- Value drivers: Dividends/cash returns and debt ratios
- Dangers: Liquidation leakage with unrealistic assumptions about what others will pay for liquidated assets.
The Managerial Challenge
While much of this book has been written from the perspective of investors in companies and how they can combine storytelling and number-crunching skills in investing, there are lessons for managers and founders of businesses as well.
In keeping with the narrative/number mix over the corporate life cycle, the challenges faced by managers/founders shifts as a company ages. Early in the life cycle, founders need to be compelling storytellers, capable of convincing investors of the viability and potential of a business, even when there are no results (or even products) to point to.
As the firm transitions from the idea to the business stage, the promoters of the business need to bring business-building skills into the equation to convert promises to numbers. When the firm starts to grow, the test for managers is whether they can start delivering results that back up the story.
In maturity, managers need to frame their narratives to match up to the numbers that are being delivered; continuing to tell a growth story when a company’s revenues are flat will lead to a loss of credibility. In the final stages, managers will be tested on their ability to get past denial, accept that the business is in decline, and act accordingly.
A soaring narrative is more exciting and is likely to attract more investor attention and yield a higher valuation or pricing for the company than a smaller, more constrained one. However, a soaring narrative will also require more resources to convert into reality and is more likely to result in disappointments down the road.
The following table summarizes the structure well.

What are the qualities that make for a good top manager?
The answer depends on where a company is in its life cycle. Early in a company’s life, you want a visionary top manager, adept at packaging and telling a compelling story. As the company grows, the skill set you look for will shift to include more business-building skills, and those will be displaced by more administrative capabilities with mature companies. Finally, in decline, you want a realist running the business, someone who has no qualms about shrinking its size.
Conclusion
In the end, here are a few key takeaways from the book:
- A valuation that is not backed up by a story is both soulless and untrustworthy
- Stories and numbers play an important role in investing and business valuation.
- A good story can make a huge difference in the success of a business.
- Stories create connections and get remembered, but numbers convince people.
- Stories should have a reality-checked for "possibility, plausibility, and probability".
Finally, what we can conclude after reading this book is that stories without numbers are just fairy tales and numbers without stories to back them up are exercises in financial modeling.


