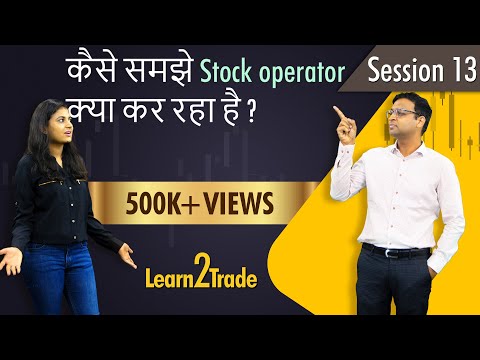
केसे समझे Stock Operator क्या कर रहा है?
 Vivek Bajaj20 Years of Experience
Learn2Trade Series: Episode 13
In the 13th episode of the Learn2Trade series, our expert, Mr. Vivek Bajaj will discuss the key aspects of trading—Volume indicator, Delivery indicator, and Open Interest (VWAP) indicator
These are the components that are pretty significant in understanding market dynamics. By using these indicators, traders can understand how the operators work in the stock market. The stock market operators control stock prices in the stock market. As a trader, you need to recognize the stock operator's tricks to participate in the stock. The goal is to understand the operator's goal, identified through these three key components and price action.
What You Will Learn:
In this video, Vivek Bajaj will discuss about the significant process of tracking stock market operators. By analyzing volume patterns, delivery data, and open interest metrics, you can understand operators' intentions in the stock market and can make informed decisions.
Mr. Bajaj explains that volume in the stock market represents the amount traded at a particular price point, whether it is intraday or overnight. Understanding the mechanism of volume is like looking into the heart of the market. But why is volume crucial? These stock market operators, or big players in the market, leave footprints in the form of volume spikes. Mr. Bajaj adds that traders can gain insights into their intentions by tracking volume alongside price action.
The overnight positions that stock market operators or investors hold are called deliveries. Mr. Bajaj states that delivery data is not readily available on platforms like TradingView, tools like StockEdge offer profitable insights into this aspect. By monitoring delivery data, he adds traders can identify the idea behind market moves. Predicting the trend by analyzing delivery volume, especially during the breakouts is quite possible. On a day when delivery quantity outweighs the traded volume greatly, it indicates strong interest from market participants. Analyzing these key levels on your charts can serve as strategic reference points in your trading journey.
Frequently Asked Questions (FAQs)
Q1. Who are operators in stock market?
They are traders, investors, or participants in the stock market who trade with the intention of manipulating the stock price by increasing stock volume. The stock prices keep rising when they raise the volume of stocks traded in the stock market by trading in a circle and raising the stock price.
Q2. What are the different types of operators in stock exchange?
In the stock exchange, various stock operators influence market dynamics. Institutional investors like mutual and hedge funds deploy substantial capital. Market makers, large financial institutions, and corporate insiders impact stock prices. Illicit operators engage in schemes like "pump and dump." To make informed decisions, traders need to know how to distinguish the positive ones from the manipulative ones.
Q3. How do you analyze the volume?
The volume shows how much is exchanged at various price points. Assessing the operator's intent is made easier by analyzing volume along with price movements. Selling pressure is indicated by red candles with growing red volume, while buying pressure is shown by green candles with increasing green volume.
Q4. What is the concept of delivery volume?
Delivery volume can be derived by deducting the intraday volume from the total volume. The main difference between traded volume and delivery volume is that traded volume is the total number of shares traded in a day, and delivery volume is the intraday volume minus the total volume.
Q5. How does VWAP help in identifying support/resistance zones and operator activity?
VWAP is the average price considering the volume of trades. Tracking VWAP levels helps identify potential demand or supply zones where significant trading activity has occurred. By using VWAP, you can draw lines on charts at significant price points where delivery data suggests the operator's activity. These levels act as potential support or resistance zones, helping in decision-making.
Q6. How does analyzing volume, delivery, and price action enhance understanding of market dynamics and operator psychology?
Analyzing Volume-Delivery Data is a crucial aspect of understanding market dynamics and gaining insights into operator psychology in the stock market. By combining volume and delivery parameters with price action, you can make more informed decisions, identify trends, and understand the underlying dynamics of the market.
Q7. What is open interest?
Open interest defines the total number of open or outstanding contracts presently held by the market participant at a given time. Open Interest analysis helps identify stock market trends.
Enroll for Learning Stock Markets Effortlessly with Stock Markets Made Easy Course
About Mr. Vivek Bajaj

The passion for data, analytics and technology is what makes Vivek Bajaj a financial market survivor. The journey as a market participant started in 2002 when the first trade was executed in the options contract of ITC. Life was simpler and easier during that time. Since then technology and Big data have taken over totally. As an early adapter to the complex tools, Kredent was formed to capitalise on the opportunities. He is co-founder of StockEdge and is committed to bring simplicity in the complex world of market data. He is a Chartered Accountant, Company Secretary and an MBA from IIM Indore. He is a part of various committees of exchanges and regulator and he has been an active contributor in the evolution of Indian Derivatives Market.

Other series by Elearnmarkets
Through this series, watch Vivek Bajaj simplify investing and key components required to build a habit of investing and unleash the power of compounding.
All Episodes
 Episode 1Stock Market में Trading की शुरुआत कैसे करे ?
 Episode 2Share Market में Trends और Charts कैसे बनाते है?
 Episode 3Trading Terminal क्या है और उसका प्रयोग कैसे करे ?
 Episode 44000+ Stocks में से कौनसे Stocks Select की जाये?
 Episode 5आसान तरीके से Charts Track करे | TradingView का पूर्ण प्रयोग सीखे |
 Episode 6Share Market में High Momentum Stocks कैसे निकाले?
 Episode 7Sector की तेजी से High Momentum Stocks कैसे निकाले? - Swing Trading Strategy
 Episode 8Derivatives का Basic Concept सरल भाषा में |
 Episode 9क्या है Commodities Market और क्यों हमें जानना चाहिए?
 Episode 10क्या है Commodities Market और इससे पैसे कैसे बनाये ?
 Episode 11क्या है Currency Market और कैसे Trade करे?
 Episode 12क्या है Moving Average का महत्त्व Share Market में Trading के लिए?
 Episode 13केसे समझे Stock Operator क्या कर रहा है?
 Episode 14Open Interest से Stock Operator के Position को कैसे समझे ?
 Episode 15Stock से सही Time पे कैसे निकलें ?
 Episode 16Fibonacci Retracement से Stock Trading कैसे करें ?
 Episode 17Stock Trading में कितना Capital और कितना Stop Loss होना चाहिए?
 Episode 18Candlestick Patterns क्या है और इससे Trading कैसे करें?
 Episode 19Relative Strength से समझें किस Stock में तेज़ी खेलना है।
 Episode 20किसी भी Stock के Volatility को कैसे समझें?
 Episode 21Bollinger Bands से Volatile Stocks में Trading कैसे करें?
 Episode 22Stock से EXIT करने का एक सरल तरीका।
 Episode 23Stock Trading के लिए Relative Strength Index को कैसे use करें?
 Episode 24अगर Stock Market में Successful होना है तो ये daily करो।
 Episode 25Intraday Trade 12 बजे के पहले करो और पैसे बनाओ ।
 Episode 26इस Trading Strategy से Powerful Stocks में Trade करें ।
 Episode 27Day Trading के लिए Mother-Daughter Trading Strategy |
 Episode 28Profitable Stocks में Trade कैसे करें?
 Episode 29Operator का move समझने के लिए ये Excel रोज बनाओ |
 Episode 30Excelगिरी करो और Stock Operator का Position समझो।
 Episode 31Special Gift: Highly Profitable Premium RS Strategy सभी के लीए।
 Episode 32Trading Strategies की अहम बातें - Stop Loss, Take Profit etc.
 Episode 33Options Trading का पहला कदम।
 Episode 34क्या है Option Chain और कैसे Analyse करे? | Options Trading-2
 Episode 35Options Greeks का सबसे सरल ज्ञान इधर मिलेगा। Options Trading - 3
 Episode 36Options Trading में Implied Volatility क्या होता है ? | Option Trading - 4
 Episode 37Options #Strategies कैसे बनाते है? | #Options #Trading - 5
 Episode 38एक Options Strategy आपके Extra Earnings के लिए। | Options Trading - 6
  Episode 39Straddle और Strangle Options Strategies से Volatile Market में कैसे Trading करे?
 Episode 40Technical Analysis Use करके Options में कैसे Trade करे ? | Options Trading - 8
 Episode 41High-Risk, High-Return Trading Strategy : Pair Trading
 Episode 42A2Z of Currency Market
 Episode 43Currency Market का Trading Strategy
 Episode 44Copper track करो और Equity में Trade करो।
 Episode 45Zinc Commodity को Study करके Stock Trading करो।
 Episode 46Nickel Commodity के बारे में पुरा ज्ञान |
 Episode 47Aluminium और Lead से किस Sector को Impact होता है?
 Episode 48Mother of all Commodities: Crude Oil के बारे में जरूरी ज्ञान।
 Episode 49Silver में क्यों और केसे Invest करना चाहिए ?
 Episode 50Final #Learn2Trade Session to become a Professional Trader !
  Episode 5115 CANDLESTICK Patterns for Profitable Trading !!!
 Episode 526 Momentum Indicators a Trader must know!
 Episode 53Top Chart Patterns a Stock Trader must know!!!
 Episode 54The second most important Stock Market Data!!!
 Episode 55Catch the Trend with these 3 Trend Indicators!
 Episode 56सीखिए Sectors देखके Strong Stocks Select करने का सही तरीका |
 Episode 57How to catch Operator's position in Cash Market Stocks?
 Episode 58How to identify which Sector the Stock Operator is betting on?
 Episode 59How to Trade/Invest in Falling Market?
 Episode 60Top Volatility Technical Indicators You Should Know!!!
 Episode 61Short Selling Strategies in Falling Stock Market!
 Episode 62How to Trade Stocks in News???
 Episode 63How to Track Operator Positions in FnO Stocks??
 Episode 64Special Strategy: Stock Trading using Quarterly Results!!!
 Episode 65Which SOFTWARE to use for TECHNICAL ANALYSIS ??
 Episode 66How I Identified & Traded HUDCO & MCX from my RS Model??
 Episode 67How to make money in a Range Bound Market ?

Other series by Elearnmarkets
Through this series, watch Vivek Bajaj simplify investing and key components required to build a habit of investing and unleash the power of compounding.